


 |
市場調查報告書
商品編碼
1766187
汽車邊緣運算市場機會、成長動力、產業趨勢分析及 2025 - 2034 年預測Automotive Edge Computing Market Opportunity, Growth Drivers, Industry Trend Analysis, and Forecast 2025 - 2034 |
||||||
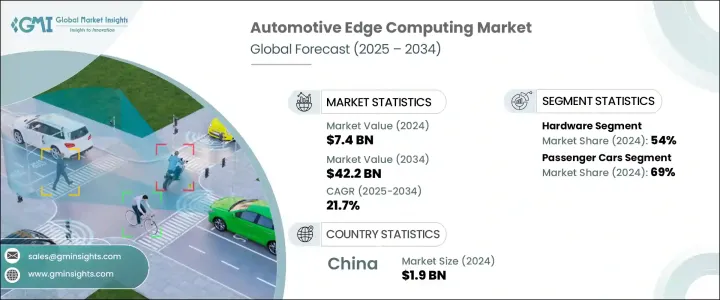
2024年,全球汽車邊緣運算市場規模達74億美元,預計到2034年將以21.7%的複合年成長率成長,達到422億美元。隨著汽車產業的快速發展,車輛正日益成為能夠即時處理大量資料的智慧平台。自動駕駛技術和互聯出行解決方案的蓬勃發展正推動著這一轉變。因此,傳統的集中式運算模式正顯著轉向基於邊緣的資料處理,這使得運算能力更接近源頭——車輛內部。
汽車邊緣運算在支援這一轉變中發揮關鍵作用,它提供管理複雜車載功能所需的低延遲和高頻寬。它增強了對現代車輛安全高效運行至關重要的即時決策能力。互聯功能的激增和先進車載感測器的日益普及導致資料爆炸性成長,迫切需要車載分析和即時響應系統。邊緣運算無需將資料路由到遙遠的雲端中心,而是使車輛能夠在源頭分析資訊並採取行動,從而減少網路擁塞和回應時間,同時提高效能、安全性和可靠性。
| 市場範圍 | |
|---|---|
| 起始年份 | 2024 |
| 預測年份 | 2025-2034 |
| 起始值 | 74億美元 |
| 預測值 | 422億美元 |
| 複合年成長率 | 21.7% |
這對於駕駛輔助、預測性維護和智慧路線規劃等應用至關重要。隨著製造商向以軟體為中心的車輛架構轉型,整合先進的邊緣平台對於建立面向下一代移動出行的可擴展、安全且高效的交通系統至關重要。
就組件而言,市場分為硬體、軟體和服務。硬體在2024年成為領先細分市場,貢獻了近54%的全球市場佔有率,預計在整個預測期內將以超過22%的複合年成長率成長。高效能運算單元、人工智慧最佳化處理器和汽車級模組的持續部署,凸顯了邊緣硬體在處理複雜資料流方面日益成長的重要性。這些組件經過精心設計,能夠承受極端的車輛環境,同時確保即時監控和自主導航等應用的持續處理能力。
依車輛類型分類,市場分為乘用車和商用車。乘用車在2024年佔據主導地位,約佔市場總收入的69%。預計該細分市場在2025年至2034年期間的複合年成長率將超過23%。乘用車對整合數位功能、個人化駕駛體驗和進階駕駛輔助系統的需求日益成長,推動了邊緣運算技術的普及。這些車輛需要強大的處理能力來管理來自各種嵌入式系統的資料輸入,從而實現即時決策,從而提升使用者體驗和車輛安全性。
根據部署模式,該產業可分為雲端部署和本地部署解決方案。雲端部署憑藉其靈活性、可擴展性以及支援各種連網汽車功能的能力,繼續佔據相當大的市場佔有率。這些平台支援無縫軟體整合、遠端更新和集中協調,這對於自動駕駛和車隊管理等新興用例至關重要。隨著人們越來越依賴支援動態路線最佳化、資訊娛樂交付和預測性診斷等服務的車雲端基礎設施,雲端部署的廣泛應用也得到了推動。
從區域來看,中國在2024年引領全球汽車邊緣運算市場,創造了約19億美元的收入,佔據了亞太地區約63%的市場。中國在智慧旅行領域的快速擴張,加上其作為全球最大汽車生產國的地位,使其在邊緣技術應用方面處於領先地位。政府的大力支持、電動車的快速發展以及車聯網系統的大規模部署,將繼續推動該地區市場的成長。
隨著汽車製造商和技術供應商優先考慮更快、更智慧、更去中心化的處理系統,汽車邊緣運算領域正在經歷結構性轉型。對即時資料解讀的需求日益成長,尤其是在安全敏感的駕駛條件下,這促使人們從根本上重新思考車輛內部資訊的處理方式。如今,各大公司正專注於將人工智慧功能、輕量級資料處理框架和強大的安全協議直接整合到車載環境中。這些進步旨在將原始感測器輸出轉化為可即時採取行動的有意義的洞察,從而創造更安全、更具適應性、更有效率的交通系統。
目錄
第1章:方法論
- 市場範圍和定義
- 研究設計
- 研究方法
- 資料收集方法
- 資料探勘來源
- 全球的
- 地區/國家
- 基礎估算與計算
- 基準年計算
- 市場評估的主要趨勢
- 初步研究和驗證
- 主要來源
- 預測模型
- 研究假設和局限性
第2章:執行摘要
第3章:行業洞察
- 產業生態系統分析
- 供應商格局
- 利潤率分析
- 成本結構
- 每個階段的增值
- 影響價值鏈的因素
- 中斷
- 產業衝擊力
- 成長動力
- 自動駕駛和連網汽車的需求不斷成長
- 車載感測器資料量不斷增加
- 增強資訊娛樂和車載體驗
- 政府對道路安全和資料在地化的監管
- 產業陷阱與挑戰
- 初始基礎設施成本高
- 資料隱私與合規性的複雜性
- 市場機會
- 與人工智慧和機器學習整合以進行決策
- 智慧城市與V2X生態系擴展
- 成長動力
- 成長潛力分析
- 監管格局
- 北美洲
- 歐洲
- 亞太地區
- 拉丁美洲
- 中東和非洲
- 波特的分析
- PESTEL分析
- 技術和創新格局
- 當前的技術趨勢
- 新興技術
- 成本細分分析
- 軟體開發和授權成本
- 部署和整合成本
- 維護和支援成本
- 網路安全與合規成本
- 培訓和變更管理成本
- 專利分析
- 永續性和環境方面
- 永續實踐
- 減少廢棄物的策略
- 生產中的能源效率
- 環保舉措
- 碳足跡考量
- 用例
- 最佳情況
- 消費者行為與採用趨勢
- 使用者體驗和介面趨勢
第4章:競爭格局
- 介紹
- 公司市佔率分析
- 北美洲
- 歐洲
- 亞太地區
- 拉丁美洲
- MEA
- 主要市場參與者的競爭分析
- 競爭定位矩陣
- 戰略展望矩陣
- 關鍵進展
- 併購
- 夥伴關係與合作
- 新產品發布
- 擴張計劃和資金
第5章:市場估計與預測:按組件,2021 - 2034 年
- 主要趨勢
- 硬體
- 邊緣節點
- 閘道
- 邊緣伺服器
- 軟體
- 邊緣設備管理
- 分析和處理軟體
- 安全軟體
- 服務
- 專業的
- 系統整合與部署
- 諮詢與策略
- 培訓與支援
- 託管
- 遠端監控和管理
- 維護和更新
- 安全管理
- 專業的
第6章:市場估計與預測:依車型,2021 - 2034 年
- 主要趨勢
- 搭乘用車
- 轎車
- 掀背車
- SUV
- 商用車
- 輕型
- 中型
- 重負
第7章:市場估計與預測:依部署模式,2021 - 2034 年
- 主要趨勢
- 基於雲端
- 本地
第8章:市場估計與預測:依企業規模,2021 - 2034 年
- 主要趨勢
- 中小企業
- 大型企業
第9章:市場估計與預測:按應用,2021 - 2034 年
- 主要趨勢
- 自動駕駛和網聯駕駛
- 車載體驗與資訊娛樂
- 預測性維護和診斷
- 車隊和交通管理
- 網路安全和資料保護
第10章:市場估計與預測:按地區,2021 - 2034 年
- 主要趨勢
- 北美洲
- 美國
- 加拿大
- 歐洲
- 德國
- 英國
- 法國
- 義大利
- 西班牙
- 北歐人
- 俄羅斯
- 亞太地區
- 中國
- 印度
- 日本
- 澳洲
- 韓國
- 東南亞
- 拉丁美洲
- 巴西
- 墨西哥
- 阿根廷
- MEA
- 南非
- 沙烏地阿拉伯
- 阿拉伯聯合大公國
第 11 章:公司簡介
- Amazon
- Arteris IP
- Autotalks
- Bosch Group
- Cisco
- ETAS GmbH
- FogHorn Systems
- GreenWave Systems
- Hewlett Packard Enterprise (HPE)
- Huawei
- IBM
- Infineon Technologies
- Intel
- Microsoft
- Mobileye
- NVIDIA
- NXP Semiconductors
- Qualcomm Technologies
- Siemens
- Teradata
The Global Automotive Edge Computing Market was valued at USD 7.4 billion in 2024 and is estimated to grow at a CAGR of 21.7% to reach USD 42.2 billion by 2034. As the automotive industry rapidly evolves, vehicles are increasingly becoming intelligent platforms capable of processing vast amounts of data in real time. This transformation is being driven by the surge in autonomous driving technologies and connected mobility solutions. As a result, there is a significant shift away from traditional centralized computing models to edge-based data processing, which places computational power closer to the source-inside the vehicle itself.
Automotive edge computing is playing a pivotal role in supporting this shift by delivering the low latency and high bandwidth required to manage complex in-vehicle functions. It enhances real-time decision-making capabilities critical to the safe and efficient operation of modern vehicles. The proliferation of connected features and the growing use of advanced in-vehicle sensors are contributing to an explosion of data, creating a pressing need for on-board analytics and instant response systems. Rather than routing data to distant cloud centers, edge computing empowers vehicles to analyze and act on information at the source, reducing network congestion and response time while enhancing performance, safety, and reliability.
| Market Scope | |
|---|---|
| Start Year | 2024 |
| Forecast Year | 2025-2034 |
| Start Value | $7.4 Billion |
| Forecast Value | $42.2 Billion |
| CAGR | 21.7% |
This is becoming essential for applications such as driver assistance, predictive maintenance, and intelligent route planning. As manufacturers transition toward software-centric vehicle architectures, the integration of advanced edge platforms becomes vital for creating scalable, secure, and efficient transportation systems built for the next generation of mobility.
In terms of components, the market is categorized into hardware, software, and services. Hardware emerged as the leading segment in 2024, contributing nearly 54% of the global market share, and is anticipated to grow at a CAGR exceeding 22% throughout the forecast period. The rising deployment of high-performance computing units, AI-optimized processors, and automotive-grade modules underscores the growing importance of edge hardware in handling complex data streams. These components are engineered to endure extreme vehicle environments while ensuring continuous processing power for applications like real-time monitoring and autonomous navigation.
By vehicle type, the market is divided into passenger cars and commercial vehicles. Passenger cars held a dominant position in 2024, accounting for approximately 69% of the total market revenue. This segment is set to expand at a CAGR of over 23% between 2025 and 2034. The increasing demand for integrated digital features, personalized driver experiences, and advanced driver-assist systems in passenger vehicles is driving the uptake of edge computing technologies. These vehicles require robust processing capabilities to manage data inputs from various embedded systems, enabling real-time decisions that improve both user experience and vehicle safety.
Based on deployment mode, the industry is segmented into cloud-based and on-premises solutions. Cloud-based deployment continues to command a significant share of the market due to its flexibility, scalability, and ability to support a wide range of connected vehicle functions. These platforms allow seamless software integration, remote updates, and centralized coordination, which are critical for emerging use cases in autonomous driving and fleet management. Their widespread adoption is being propelled by the increasing reliance on vehicle-to-cloud infrastructure that supports services like dynamic route optimization, infotainment delivery, and predictive diagnostics.
Regionally, China led the global automotive edge computing market in 2024, generating around USD 1.9 billion in revenue and capturing roughly 63% of the Asia Pacific market. The country's rapid expansion in smart mobility initiatives, coupled with its position as the world's largest automotive producer, has positioned it at the forefront of edge technology adoption. Strong governmental support, fast-paced development in electric vehicles, and massive deployment of connected vehicle systems continue to bolster market growth in the region.
The automotive edge computing landscape is undergoing a structural transformation as automakers and technology providers prioritize faster, more intelligent, and decentralized processing systems. Growing requirements for instantaneous data interpretation, especially in safety-sensitive driving conditions, are prompting a fundamental rethinking of how information is handled within vehicles. Companies are now focused on integrating AI capabilities, lightweight data processing frameworks, and robust security protocols directly into in-vehicle environments. These advancements are designed to transform raw sensor outputs into meaningful insights that can be acted upon in real time, thus enabling safer, more adaptive, and more efficient transportation systems.
Table of Contents
Chapter 1 Methodology
- 1.1 Market scope and definition
- 1.2 Research design
- 1.2.1 Research approach
- 1.2.2 Data collection methods
- 1.3 Data mining sources
- 1.3.1 Global
- 1.3.2 Regional/Country
- 1.4 Base estimates and calculations
- 1.4.1 Base year calculation
- 1.4.2 Key trends for market estimation
- 1.5 Primary research and validation
- 1.5.1 Primary sources
- 1.6 Forecast model
- 1.7 Research assumptions and limitations
Chapter 2 Executive Summary
- 2.1 Industry 3600 synopsis, 2021 – 2034
- 2.2 Key market trends
- 2.2.1 Regional
- 2.2.2 Component
- 2.2.3 Vehicle
- 2.2.4 Deployment mode
- 2.2.5 Enterprise size
- 2.2.6 Application
- 2.3 TAM Analysis, 2025-2034
- 2.4 CXO perspectives: strategic imperatives
- 2.4.1 Executive decision points
- 2.4.2 Critical success factors
- 2.5 Future outlook and strategic recommendations
Chapter 3 Industry Insights
- 3.1 Industry ecosystem analysis
- 3.1.1 Supplier landscape
- 3.1.2 Profit margin analysis
- 3.1.3 Cost structure
- 3.1.4 Value addition at each stage
- 3.1.5 Factor affecting the value chain
- 3.1.6 Disruptions
- 3.2 Industry impact forces
- 3.2.1 Growth drivers
- 3.2.1.1 Growing demand for autonomous and connected vehicles
- 3.2.1.2 Increasing data volume from in-vehicle sensors
- 3.2.1.3 Enhanced infotainment and in-vehicle experience
- 3.2.1.4 Government regulations for road safety and data localization
- 3.2.2 Industry pitfalls and challenges
- 3.2.2.1 High initial infrastructure cost
- 3.2.2.2 Data privacy & compliance complexities
- 3.2.3 Market opportunities
- 3.2.3.1 Integration with AI and ML for decision-making
- 3.2.3.2. Smart city & V2 X ecosystem expansion
- 3.2.1 Growth drivers
- 3.3 Growth potential analysis
- 3.4 Regulatory landscape
- 3.4.1 North America
- 3.4.2 Europe
- 3.4.3 Asia Pacific
- 3.4.4 Latin America
- 3.4.5 Middle East & Africa
- 3.5 Porter's analysis
- 3.6 PESTEL analysis
- 3.7 Technology and innovation landscape
- 3.7.1 Current technological trends
- 3.7.2 Emerging technologies
- 3.8 Cost breakdown analysis
- 3.8.1 Software development & licensing cost
- 3.8.2 Deployment & integration cost
- 3.8.3 Maintenance & support cost
- 3.8.4 Cybersecurity & compliance cost
- 3.8.5 Training & change management cost
- 3.9 Patent analysis
- 3.10 Sustainability and environmental aspects
- 3.10.1 Sustainable practices
- 3.10.2 Waste reduction strategies
- 3.10.3 Energy efficiency in production
- 3.10.4 Eco-friendly Initiatives
- 3.10.5 Carbon footprint considerations
- 3.11 Use cases
- 3.12 Best-case scenario
- 3.13 Consumer behaviour & adoption trends
- 3.14 User experience & interface trends
Chapter 4 Competitive Landscape, 2024
- 4.1 Introduction
- 4.2 Company market share analysis
- 4.2.1 North America
- 4.2.2 Europe
- 4.2.3 Asia Pacific
- 4.2.4 LATAM
- 4.2.5 MEA
- 4.3 Competitive analysis of major market players
- 4.4 Competitive positioning matrix
- 4.5 Strategic outlook matrix
- 4.6 Key developments
- 4.6.1 Mergers & acquisitions
- 4.6.2 Partnerships & collaborations
- 4.6.3 New product launches
- 4.6.4 Expansion plans and funding
Chapter 5 Market Estimates & Forecast, By Component, 2021 - 2034 ($Mn)
- 5.1 Key trends
- 5.2 Hardware
- 5.2.1 Edge nodes
- 5.2.2 Gateways
- 5.2.3 Edge servers
- 5.3 Software
- 5.3.1 Edge device management
- 5.3.2 Analytics & processing software
- 5.3.3 Security software
- 5.4 Services
- 5.4.1 Professional
- 5.4.1.1 System integration & deployment
- 5.4.1.2 Consulting & strategy
- 5.4.1.3 Training & support
- 5.4.2 Managed
- 5.4.2.1 Remote monitoring & management
- 5.4.2.2 Maintenance & updates
- 5.4.2.3 Security management
- 5.4.1 Professional
Chapter 6 Market Estimates & Forecast, By Vehicle, 2021 - 2034 ($Mn)
- 6.1 Key trends
- 6.2 Passenger cars
- 6.2.1 Sedans
- 6.2.2 Hatchbacks
- 6.2.3 SUVs
- 6.3 Commercial vehicles
- 6.3.1 Light duty
- 6.3.2 Medium duty
- 6.3.3 Heavy duty
Chapter 7 Market Estimates & Forecast, By Deployment Mode, 2021 - 2034 ($Mn)
- 7.1 Key trends
- 7.2 Cloud-based
- 7.3 On-premises
Chapter 8 Market Estimates & Forecast, By Enterprise Size, 2021 - 2034 ($Mn)
- 8.1 Key trends
- 8.2 SME
- 8.3 Large enterprises
Chapter 9 Market Estimates & Forecast, By Application, 2021 - 2034 ($Mn)
- 9.1 Key trends
- 9.2 Autonomous and connected driving
- 9.3 In-vehicle experience & infotainment
- 9.4 Predictive maintenance & diagnostics
- 9.5 Fleet & traffic management
- 9.6 Cybersecurity & data protection
Chapter 10 Market Estimates & Forecast, By Region, 2021 - 2034 ($Mn)
- 10.1 Key trends
- 10.2 North America
- 10.2.1 U.S.
- 10.2.2 Canada
- 10.3 Europe
- 10.3.1 Germany
- 10.3.2 UK
- 10.3.3 France
- 10.3.4 Italy
- 10.3.5 Spain
- 10.3.6 Nordics
- 10.3.7 Russia
- 10.4 Asia Pacific
- 10.4.1 China
- 10.4.2 India
- 10.4.3 Japan
- 10.4.4 Australia
- 10.4.5 South Korea
- 10.4.6 Southeast Asia
- 10.5 Latin America
- 10.5.1 Brazil
- 10.5.2 Mexico
- 10.5.3 Argentina
- 10.6 MEA
- 10.6.1 South Africa
- 10.6.2 Saudi Arabia
- 10.6.3 UAE
Chapter 11 Company Profiles
- 11.1 Amazon
- 11.2 Arteris IP
- 11.3 Autotalks
- 11.4 Bosch Group
- 11.5 Cisco
- 11.6 ETAS GmbH
- 11.7 FogHorn Systems
- 11.8 GreenWave Systems
- 11.9 Hewlett Packard Enterprise (HPE)
- 11.10 Huawei
- 11.11 IBM
- 11.12 Infineon Technologies
- 11.13 Intel
- 11.14 Microsoft
- 11.15 Mobileye
- 11.16 NVIDIA
- 11.17 NXP Semiconductors
- 11.18 Qualcomm Technologies
- 11.19 Siemens
- 11.20 Teradata
 汽車電腦系統市場:2026-2032年全球市場預測(依車輛類型、應用程式、作業系統、部署方式、連接方式及顯示類型分類)
 汽車高效能運算(HPC)平台市場-策略洞察與預測(2026-2031年)
 2026-2030年全球車載電腦系統市場
 汽車邊緣運算閘道市場機會、成長促進因素、產業趨勢分析及預測(2025-2034年)
 車用電腦斷層掃描市場:掃描器類型、應用、最終用戶和地區的分析和預測(2025 年至 2034 年)
 全球汽車電子電氣架構市場
 全球車載電腦系統市場規模研究與預測(按應用、產品、車輛類型、記憶體大小和區域預測,2022 年至 2032 年)汽車電子電氣 (E-E) 架構市場機會、成長動力、產業趨勢分析及 2025 - 2034 年預測
 汽車電子電氣架構市場(按類型、車型、動力系統、零件、國家和地區)-2025 年至 2032 年產業分析、市場規模、市場佔有率及預測