


 |
市場調查報告書
商品編碼
1766178
硫酸銨市場機會、成長動力、產業趨勢分析及2025-2034年預測Ammonium Sulphate Market Opportunity, Growth Drivers, Industry Trend Analysis, and Forecast 2025 - 2034 |
||||||
2024年,全球硫酸銨市場價值為36億美元,預計到2034年將以3.5%的複合年成長率成長,達到50億美元。這一成長的驅動力源於全球糧食生產需求的日益成長、農業經營規模的不斷擴大以及為不斷成長的人口提供安全食品供應鏈的需求。硫酸銨持續受到強勁的關注,這主要得益於其作為氮基肥料的關鍵作用及其在各工業領域日益廣泛的應用。硫酸銨在鹼性土壤中的高溶解性和高效性使其成為提高作物產量的首選,尤其是在水稻、玉米和小麥種植中。在政府推動永續農業實踐的舉措的支持下,硫酸銨在發展中地區的應用日益廣泛。
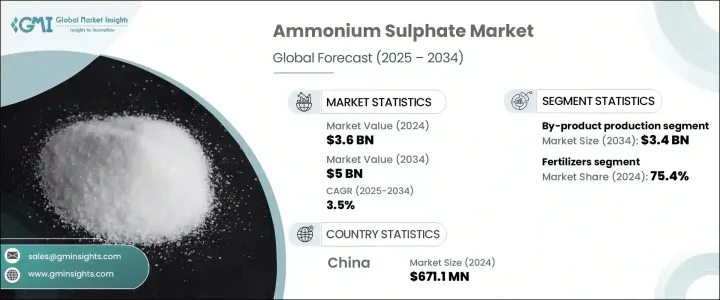
全球超過75%的硫酸銨需求來自化肥。在亞太地區,尤其是中國和印度等國家,人口成長和對耕地擴張的日益重視導致化肥消費量增加。硫酸銨在水處理、製藥和食品加工等工業領域也扮演越來越重要的角色。其在煙氣脫硫系統中的應用已變得越來越重要,尤其是在執行嚴格空氣品質標準的地區。隨著全球法規的不斷收緊,透過排放控制技術推動清潔航運也推動了硫酸銨的使用。
| 市場範圍 | |
|---|---|
| 起始年份 | 2024 |
| 預測年份 | 2025-2034 |
| 起始值 | 36億美元 |
| 預測值 | 50億美元 |
| 複合年成長率 | 3.5% |
2024年,副產品生產方法貢獻了24億美元的市場規模,預計到2034年將達到34億美元,維持3.5%的複合年成長率。副產品生產佔68.4%,因為它成本效益高,並且能夠以環保的方式利用廢液。此方法可在焦爐煤氣和己內醯胺等物料加工過程中以及在煤煙氣洗滌過程中回收硫酸銨。這些方法在降低生產成本的同時,也解決了環境問題,尤其是在《工業排放指令》等鼓勵將硫回收為可用形式(例如硫酸銨)的政策下。
2024年,肥料領域佔據市場主導地位,佔75.4%。由於硫酸銨是一種高效能低成本的氮肥,尤其有助於提高鹼性土壤的養分吸收,該領域將繼續蓬勃發展。硫酸銨支持各種農業活動,包括自給自足型和商業型。玉米、水稻和其他穀物等作物受益於其易用性以及與其他肥料的兼容性。由於政府補貼的增加,以及向精準農業等現代農業戰略的轉變,亞太和拉丁美洲的發展中國家在硫酸銨的應用方面處於領先地位,精準農業可以提高效率並最大限度地減少浪費。
2024年,中國硫酸銨市場產值達6.711億美元,預估年複合成長率為3.6%,到2034年將達到9.539億美元。由於中國強勁的農業產量,該市場正在快速擴張。儘管中國耕地面積不到全球的10%,但卻生產了全球約25%的糧食,這進一步加劇了對硫酸銨等土壤改良劑的嚴重依賴,尤其是在水稻種植方面。中國也受益於不斷成長的工業生產,旨在大規模生產壓實硫酸銨的大規模合作正在推動該行業的發展勢頭。
全球硫酸銨產業的主要參與者包括巴斯夫歐洲公司、宇部興產株式會社、OCI Nitrogen公司、贏創工業股份公司和朗盛股份公司。硫酸銨市場領導者採取的關鍵策略重點是透過策略合作擴大產能、加強成本效益生產技術的研發以及開發增值工業應用。企業正在投資更清潔的生產路線,尤其是己內醯胺和焦爐製程副產品的回收,不僅可以節省成本,還能滿足環境永續監管壓力。透過合資企業和工廠擴建擴大在亞太等高成長地區的業務範圍仍然是一項重要任務。此外,主要企業正在加強其供應鏈和分銷網路,以確保提供更好的服務和本地化支持,尤其是在化肥需求旺盛的新興經濟體。
目錄
第1章:方法論與範圍
第2章:執行摘要
第3章:行業洞察
- 產業生態系統分析
- 供應商概況
- 利潤率
- 每個階段的增值
- 影響價值鏈的因素
- 中斷
- 產業衝擊力
- 成長動力
- 產業陷阱與挑戰
- 市場機會
- 成長潛力分析
- 監管格局
- 北美洲
- 歐洲
- 亞太地區
- 拉丁美洲
- 中東和非洲
- 波特的分析
- PESTEL分析
- 價格趨勢
- 按地區
- 按產品形態
- 未來市場趨勢
- 科技與創新格局
- 當前的技術趨勢
- 新興技術
- 專利態勢
- 貿易統計數據
(註:僅提供重點國家的貿易統計數據
- 主要進口國
- 主要出口國
- 永續性和環境方面
- 永續實踐
- 減少廢棄物的策略
- 生產中的能源效率
- 環保舉措
- 碳足跡考量
第4章:競爭格局
- 介紹
- 公司市佔率分析
- 按地區
- 北美洲
- 歐洲
- 亞太地區
- 拉丁美洲
- MEA
- 按地區
- 公司矩陣分析
- 主要市場參與者的競爭分析
- 競爭定位矩陣
- 關鍵進展
- 併購
- 夥伴關係與合作
- 新產品發布
- 擴張計劃
第5章:市場估計與預測:依生產方式,2021 年至 2034 年
- 主要趨勢
- 合成生產
- 依產品生產
- 己內醯胺生產
- 焦爐操作
- 甲基丙烯酸甲酯生產
- 其他副產品來源
第6章:市場估計與預測:依產品形式,2021 年至 2034 年
- 主要趨勢
- 堅硬的
- 顆粒狀
- 結晶
- 液體
第7章:市場估計與預測:依純度等級,2021 年至 2034 年
- 主要趨勢
- 標準品級(≤99%)
- 高純度等級(>99%)
第 8 章:市場估計與預測:按應用,2021 年至 2034 年
- 主要趨勢
- 肥料
- 純肥料
- 複合肥料
- 特種肥料
- 工業應用
- 紡織業
- 水處理
- 食品添加物
- 阻燃劑
- 化學製造
- 其他
- 製藥
- 其他
第9章:市場估計與預測:按地區,2021 年至 2034 年
- 主要趨勢
- 北美洲
- 美國
- 加拿大
- 歐洲
- 德國
- 英國
- 法國
- 西班牙
- 義大利
- 歐洲其他地區
- 亞太地區
- 中國
- 印度
- 日本
- 澳洲
- 韓國
- 亞太其他地區
- 拉丁美洲
- 巴西
- 墨西哥
- 阿根廷
- 拉丁美洲其他地區
- 中東和非洲
- 沙烏地阿拉伯
- 南非
- 阿拉伯聯合大公國
- 中東和非洲其他地區
第10章:公司簡介
- BASF SE
- AdvanSix Inc.
- CF Industries Holdings, Inc.
- Domo Chemicals GmbH
- Domo Engineering Plastics US
- EuroChem Group AG
- Evonik Industries AG
- Grupa Azoty SA
- Helm AG
- Honeywell International Inc.
- JSC Kuibyshevazot
- Lanxess AG
- Novus International, Inc.
- Nutrien Ltd.
- OCI NV
- Ostchem Holding
- Sinopec
- Sumitomo Chemical Co., Ltd.
- Ube Industries, Ltd.
- Yara International ASA
The Global Ammonium Sulphate Market was valued at USD 3.6 billion in 2024 and is estimated to grow at a CAGR of 3.5% to reach USD 5 billion by 2034. This growth is driven by the increasing need to support global food production, expanding agricultural operations, and the rising demand to secure food supply chains for a growing population. Ammonium sulphate continues to see strong traction primarily due to its critical role as a nitrogen-based fertilizer and its expanding applications across various industrial sectors. Its high solubility and efficiency in alkaline soils make it a preferred choice for enhancing crop yields, especially in rice, maize, and wheat farming. The compound's relevance is rising in developing regions, supported by governmental initiatives promoting sustainable agricultural practices.
More than 75% of global ammonium sulphate demand is attributed to fertilizer usage. In regions like Asia Pacific, especially countries such as China and India, the growing population and increased focus on arable land expansion have resulted in higher fertilizer consumption. The compound also plays a growing role in industrial fields like water treatment, pharmaceutical manufacturing, and food processing. Its application in flue gas desulfurization systems has gained significance, particularly in areas that enforce stringent air quality standards. The push toward cleaner shipping through emission control technologies has also boosted ammonium sulphate usage, as global regulations continue to tighten.
| Market Scope | |
|---|---|
| Start Year | 2024 |
| Forecast Year | 2025-2034 |
| Start Value | $3.6 Billion |
| Forecast Value | $5 Billion |
| CAGR | 3.5% |
In 2024, the by-product production method contributed USD 2.4 billion and is forecasted to reach USD 3.4 billion by 2034, maintaining a 3.5% CAGR. By-product production accounts for 68.4% share due to its cost-effectiveness and environmentally favorable use of waste streams. This method recovers ammonium sulphate during the processing of materials like coke oven gas and caprolactam, as well as during coal flue gas scrubbing. These routes lower production costs while addressing environmental concerns, especially under policies like the Industrial Emissions Directive, which promotes sulphur recovery into usable forms such as ammonium sulphate.
The fertilizer segment dominated the market in 2024, holding a 75.4% share. This segment continues to thrive as ammonium sulphate serves as an effective and low-cost nitrogen fertilizer, especially valuable in improving nutrient uptake in alkaline soils. It supports a wide range of agricultural activities at both subsistence and commercial levels. Crops like maize, rice, and other cereals benefit from its ease of use and compatibility with other fertilizers. Developing nations in Asia Pacific and Latin America are leading in its adoption, thanks to increased government subsidies and a greater shift toward modern agricultural strategies like precision farming, which enhances efficiency and minimizes waste.
China Ammonium Sulphate Market generated USD 671.1 million in 2024 and is projected to grow at a 3.6% CAGR, reaching USD 953.9 million by 2034. This market is expanding rapidly, underpinned by the country's robust agricultural output. Despite having under 10% of the world's arable land, China produces around 25% of global grain, reinforcing its heavy reliance on soil enhancers like ammonium sulphate, particularly for rice cultivation. The country also benefits from growing industrial production, and large-scale collaborations aimed at manufacturing significant volumes of compacted ammonium sulphate are boosting the sector's momentum.
Major players in the global ammonium sulfate industry include BASF SE, UBE Corporation, OCI Nitrogen, Evonik Industries AG, and Lanxess AG. Key strategies adopted by leading companies in the ammonium sulphate market focus on expanding capacity through strategic collaborations, boosting R&D for cost-efficient production technologies, and tapping into value-added industrial applications. Companies are investing in cleaner production routes, especially by-product recovery from caprolactam and coke oven processes, which allow cost savings and align with regulatory pressures for environmental sustainability. Expanding footprint in high-growth regions like Asia Pacific through joint ventures and facility expansions also remains a major priority. Additionally, key firms are strengthening their supply chains and distribution networks to ensure better service delivery and localized support, especially in emerging economies where fertilizer demand is booming.
Table of Contents
Chapter 1 Methodology & Scope
- 1.1 Market scope and definition
- 1.2 Research design
- 1.2.1 Research approach
- 1.2.2 Data collection methods
- 1.3 Data mining sources
- 1.3.1 Global
- 1.3.2 Regional/Country
- 1.4 Base estimates and calculations
- 1.4.1 Base year calculation
- 1.4.2 Key trends for market estimation
- 1.5 Primary research and validation
- 1.5.1 Primary sources
- 1.6 Forecast model
- 1.7 Research assumptions and limitations
Chapter 2 Executive Summary
- 2.1 Industry 360° synopsis
- 2.2 Key market trends
- 2.2.1 Regional
- 2.2.2 Production Method
- 2.2.3 Application
- 2.3 TAM Analysis, 2025-2034
- 2.4 CXO perspectives: Strategic imperatives
- 2.4.1 Executive decision points
- 2.4.2 Critical success factors
- 2.5 Future Outlook and Strategic Recommendations
Chapter 3 Industry Insights
- 3.1 Industry ecosystem analysis
- 3.1.1 Supplier Landscape
- 3.1.2 Profit Margin
- 3.1.3 Value addition at each stage
- 3.1.4 Factor affecting the value chain
- 3.1.5 Disruptions
- 3.2 Industry impact forces
- 3.2.1 Growth drivers
- 3.2.2 Industry pitfalls and challenges
- 3.2.3 Market opportunities
- 3.3 Growth potential analysis
- 3.4 Regulatory landscape
- 3.4.1 North America
- 3.4.2 Europe
- 3.4.3 Asia Pacific
- 3.4.4 Latin America
- 3.4.5 Middle East & Africa
- 3.5 Porter's analysis
- 3.6 PESTEL analysis
- 3.6.1 Technology and Innovation landscape
- 3.6.2 Current technological trends
- 3.6.3 Emerging technologies
- 3.7 Price trends
- 3.7.1 By region
- 3.7.2 By product form
- 3.8 Future market trends
- 3.9 Technology and Innovation landscape
- 3.9.1 Current technological trends
- 3.9.2 Emerging technologies
- 3.10 Patent Landscape
- 3.11 Trade statistics
( Note: the trade statistics will be provided for key countries only
- 3.11.1 Major importing countries
- 3.11.2 Major exporting countries
- 3.12 Sustainability and Environmental Aspects
- 3.12.1 Sustainable Practices
- 3.12.2 Waste Reduction Strategies
- 3.12.3 Energy Efficiency in Production
- 3.12.4 Eco-friendly Initiatives
- 3.13 Carbon Footprint Considerations
Chapter 4 Competitive Landscape, 2024
- 4.1 Introduction
- 4.2 Company market share analysis
- 4.2.1 By region
- 4.2.1.1 North America
- 4.2.1.2 Europe
- 4.2.1.3 Asia Pacific
- 4.2.1.4 LATAM
- 4.2.1.5 MEA
- 4.2.1 By region
- 4.3 Company matrix analysis
- 4.4 Competitive analysis of major market players
- 4.5 Competitive positioning matrix
- 4.6 Key developments
- 4.6.1 Mergers & acquisitions
- 4.6.2 Partnerships & collaborations
- 4.6.3 New Product Launches
- 4.7 Expansion Plans
Chapter 5 Market Estimates and Forecast, By Production Method, 2021 – 2034 (USD Billion) (Tons)
- 5.1 Key trends
- 5.2 Synthetic production
- 5.3 By-product production
- 5.3.1 Caprolactam production
- 5.3.2 Coke oven operations
- 5.3.3 Methyl methacrylate production
- 5.3.4 Other by-product sources
Chapter 6 Market Estimates and Forecast, By Product Form, 2021 – 2034 (USD Billion) (Tons)
- 6.1 Key trends
- 6.2 Solid
- 6.2.1 Granular
- 6.2.2 Crystalline
- 6.3 Liquid
Chapter 7 Market Estimates and Forecast, By Purity Grade, 2021 – 2034 (USD Billion) (Tons)
- 7.1 Key trends
- 7.2 Standard grade (≤99%)
- 7.3 High purity grade (>99%)
Chapter 8 Market Estimates and Forecast, By Application, 2021 – 2034 (USD Billion) (Tons)
- 8.1 Key trends
- 8.2 Fertilizers
- 8.2.1 Straight fertilizers
- 8.2.2 Compound fertilizers
- 8.2.3 Specialty fertilizers
- 8.3 Industrial applications
- 8.3.1 Textile industry
- 8.3.2 Water treatment
- 8.3.3 Food additives
- 8.3.4 Flame retardants
- 8.3.5 Chemical manufacturing
- 8.3.6 Others
- 8.4 Pharmaceutical
- 8.5 Others
Chapter 9 Market Estimates and Forecast, By Region, 2021 – 2034 (USD Billion) (Tons)
- 9.1 Key trends
- 9.2 North America
- 9.2.1 U.S.
- 9.2.2 Canada
- 9.3 Europe
- 9.3.1 Germany
- 9.3.2 UK
- 9.3.3 France
- 9.3.4 Spain
- 9.3.5 Italy
- 9.3.6 Rest of Europe
- 9.4 Asia Pacific
- 9.4.1 China
- 9.4.2 India
- 9.4.3 Japan
- 9.4.4 Australia
- 9.4.5 South Korea
- 9.4.6 Rest of Asia Pacific
- 9.5 Latin America
- 9.5.1 Brazil
- 9.5.2 Mexico
- 9.5.3 Argentina
- 9.5.4 Rest of Latin America
- 9.6 Middle East and Africa
- 9.6.1 Saudi Arabia
- 9.6.2 South Africa
- 9.6.3 UAE
- 9.6.4 Rest of Middle East and Africa
Chapter 10 Company Profiles
- 10.1 BASF SE
- 10.2 AdvanSix Inc.
- 10.3 CF Industries Holdings, Inc.
- 10.4 Domo Chemicals GmbH
- 10.5 Domo Engineering Plastics US
- 10.6 EuroChem Group AG
- 10.7 Evonik Industries AG
- 10.8 Grupa Azoty S.A.
- 10.9 Helm AG
- 10.10 Honeywell International Inc.
- 10.11 JSC Kuibyshevazot
- 10.12 Lanxess AG
- 10.13 Novus International, Inc.
- 10.14 Nutrien Ltd.
- 10.15 OCI N.V.
- 10.16 Ostchem Holding
- 10.17 Sinopec
- 10.18 Sumitomo Chemical Co., Ltd.
- 10.19 Ube Industries, Ltd.
- 10.20 Yara International ASA
 硫酸銨市場:按形態、等級、包裝、銷售管道和應用分類-2026-2032年全球市場預測
 鈰銨硝酸鹽市場報告:按類型、應用和地區分類(2026-2034 年)
 全球硫酸銨市場:按類型、應用和地區分類-預測至2030年
 2026年全球硫酸銨市場報告
 2025-2029年全球硫酸銨市場
 硫酸銨:全球市佔率及排名、總銷售額及需求預測(2025-2031 年)
 硫酸銨市場-全球產業規模、佔有率、趨勢、機會和預測(按產品、應用、地區和競爭細分,2020-2030 年)
 硫酸銨市場報告:2031 年趨勢、預測與競爭分析
 硫酸銨市場:市場分析與預測至 2033 年 - 按類型、按產品、按應用、按形式、按材料類型、按最終用戶、按流程、按技術、按解決方案
 全球硫酸銨市場:市場規模、佔有率、趨勢分析(按最終用途、按應用、按地區)、細分市場預測(2025-2030 年)