


 |
市場調查報告書
商品編碼
1755304
自動駕駛汽車模擬解決方案市場機會、成長動力、產業趨勢分析及 2025 - 2034 年預測Autonomous Vehicle Simulation Solutions Market Opportunity, Growth Drivers, Industry Trend Analysis, and Forecast 2025 - 2034 |
||||||
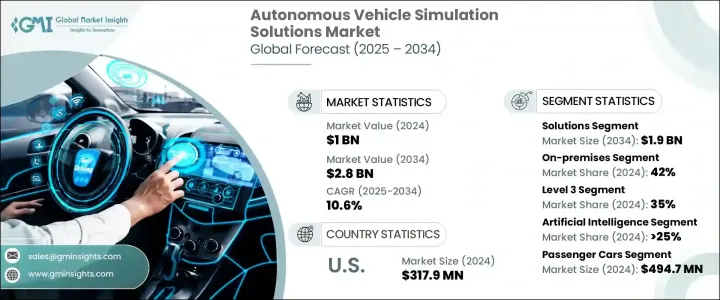
2024年,全球自動駕駛汽車模擬解決方案市場規模達10億美元,預計到2034年將以10.6%的複合年成長率成長,達到28億美元。該市場在支援自動駕駛系統的演進、評估和部署方面發揮關鍵作用。模擬平台如今已成為開發流程中不可或缺的一部分,使汽車製造商和技術供應商能夠在可控且可重複的虛擬環境中測試和驗證複雜的自動駕駛功能。這些平台複製了真實的駕駛場景,使工程師能夠在車輛上路行駛之前就發現並解決關鍵挑戰。隨著自動駕駛系統日益先進和精細化,設計、開發和安全驗證的各個階段都需要模擬工具。
在道路安全依然備受關注的當今世界,模擬技術被視為減少交通事故傷亡人數的實際的解決方案。傳統的測試方法通常耗時、昂貴且風險高,尤其是在重現危險或不常見場景時。模擬技術彌補了這一缺陷,提供了一種經濟高效且可擴展的物理測試替代方案,可以在不危及人員生命的情況下分析數千種極端情況。由於人為失誤是造成交通事故的主要原因,開發比人類駕駛更安全、更可預測的自動化系統日益迫切。基於模擬的工具使得在各種條件下測試這些系統成為可能,包括那些在現實世界中過於危險或罕見而無法複製的條件。
| 市場範圍 | |
|---|---|
| 起始年份 | 2024 |
| 預測年份 | 2025-2034 |
| 起始值 | 10億美元 |
| 預測值 | 28億美元 |
| 複合年成長率 | 10.6% |
隨著人工智慧、機器學習和高效能運算技術的不斷發展,模擬平台也變得更加先進、精準且可擴展。如今的解決方案已遠遠超越了基本的環境建模;它們支援即時駕駛員在環測試和雲端仿真,從而支援自動駕駛汽車開發的整個生命週期。從產生複雜場景到驗證決策演算法,這些工具正在徹底改變產業建構和測試安全自動駕駛系統的方式。
按組件分類,市場可細分為解決方案和服務。 2024年,解決方案部分佔據全球市場的68%,預計到2034年將創造19億美元的收入。該領域對高階軟體的需求正在快速成長,這主要得益於其提供動態虛擬環境的能力。這些軟體平台使工程師能夠模擬從交通場景到各種環境條件下的系統響應等所有方面。開發人員使用這些工具來複製現實世界的挑戰,最佳化系統效能,並確保合規性,而不會產生物理風險或限制。
從部署方式來看,市場分為本地部署、雲端部署和混合部署模式。本地部署解決方案佔據主導地位,2024 年市佔率達 42%。需要高資料保密性、低延遲運算和完全控制模擬參數的公司更傾向於這些部署方式。對於進行即時模擬或測試敏感專有技術的公司來說尤其如此。
就自動駕駛等級而言,市場涵蓋了從 1 級到 5 級以上的等級。 3 級細分市場(即有條件自動駕駛)在 2024 年佔據了 35% 的市場。此等級要求車輛在特定條件下處理大多數駕駛功能,但在需要時仍需依賴人工干預。由於 3 級系統在手動和自動控制之間引入了更複雜的過渡場景,因此模擬在測試這些生命週期過渡以確保系統之間安全切換方面發揮關鍵作用。支援這些系統的服務細分市場預計將在預測期內以約 9.5% 的複合年成長率擴張。
按技術分類,市場涵蓋人工智慧、機器學習、擴增實境/虛擬實境 (AR/VR)、巨量資料分析等。人工智慧領域在 2024 年佔據超過 25% 的市場佔有率,佔據市場主導地位。人工智慧透過支援智慧場景生成和預測建模來增強模擬環境。它使模擬響應更快、更逼真,並能夠模擬車輛、行人和環境之間的複雜互動。人工智慧還能幫助高效擴展模擬規模,使開發人員能夠在更廣泛的條件下訓練和驗證系統。
根據車輛類型,市場分為乘用車、商用車以及二輪車和送貨機器人。乘用車市場在2024年規模最大,產值達4.947億美元。隨著半自動駕駛功能在消費車輛中的日益普及,模擬解決方案對於驗證自適應巡航控制、車道維持和自動停車等駕駛輔助功能至關重要。這些解決方案可協助製造商在實際部署之前確保這些系統的可靠性和安全性。
從地區來看,美國在北美市場佔據領先地位,2024 年的營收達到 3.179 億美元。這一成長得益於其強大的創新生態系統以及支援自動駕駛汽車測試和部署的優惠政策。領先的美國本土公司正在積極投資模擬技術,以加快開發進度並降低與實體測試相關的風險。美國的監管框架也促進了基於模擬的驗證,使其成為全球領域的領導者。
主要市場參與者正在採取合作、併購和研發投資等策略性舉措,以增強其模擬能力。這些努力專注於開發結合人工智慧、機器學習和數位孿生技術的尖端平台,以提高測試覆蓋率、可擴展性和準確性。各公司也與原始設備製造商 (OEM) 和監管機構密切合作,使其解決方案符合不斷發展的行業標準,並加速自動駕駛汽車的商業化進程。
目錄
第1章:方法論與範圍
第2章:執行摘要
第3章:行業洞察
- 產業生態系統分析
- 供應商格局
- 雲端平台提供者
- 場景生成和管理服務提供者
- 硬體在環 (HiL) 和軟體在環 (SiL) 測試提供商
- 數位孿生和虛擬車輛服務提供商
- 驗證和安全合規服務提供者
- 利潤率
- 成本結構
- 每個階段的增值
- 影響價值鏈的因素
- 中斷
- 供應商格局
- 技術與創新格局
- 當前的技術趨勢
- 人工智慧驅動的場景產生和測試
- 即時感測器融合模擬
- 基於雲端的模擬和可擴展性
- 數位孿生與虛擬原型
- 新興技術
- 基於物理和數據驅動的混合模擬模型
- 用於車載即時驗證的邊緣人工智慧
- 使用生成式人工智慧產生合成資料
- 用於資料完整性和模擬可追溯性的區塊鏈
- 先進材料科學
- 當前的技術趨勢
- 定價趨勢
- 用例
- 最佳情況
- 重要新聞和舉措
- 監管格局
- 北美洲
- 歐洲
- 亞太地區
- 拉丁美洲
- 中東和非洲
- 對部隊的影響
- 成長動力
- 人工智慧和機器學習演算法的進步
- ADAS 和自動駕駛系統日益複雜
- 需要高保真感測器建模和環境真實感
- 虛擬測試的可擴展性和成本效益
- 產業陷阱與挑戰
- 複製現實世界的複雜性和邊緣情況的挑戰
- 高保真模擬的計算要求高
- 市場機會
- 成長動力
- 成長潛力分析
- 波特的分析
- PESTEL分析
- 永續性和環境方面
- 永續實踐
- 生產中的能源效率
- 環保舉措
第4章:競爭格局
- 介紹
- 公司市佔率分析
- 北美洲
- 歐洲
- 亞太地區
- 拉丁美洲
- MEA
- 競爭定位矩陣
- 戰略展望矩陣
- 關鍵進展
- 併購
- 夥伴關係與合作
- 新產品發布
- 擴張計劃和資金
第5章:市場估計與預測:按組件,2021 - 2034 年
- 主要趨勢
- 軟體
- 場景生成工具
- 感測器仿真軟體
- 3D建模和視覺化
- 基於物理的模擬器
- 人工智慧和機器學習模擬平台
- 服務
- 諮詢與整合服務
- 支援與維護
- 模擬即服務 (SaaS)
第6章:市場估計與預測:依自主水平,2021 年至 2034 年
- 主要趨勢
- 1級
- 2級
- 3級
- 4級
- 5級以上
第7章:市場估計與預測:依技術分類,2021 - 2034 年
- 主要趨勢
- 人工智慧
- 機器學習
- 擴增實境/虛擬實境(AR/VR)
- 巨量資料分析
- 其他
第8章:市場估計與預測:依車型,2021 - 2034 年
- 主要趨勢
- 搭乘用車
- 薩丹
- 掀背車
- 越野車
- 商用車
- 輕型商用車
- 重型商用車
- 公車和長途客車
- 二輪車和送貨機器人
第9章:市場估計與預測:依部署,2021 - 2034 年
- 主要趨勢
- 本地
- 基於雲端
- 混合
第 10 章:市場估計與預測:按應用,2021 年至 2034 年
- 主要趨勢
- 測試與驗證
- 培訓與教育
- 系統整合
- 資料註釋和標記
- 效能最佳化
第 11 章:市場估計與預測:依最終用途,2021 年至 2034 年
- 主要趨勢
- 汽車原廠設備製造商
- 一級和二級供應商
- 科技公司
- 政府和監管機構
第 12 章:市場估計與預測:按地區,2021 年至 2034 年
- 北美洲
- 美國
- 加拿大
- 歐洲
- 英國
- 德國
- 法國
- 義大利
- 西班牙
- 比利時
- 瑞典
- 亞太地區
- 中國
- 印度
- 日本
- 澳洲
- 新加坡
- 韓國
- 東南亞
- 拉丁美洲
- 巴西
- 墨西哥
- 阿根廷
- MEA
- 南非
- 沙烏地阿拉伯
- 阿拉伯聯合大公國
第13章:公司簡介
- aiMotive
- Altair
- Ansys
- Applied Intuition
- Aptiv
- AVL List
- Cambridge Systematics
- Cognata
- Dassault
- dSPACE
- Foretellix
- Green Hills
- Hexagon
- IPG Automotive
- LG
- LHP Engineering
- MathWorks
- Mechanical Simulation
- rFpro
- Siemens
- Synopsys
The Global Autonomous Vehicle Simulation Solutions Market was valued at USD 1 billion in 2024 and is estimated to grow at a CAGR of 10.6% to reach USD 2.8 billion by 2034. This market plays a pivotal role in supporting the evolution, evaluation, and deployment of autonomous driving systems. Simulation platforms are now an essential part of the development process, allowing automotive manufacturers and technology providers to test and validate complex automated driving functions in controlled and repeatable virtual environments. These platforms replicate real-world driving scenarios, enabling engineers to identify and resolve critical challenges long before vehicles hit the road. As autonomous systems become increasingly advanced and nuanced, simulation tools are needed across all phases of design, development, and safety validation.
In a world where road safety remains a major concern, simulation technologies are seen as a practical solution to reduce the staggering toll of traffic-related injuries and fatalities. Traditional testing methods are often time-consuming, expensive, and risky, especially when recreating dangerous or uncommon scenarios. Simulations bridge this gap by offering a cost-effective and scalable alternative to physical testing, where thousands of edge cases can be analyzed without endangering human life. With human error accounting for the majority of traffic incidents, there is a growing urgency to develop automated systems that can operate more safely and predictably than human drivers. Simulation-based tools make it possible to test these systems under an infinite variety of conditions, including those that are too hazardous or rare to replicate in the real world.
| Market Scope | |
|---|---|
| Start Year | 2024 |
| Forecast Year | 2025-2034 |
| Start Value | $1 Billion |
| Forecast Value | $2.8 Billion |
| CAGR | 10.6% |
As artificial intelligence, machine learning, and high-performance computing technologies continue to progress, simulation platforms have become more advanced, accurate, and scalable. Today's solutions go far beyond basic environmental modeling; they enable real-time, driver-in-the-loop testing and cloud-powered simulations that support the full lifecycle of autonomous vehicle development. From generating complex scenarios to validating decision-making algorithms, these tools are transforming how the industry builds and tests safe autonomous systems.
By component, the market is segmented into solutions and services. In 2024, the solutions segment accounted for 68% of the global market and is expected to generate USD 1.9 billion in revenue by 2034. The demand for advanced software in this segment is growing rapidly, primarily due to its ability to offer dynamic virtual environments. These software platforms allow engineers to simulate everything from traffic scenarios to system responses under various environmental conditions. Developers use these tools to replicate real-world challenges, optimize system performance, and ensure regulatory compliance without physical risks or limitations.
Deployment-wise, the market is divided into on-premises, cloud-based, and hybrid models. On-premises solutions dominated the segment with a 42% market share in 2024. Companies requiring high data confidentiality, low-latency computing, and full control over simulation parameters prefer these setups. This is especially true for firms conducting real-time simulations or testing sensitive, proprietary technologies.
In terms of autonomy level, the market includes level 1 through more than level 5 classifications. The level 3 segment-conditional automation-held 35% of the market in 2024. This level requires the vehicle to handle most driving functions under specific conditions but still relies on human intervention when prompted. As level 3 systems introduce more complex transition scenarios between manual and automated control, simulation plays a critical role in testing these life-cycle transitions to ensure safe handoffs between systems. The services segment supporting these systems is expected to expand at a CAGR of around 9.5% over the forecast period.
By technology, the market covers Artificial Intelligence, Machine Learning, AR/VR, Big Data Analytics, and others. The Artificial Intelligence segment led the market with over 25% share in 2024. AI enhances simulation environments by enabling intelligent scenario generation and predictive modeling. It makes simulations more responsive, realistic, and capable of representing complex interactions among vehicles, pedestrians, and the environment. AI also helps scale simulations efficiently, allowing developers to train and validate systems on a wider range of conditions.
Based on vehicle type, the market is categorized into passenger cars, commercial vehicles, and two-wheelers & delivery bots. The passenger cars segment was the largest in 2024, generating USD 494.7 million. With the rising integration of semi-autonomous features in consumer vehicles, simulation solutions are essential for validating driver-assistance functions like adaptive cruise control, lane keeping, and autonomous parking. These solutions help manufacturers ensure the reliability and safety of these systems before real-world deployment.
Regionally, the U.S. led the North American market with revenue of USD 317.9 million in 2024. This growth is fueled by a robust ecosystem of innovation and favorable policies supporting autonomous vehicle testing and deployment. Leading domestic companies are actively investing in simulation technologies to accelerate their development timelines and reduce risks associated with physical testing. Regulatory frameworks in the U.S. also promote simulation-based validation, positioning the country as a front-runner in the global landscape.
Key market players are pursuing strategic initiatives such as partnerships, mergers, acquisitions, and R&D investments to enhance their simulation capabilities. These efforts are focused on developing cutting-edge platforms that combine AI, machine learning, and digital twin technologies to improve test coverage, scalability, and accuracy. Companies are also working closely with OEMs and regulatory bodies to align their solutions with evolving industry standards and accelerate the commercialization of autonomous vehicles.
Table of Contents
Chapter 1 Methodology & Scope
- 1.1 Research design
- 1.1.1 Research approach
- 1.1.2 Data collection methods
- 1.2 Base estimates & calculations
- 1.2.1 Base year calculation
- 1.2.2 Key trends for market estimation
- 1.3 Forecast model.
- 1.4 Primary research and validation
- 1.4.1 Primary sources
- 1.4.2 Data mining sources
- 1.5 Market scope & definition
Chapter 2 Executive Summary
- 2.1 Industry synopsis, 2021 – 2034
- 2.2 Key market trends
- 2.2.1 Regional
- 2.2.2 Component
- 2.2.3 Autonomy level
- 2.2.4 Technology
- 2.2.5 Vehicle
- 2.2.6 Deployment
- 2.2.7 Application
- 2.2.8 End use
- 2.3 TAM Analysis, 2025-2034
- 2.4 CXO perspectives: Strategic imperatives
- 2.4.1 Key decision points for industry executives
- 2.4.2 Critical success factors for market players
- 2.5 Future Outlook and Strategic Recommendations
Chapter 3 Industry Insights
- 3.1 Industry ecosystem analysis
- 3.1.1 Supplier landscape
- 3.1.1.1 Cloud platform providers
- 3.1.1.2 Scenario generation & management service providers
- 3.1.1.3 Hardware-in-the-loop (HiL) & software-in-the-loop (SiL) testing providers
- 3.1.1.4 Digital twin & virtual vehicle service providers
- 3.1.1.5 Validation & safety compliance service providers
- 3.1.2 Profit Margin
- 3.1.3 Cost structure
- 3.1.4 Value addition at each stage
- 3.1.5 Factor affecting the value chain
- 3.1.6 Disruptions
- 3.1.1 Supplier landscape
- 3.2 Technology & innovation landscape
- 3.2.1 Current technological trends
- 3.2.1.1 AI-driven scenario generation and testing
- 3.2.1.2 Real-time sensor fusion simulation
- 3.2.1.3 Cloud-based simulation and scalability
- 3.2.1.4 Digital twin and virtual prototyping
- 3.2.2 Emerging Technologies
- 3.2.2.1 Physics-based and data-driven hybrid simulation models
- 3.2.2.2 Edge AI for in-vehicle real-time validation
- 3.2.2.3 Synthetic data generation using generative AI
- 3.2.2.4 Blockchain for data integrity and simulation traceability
- 3.2.3 Advanced material sciences
- 3.2.1 Current technological trends
- 3.3 Pricing trend
- 3.4 Use cases
- 3.5 Best-case scenario
- 3.6 Key news & initiatives
- 3.7 Regulatory landscape
- 3.7.1 North America
- 3.7.2 Europe
- 3.7.3 Asia Pacific
- 3.7.4 Latin America
- 3.7.5 Middle East & Africa
- 3.8 Impact on forces
- 3.8.1 Growth drivers
- 3.8.1.1 Advancements in AI and machine learning algorithms
- 3.8.1.2 Growing complexity of ADAS and autonomous systems
- 3.8.1.3 Need for high-fidelity sensor modeling and environmental realism
- 3.8.1.4 Scalability and cost-effectiveness of virtual testing
- 3.8.2 Industry pitfalls & challenges
- 3.8.2.1 Challenges in replicating real-world complexity and edge cases
- 3.8.2.2 High computational requirements for high-fidelity simulations
- 3.8.3 Market opportunity
- 3.8.1 Growth drivers
- 3.9 Growth potential analysis
- 3.10 Porter's analysis
- 3.11 PESTEL analysis
- 3.12 Sustainability and environmental aspects
- 3.12.1 Sustainable practices
- 3.12.2 Energy efficiency in production
- 3.12.3 Eco-friendly initiatives
Chapter 4 Competitive Landscape, 2024
- 4.1 Introduction
- 4.2 Company market share analysis
- 4.2.1 North America
- 4.2.2 Europe
- 4.2.3 Asia Pacific
- 4.2.4 LATAM
- 4.2.5 MEA
- 4.3 Competitive positioning matrix
- 4.4 Strategic outlook matrix
- 4.5 Key developments
- 4.5.1 Mergers & acquisitions
- 4.5.2 Partnerships & collaborations
- 4.5.3 New product launches
- 4.5.4 Expansion plans and funding
Chapter 5 Market Estimates & Forecast, By Component, 2021 - 2034 ($Bn)
- 5.1 Key trends
- 5.2 Software
- 5.2.1 Scenario generation tools
- 5.2.2 Sensor simulation software
- 5.2.3 3D modeling and visualization
- 5.2.4 Physics-based simulators
- 5.2.5 AI & ML simulation platforms
- 5.3 Services
- 5.3.1 Consulting & integration services
- 5.3.2 Support & maintenance
- 5.3.3 Simulation-as-a-Service (SaaS)
Chapter 6 Market Estimates & Forecast, By Autonomy level, 2021 - 2034 ($Bn)
- 6.1 Key trends
- 6.2 Level 1
- 6.3 Level 2
- 6.4 Level 3
- 6.5 Level 4
- 6.6 Level 5 and above
Chapter 7 Market Estimates & Forecast, By Technology, 2021 - 2034 ($Bn)
- 7.1 Key trends
- 7.2 Artificial intelligence
- 7.3 Machine learning
- 7.4 Augmented reality / virtual reality (AR/VR)
- 7.5 Big data analytics
- 7.6 Others
Chapter 8 Market Estimates & Forecast, By Vehicle, 2021 - 2034 ($Bn)
- 8.1 Key trends
- 8.2 Passenger cars
- 8.2.1 Sadan
- 8.2.2 Hatchback
- 8.2.3 SUV
- 8.3 Commercial vehicles
- 8.3.1 Light commercial vehicle
- 8.3.2 Heavy commercial vehicle
- 8.3.3 Buses & coaches
- 8.4 Two-wheelers & delivery bots
Chapter 9 Market Estimates & Forecast, By Deployment, 2021 - 2034 ($Bn)
- 9.1 Key trends
- 9.2 On-premises
- 9.3 Cloud-based
- 9.4 Hybrid
Chapter 10 Market Estimates & Forecast, By Application, 2021 - 2034 ($Bn)
- 10.1 Key trends
- 10.2 Testing & validation
- 10.3 Training & education
- 10.4 System integration
- 10.5 Data annotation & labeling
- 10.6 Performance optimization
Chapter 11 Market Estimates & Forecast, By End Use, 2021 - 2034 ($Bn)
- 11.1 Key trends
- 11.2 Automotive OEMs
- 11.3 Tier 1 & tier 2 suppliers
- 11.4 Tech companies
- 11.5 Government & regulatory bodies
Chapter 12 Market Estimates & Forecast, By Region, 2021 - 2034 ($Bn)
- 12.1 North America
- 12.1.1 U.S.
- 12.1.2 Canada
- 12.2 Europe
- 12.2.1 UK
- 12.2.2 Germany
- 12.2.3 France
- 12.2.4 Italy
- 12.2.5 Spain
- 12.2.6 Belgium
- 12.2.7 Sweden
- 12.3 Asia Pacific
- 12.3.1 China
- 12.3.2 India
- 12.3.3 Japan
- 12.3.4 Australia
- 12.3.5 Singapore
- 12.3.6 South Korea
- 12.3.7 Southeast Asia
- 12.4 Latin America
- 12.4.1 Brazil
- 12.4.2 Mexico
- 12.4.3 Argentina
- 12.5 MEA
- 12.5.1 South Africa
- 12.5.2 Saudi Arabia
- 12.5.3 UAE
Chapter 13 Company Profiles
- 13.1 aiMotive
- 13.2 Altair
- 13.3 Ansys
- 13.4 Applied Intuition
- 13.5 Aptiv
- 13.6 AVL List
- 13.7 Cambridge Systematics
- 13.8 Cognata
- 13.9 Dassault
- 13.10 dSPACE
- 13.11 Foretellix
- 13.12 Green Hills
- 13.13 Hexagon
- 13.14 IPG Automotive
- 13.15 LG
- 13.16 LHP Engineering
- 13.17 MathWorks
- 13.18 Mechanical Simulation
- 13.19 rFpro
- 13.20 Siemens
- 13.21 Synopsys
 汽車模擬市場:2026-2032年全球市場預測(以交付方式、類型、模擬類型、應用程式和部署方式分類)
 2026年全球基於場景的自動駕駛汽車(AV)測試平台市場報告2026年全球自動駕駛汽車模擬解決方案市場報告2026年全球汽車模擬軟體市場報告2026年全球汽車模擬市場報告
 汽車模擬軟體市場規模、佔有率和趨勢分析報告:按解決方案、部署方式、應用、最終用途、地區和細分市場預測(2026-2033 年)
 汽車模擬市場 - 全球產業規模、佔有率、趨勢、機會及預測(按應用、組件、地區和競爭格局分類,2021-2031年)
 汽車模擬市場規模、佔有率和成長分析(按組件、模擬、應用、最終用途、車輛類型和地區分類)-2026-2033年產業預測
 全球自動駕駛汽車模擬與測試平台市場:預測至2032年-按組件、測試類型、部署方式、應用、最終用戶和地區分類的分析
 全球汽車模擬市場