


 |
市場調查報告書
商品編碼
1755211
清潔標籤食品添加劑市場機會、成長動力、產業趨勢分析及 2025 - 2034 年預測Clean Labelled Food Additives Market Opportunity, Growth Drivers, Industry Trend Analysis, and Forecast 2025 - 2034 |
||||||
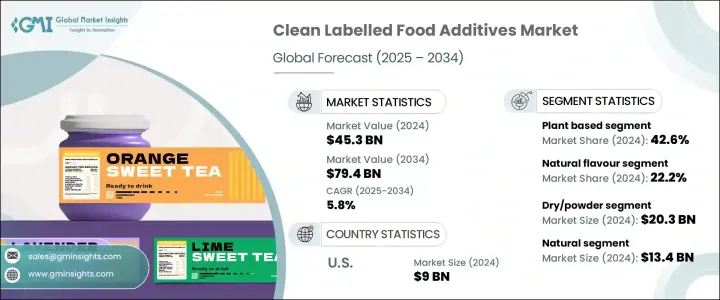
2024年,全球清潔標籤食品添加劑市場規模達453億美元,預計2034年將以5.8%的複合年成長率成長,達到794億美元。消費者對食品透明度、天然來源和最低加工要求的日益重視,對塑造這一市場格局發揮重要作用。隨著對易於識別、易於理解的成分的需求日益成長,食品製造商正在選擇不影響性能或保存期限的清潔標籤解決方案。這些源自植物、微生物、礦物質和動物的添加劑正被廣泛用於替代合成添加劑,同時保持加工食品的風味、外觀和品質。
它們的功能涵蓋保鮮、提升風味、改善質地、促進乳化以及賦予天然色素和甜味。消費者對人工添加劑的質疑日益加深,以及對符合健康和道德標準的食品的偏好,推動了這種向簡化和天然來源的原料採購的轉變。因此,清潔標籤配方已成為各大品類食品品牌的重要策略,使其能夠維繫消費者信任,並滿足市場對低加工、更健康食品的需求。
| 市場範圍 | |
|---|---|
| 起始年份 | 2024 |
| 預測年份 | 2025-2034 |
| 起始值 | 453億美元 |
| 預測值 | 794億美元 |
| 複合年成長率 | 5.8% |
在關鍵成分中,天然香料在2024年佔據了22.2%的市場佔有率,預計到2034年將以5.8%的複合年成長率成長。這些成分吸引了追求真實感的消費者,因為它們源自於水果、香草、香料和其他植物來源。它們用途廣泛,無需依賴人工成分即可提升乳製品、烘焙食品、飲料和零食的口感,這使得它們在清潔標籤產品開發中的地位日益突出。
從成分來源來看,植物性添加劑在2024年佔據42.6%的市場佔有率,佔據市場主導地位,預計到2034年將以6%的複合年成長率成長。人們對永續性、動物福利和植物性飲食日益成長的興趣,推動了對源自水果、蔬菜、穀物和豆類的清潔標籤成分的需求。這些成分透過提供合成化合物的天然替代品來滿足清潔標籤的期望,使品牌能夠配製出體現道德和環保意識的產品。
以形態分類,乾粉類產品在2024年的收入超過203億美元。它們保存期限更長、易於儲存,並且與自動化生產流程相容,使其成為烘焙食品、零食和飲料沖調的理想選擇。其廣泛應用源自於其為製造商和消費者提供的便利性和穩定性。同時,液體添加劑也越來越受到青睞,尤其是在醬料和乳製品等應用中,這些應用專注於易於混合和風味一致性。
從認證角度來看,天然產品市場在2024年達到134億美元,憑藉其與健康、透明度和極簡加工的緊密聯繫,佔據了市場主導地位。消費者傾向於信任「天然」標籤,認為它代表安全和成分的完整性。此外,由於對合成化學品和基因改造的擔憂,對有機和非基因改造標籤的需求也在不斷成長。儘管清潔標籤認證產品仍處於新興階段,但它們被視為提供最高水準的保證,並有望在受監管或高階市場佔有一席之地。
在終端用途類別中,烘焙和糖果產品佔據了最大的市場佔有率,2024 年貢獻了 24.3%,預計到 2034 年將以 6.2% 的複合年成長率成長。人們對麵包、蛋糕和餅乾等烘焙食品中清潔植物性成分的偏好持續推動著這一領域的創新。食品生產商正在用清潔標籤產品取代人工甜味劑、色素和防腐劑,以滿足消費者對更健康選擇的需求。
由於天然和功能性飲料日益流行,飲料業也呈現穩定成長。隨著消費者對日常用品透明度的要求越來越高,清潔標籤添加劑正被用於乳製品和冷凍食品,尤其是優格和冷凍甜點。醬料、調味品、零食和即食食品也正在轉向清潔配方,以吸引注重健康的消費者。肉類、禽類和海鮮類別正在逐步減少合成防腐劑和著色劑的使用,以符合清潔標籤標準,同時確保食品安全。
就功能性而言,風味和色素增強在2024年以136億美元的市場規模領先該領域。人們對更鮮豔、更具吸引力、風味更天然的食品的需求持續成長,尤其是在外觀對購買決策影響重大的領域。植物萃取物、草本植物和水果通常取代人工色素和香精,幫助品牌滿足人們對更健康、更具視覺吸引力的食品的需求。
以消費者特徵細分的市場顯示,傳統產品在2024年佔總市場的30.9%,預計到2034年將以5.7%的複合年成長率成長。隨著各大品牌努力改進麵包、醬料和零食等主食的配方,以滿足日常清潔飲食的期望,這些產品已成為清潔標籤整合的焦點。雖然高階、健康和兒童產品仍在強調清潔標籤的特性,但此類成分在主流商品中的應用表明,清潔標籤已不再是小眾概念,而是新的標準。
從區域來看,美國引領北美清潔標籤食品添加劑市場,2024年市場規模達90億美元,預計2034年複合年成長率將達到5.6%。這一領先地位源於消費者意識的提升、監管支持以及廣泛的清潔標籤產品供應。美國消費者尤其注重成分,也越來越要求產品不含人工添加劑。製造商正積極響應這一趨勢,將清潔標籤原則融入幾乎所有食品類別。
全球清潔標籤食品添加劑領域的領導者包括嘉吉、宜瑞安、ADM、凱裡集團和泰特萊爾。這些公司擁有強大的全球影響力、多樣化的產品組合和強大的分銷體系,使其成為全球日益成長的清潔標籤解決方案需求的關鍵供應商。
目錄
第1章:方法論與範圍
第2章:執行摘要
第3章:行業洞察
- 產業生態系統分析
- 供應商概況
- 利潤率
- 每個階段的增值
- 影響價值鏈的因素
- 中斷
- 產業衝擊力
- 成長動力
- 產業陷阱與挑戰
- 市場機會
- 成長潛力分析
- 監管格局
- 北美洲
- 歐洲
- 亞太地區
- 拉丁美洲
- 中東和非洲
- 波特的分析
- PESTEL分析
- 價格趨勢
- 按地區
- 按產品
- 未來市場趨勢
- 科技與創新格局
- 當前的技術趨勢
- 新興技術
- 專利態勢
- 貿易統計(HS編碼)
- 主要進口國
- 主要出口國
- 永續性和環境方面
- 永續實踐
- 減少廢棄物的策略
- 生產中的能源效率
- 環保舉措
- 製造流程概述
- 原料採購與準備
- 提取和加工方法
- 純化和標準化
- 品質控制和測試
- 包裝和儲存
- 生產成本分析
- 原料成本
- 加工成本
- 勞動成本
- 包裝成本
- 製造費用
- 成本最佳化策略
- 製造設施分析
- 主要製造地點
- 生產能力評估
- 設施擴建計劃
- 供應鏈挑戰與解決方案
- 原物料採購挑戰
- 品質一致性問題
- 物流和運輸
- 庫存管理
- 製造流程的永續性
- 能源效率措施
- 節水措施
- 廢棄物減少和管理
- 減少碳足跡策略
- 全球監理框架
- 區域監理框架
- 北美洲
- FDA 法規和指南
- 美國農業部有機標準
- 國家級法規
- 歐洲
- Efsa 指南
- 歐盟食品添加物法規
- 歐盟有機法規
- 亞太
- 中國食品添加物管理條例
- 日本食品添加物標準
- 其他地區法規
- 北美洲
- 區域監理框架
- 世界其他地區
- 清潔標籤定義和標準
- 產業定義的標準
- 零售商定義的標準
- 消費者對清潔標章的看法
- 認證和標籤要求
- 有機認證
- 非基因改造驗證
- 天然聲明認證
- 過敏原標籤
- 合規挑戰與策略
- 未來監管趨勢和影響
- 環境、社會與治理分析
- 環境影響評估
- 碳足跡分析
- 用水和管理
- 土地利用和生物多樣性影響
- 廢棄物產生和管理
- 環境影響評估
- 社會責任實踐
- 勞動實務和工作條件
- 社區參與與支持
- 健康和營養影響
- 道德採購實踐
- 治理和道德考慮
- 公司治理結構
- 透明度和報告
- 道德商業行為
- 利害關係人參與
- 關鍵參與者的 ESG 績效基準
- ESG風險評估及緩解策略
- 清潔標籤食品添加劑產業的未來 ESG 趨勢
- 消費者行為與市場趨勢分析
- 消費者偏好與購買模式
- 清潔標籤意識和理解
- 支付保費意願
- 成分迴避行為
- 標籤閱讀習慣
- 清潔標籤消費者的人口統計分析
- 年齡層分析
- 收入水平分析
- 地理分佈
- 生活風格和心理細分
- 消費者對清潔標示食品添加劑的看法
- 感知到的健康益處
- 感知的環境效益
- 感知品質和價值
- 信任和可信度因素
- 新興消費趨勢
- 植物性和純素食偏好
- 無過敏原和無過敏原趨勢
- 功能性食品和強化食品偏好
- 永續性和道德消費
- 數位轉型對消費者參與度的影響
- 消費者回饋分析及啟示
- 消費者偏好與購買模式
- 技術格局與創新分析
- 當前的技術趨勢
- 新興技術
- 先進的萃取技術
- 發酵和生物技術
- 奈米科技應用
- 高壓非熱技術
- 產品創新趨勢
- 多功能成分
- 傳統添加劑的替代品
- 新型植物成分
- 升級再造的原料
- 配方與應用創新
- 延長保存期限的解決方案
- 風味增強技術
- 紋理化解決方案
- 色彩穩定性創新
- 包裝和配送系統創新
- 永續包裝
- 智慧包裝
- 份量控制包裝
- 延長保存期限的包裝
- 研發活動與創新中心
- 各地區技術採用趨勢
- 未來技術路線圖(2025-2034)
- 定價分析與經濟因素
- 定價趨勢
- 歷史價格趨勢
- 目前定價情景
- 價格預測
- 影響定價的因素
- 原料成本
- 加工成本
- 合規成本
- 市場競爭
- 消費者支付意願
- 定價策略
- 高階市場 vs. 大眾市場
- 增值定價
- 捆綁定價
- 區域價格差異
- 價格價值關係分析
- 經濟指標
- GDP成長與消費者支出
- 通貨膨脹和貨幣波動
- 農產品價格
- 能源成本
- 定價趨勢
- 供應商格局
- 利潤率分析
- 重要新聞和舉措
- 監管格局
- 衝擊力
- 成長動力
- 消費者對清潔標籤產品的偏好日益成長
- 不斷擴張的食品飲料產業
- 擴大需要清潔標籤成分的植物性和有機食品產品
- 產業陷阱與挑戰
- 清潔標籤食品添加劑成本高
- 不使用人工防腐劑,維持口味、質地和保存期限的挑戰
- 成長動力
- 成長潛力分析
- 波特的分析
- PESTEL分析
第4章:競爭格局
- 介紹
- 公司市佔率分析
- 按地區
- 北美洲
- 歐洲
- 亞太地區
- 拉丁美洲
- MEA
- 公司矩陣分析
- 主要市場參與者的競爭分析
- 競爭定位矩陣
- 關鍵進展
- 併購
- 夥伴關係與合作
- 新產品發布
- 擴張計劃
第5章:市場規模及預測:依成分類型 2021 - 2034
- 主要趨勢
- 自然色彩
- 天然香料
- 天然防腐劑
- 天然甜味劑
- 水膠體和組織劑
- 功能性天然澱粉
- 天然乳化劑
- 其他
第6章:市場規模及預測:依來源,2021 - 2034
- 主要趨勢
- 植物性
- 動物性
- 微生物/發酵
- 礦物基
第7章:市場規模及預測:依形式,2021 - 2034
- 主要趨勢
- 乾粉
- 液體
- 其他
第 8 章:市場規模與預測:按認證,2021 年至 2034 年
- 主要趨勢
- 有機的
- 非基因改造
- 自然的
- 清潔標籤認證
- 其他
第9章:市場規模及預測:依最終用途,2021 - 2034
- 主要趨勢
- 烘焙和糖果
- 飲料
- 乳製品和冷凍食品
- 加工食品
- 醬料和調味品
- 小吃和便利商店
- 肉類、家禽和海鮮
- 其他
第 10 章:市場規模與預測:按功能分類,2021 年至 2034 年
- 主要趨勢
- 儲存
- 紋理修改
- 增強風味/色彩
- 乳化
- 甜味劑
- 其他
第 11 章:市場規模及預測:依消費者分類,2021 年至 2034 年
- 主要趨勢
- 常規產品
- 優質產品
- 健康與保健產品
- 兒童產品
- 其他
第 12 章:市場估計與預測:按地區,2021 年至 2034 年
- 主要趨勢
- 北美洲
- 美國
- 加拿大
- 歐洲
- 德國
- 英國
- 法國
- 西班牙
- 義大利
- 亞太地區
- 中國
- 印度
- 日本
- 澳洲
- 韓國
- 拉丁美洲
- 巴西
- 墨西哥
- 阿根廷
- 中東和非洲
- 沙烏地阿拉伯
- 南非
- 阿拉伯聯合大公國
第13章:公司簡介
- ADM
- Cargill
- Corbion Inc.
- DSM
- Frutarom
- Ingredion
- International Flavors & Fragrances Inc.
- Kemin Industries, Inc.
- Kerry Group
- Sensient Technologies
- Tate & Lyle
The Global Clean Labelled Food Additives Market was valued at USD 45.3 billion in 2024 and is estimated to grow at a CAGR of 5.8% to reach USD 79.4 billion by 2034. The growing awareness among consumers about food transparency, natural origins, and minimal processing is playing a significant role in shaping this market. With the increasing demand for recognizable, easy-to-understand ingredients, food manufacturers are opting for clean label solutions that don't compromise on performance or shelf life. These additives, derived from plants, microbes, minerals, and animals, are being widely used to replace synthetic counterparts while maintaining the taste, appearance, and quality of processed foods.
Their functions extend to preserving freshness, enhancing flavors, improving texture, supporting emulsification, and delivering natural colors and sweetness. This shift toward simplicity and natural origins in ingredient sourcing is supported by rising consumer skepticism toward artificial additives and a preference for food that aligns with healthy and ethical choices. As a result, clean label formulations have become a vital strategy for food brands across major categories, allowing them to retain consumer trust and respond to market demand for minimally processed, better-for-you foods.
| Market Scope | |
|---|---|
| Start Year | 2024 |
| Forecast Year | 2025-2034 |
| Start Value | $45.3 Billion |
| Forecast Value | $79.4 Billion |
| CAGR | 5.8% |
Among the key ingredients, natural flavors commanded a 22.2% share of the market in 2024 and are projected to expand at a CAGR of 5.8% through 2034. These ingredients appeal to consumers seeking authenticity, as they are derived from fruits, herbs, spices, and other plant-based sources. Their versatility in enhancing the taste of dairy products, baked goods, beverages, and snacks without relying on artificial components supports their growing prominence in clean label product development.
When viewed by ingredient source, plant-based additives led the market with a 42.6% share in 2024 and are expected to grow at a CAGR of 6% through 2034. Rising interest in sustainability, animal welfare, and plant-forward diets has fueled the demand for clean label ingredients derived from fruits, vegetables, grains, and legumes. These ingredients meet clean label expectations by offering natural alternatives to synthetic compounds, thus enabling brands to formulate products that reflect ethical and environmental consciousness.
Based on form, the dry or powder segment generated revenues exceeding USD 20.3 billion in 2024. Their longer shelf life, ease of storage, and compatibility with automated manufacturing processes make them an ideal choice for baked goods, snacks, and drink mixes. Their widespread use stems from the convenience and stability they offer to manufacturers and consumers alike. Meanwhile, liquid additives are gaining traction, particularly in applications such as sauces and dairy products, where ease of blending and consistency in flavor delivery are valued.
From a certification standpoint, the natural segment reached USD 13.4 billion in 2024, dominating the market due to its strong association with health, transparency, and minimal processing. Consumers tend to trust the "natural" label, believing it represents safety and ingredient integrity. This is followed by a growing demand for organic and non-GMO labels, driven by concerns over synthetic chemicals and genetic modification. Although still emerging, clean label certified products are seen as offering the highest level of assurance and are likely to gain ground in regulated or high-end markets.
Among end-use categories, bakery and confectionery products accounted for the largest market share, contributing 24.3% in 2024 and expected to grow at a CAGR of 6.2% through 2034. The preference for clean, plant-based ingredients in baked treats like bread, cakes, and cookies continues to drive innovation in this segment. Food producers are substituting artificial sweeteners, colors, and preservatives with clean label options to satisfy customer demand for healthier choices.
The beverage segment is also witnessing steady growth due to the increasing popularity of natural and functional drinks. Clean label additives are being used in dairy and frozen foods, particularly in yogurts and frozen desserts, as consumers demand transparency in everyday items. Sauces, condiments, snacks, and ready meals are also shifting toward clean formulations to appeal to health-focused shoppers. The meat, poultry, and seafood categories are gradually reducing synthetic preservatives and coloring agents to align with clean label standards while maintaining food safety.
In terms of functionality, flavor and color enhancement led the segment with USD 13.6 billion in 2024. The drive for more vibrant, appealing, and naturally flavored foods continues to rise, especially in segments where appearance heavily influences purchase decisions. Plant-based extracts, herbs, and fruits commonly replace artificial colors and flavors, helping brands align with the demand for healthier, visually attractive foods.
The market segmented by consumer profile shows that conventional products accounted for 30.9% of the total market in 2024 and are forecast to expand at a CAGR of 5.7% through 2034. These products have become a focal point for clean label integration as brands work to reformulate staple items like bread, sauces, and snacks to meet everyday clean eating expectations. While premium, wellness, and children's products continue to highlight clean label features, the inclusion of such ingredients in mainstream goods shows that clean label is no longer a niche concept-it's the new standard.
In regional terms, the U.S. led the North American clean labelled food additives market, reaching USD 9 billion in 2024, and is expected to grow at a CAGR of 5.6% through 2034. This leadership stems from heightened consumer awareness, regulatory support, and extensive clean label product offerings. American consumers are especially mindful of ingredients and increasingly demand products free from artificial additives. Manufacturers are responding by incorporating clean label principles across nearly every food category.
Leading players in the global clean labelled food additives space include Cargill, Ingredion, ADM, Kerry Group, and Tate & Lyle. These companies have strong global footprints, diverse product portfolios, and robust distribution systems, positioning them as key suppliers for the increasing demand for clean label solutions worldwide.
Table of Contents
Chapter 1 Methodology & Scope
- 1.1 Market scope & definition
- 1.2 Base estimates & calculations
- 1.3 Forecast calculation
- 1.4 Data sources
- 1.4.1 Primary
- 1.4.2 Secondary
- 1.4.2.1 Paid sources
- 1.4.2.2 Public sources
- 1.5 Primary research and validation
- 1.5.1 Primary sources
- 1.5.2 Data mining sources
Chapter 2 Executive Summary
- 2.1 Industry 360° synopsis
- 2.2 Key market trends
- 2.2.1 Regional
- 2.2.2 Ingredient type
- 2.2.3 Form
- 2.2.4 Origin
- 2.2.5 Beverage type
- 2.2.6 Flavor type
- 2.3 TAM Analysis, 2025-2034
- 2.4 CXO perspectives: Strategic imperatives
- 2.4.1 Executive decision points
- 2.4.2 Critical success factors
- 2.5 Future Outlook and Strategic Recommendations
Chapter 3 Industry Insights
- 3.1 Industry ecosystem analysis
- 3.1.1 Supplier Landscape
- 3.1.2 Profit Margin
- 3.1.3 Value addition at each stage
- 3.1.4 Factor affecting the value chain
- 3.1.5 Disruptions
- 3.2 Industry impact forces
- 3.2.1 Growth drivers
- 3.2.2 Industry pitfalls and challenges
- 3.2.3 Market opportunities
- 3.3 Growth potential analysis
- 3.4 Regulatory landscape
- 3.4.1 North America
- 3.4.2 Europe
- 3.4.3 Asia Pacific
- 3.4.4 Latin America
- 3.4.5 Middle East & Africa
- 3.5 Porter's analysis
- 3.6 PESTEL analysis
- 3.6.1 Technology and Innovation landscape
- 3.6.2 Current technological trends
- 3.6.3 Emerging technologies
- 3.7 Price trends
- 3.7.1 By region
- 3.7.2 By product
- 3.8 Future market trends
- 3.9 Technology and Innovation landscape
- 3.9.1 Current technological trends
- 3.9.2 Emerging technologies
- 3.10 Patent Landscape
- 3.11 Trade statistics (HS code)
- 3.11.1 Major importing countries
- 3.11.2 Major exporting countries
- 3.12 Sustainability and environmental aspects
- 3.12.1 Sustainable practices
- 3.12.2 Waste reduction strategies
- 3.12.3 Energy efficiency in production
- 3.12.4 Eco-friendly initiatives
- 3.13 Manufacturing process overview
- 3.13.1 Raw material procurement and preparation
- 3.13.2 Extraction and processing methods
- 3.13.3 Purification and standardization
- 3.13.4 Quality control and testing
- 3.13.5 Packaging and storage
- 3.14 Production cost analysis
- 3.14.1 Raw material costs
- 3.14.2 Processing costs
- 3.14.3 Labor costs
- 3.14.4 Packaging costs
- 3.14.5 Manufacturing overheads
- 3.14.6 Cost optimization strategies
- 3.15 Manufacturing facilities analysis
- 3.15.1 Key manufacturing locations
- 3.15.2 Production capacity assessment
- 3.15.3 Facility expansion plans
- 3.16 Supply chain challenges and solutions
- 3.16.1 Raw material sourcing challenges
- 3.16.2 Quality consistency issues
- 3.16.3 Logistics and transportation
- 3.16.4 Inventory management
- 3.17 Sustainability in manufacturing processes
- 3.17.1 Energy efficiency measures
- 3.17.2 Water conservation practices
- 3.17.3 Waste reduction and management
- 3.17.4 Carbon footprint reduction strategies
- 3.18 Global regulatory framework
- 3.18.1 Regional regulatory frameworks
- 3.18.1.1 North america
- 3.18.1.1.1 Fda regulations and guidelines
- 3.18.1.1.2 Usda organic standards
- 3.18.1.1.3 State-level regulations
- 3.18.1.2 Europe
- 3.18.1.2.1 Efsa guidelines
- 3.18.1.2.2 Eu food additives regulation
- 3.18.1.2.3 Eu organic regulations
- 3.18.1.3 Asia-pacific
- 3.18.1.3.1 China food additive regulations
- 3.18.1.3.2 Japan food additive standards
- 3.18.1.3.3 Other regional regulations
- 3.18.1.1 North america
- 3.18.1 Regional regulatory frameworks
- 3.19 Rest of the world
- 3.20 Clean label definitions and standards
- 3.20.1 Industry-defined standards
- 3.20.2 Retailer-defined standards
- 3.20.3 Consumer perception of clean label
- 3.21 Certification and labeling requirements
- 3.21.1 Organic certification
- 3.21.2 Non-gmo verification
- 3.21.3 Natural claims certification
- 3.21.4 Allergen labeling
- 3.22 Compliance challenges and strategies
- 3.23 Future regulatory trends and implications
- 3.24 Environmental, social, and governance analysis
- 3.24.1 Environmental impact assessment
- 3.24.1.1 Carbon footprint analysis
- 3.24.1.2 Water usage and management
- 3.24.1.3 Land use and biodiversity impact
- 3.24.1.4 Waste generation and management
- 3.24.1 Environmental impact assessment
- 3.25 Social responsibility practices
- 3.25.1.1 Labor practices and working conditions
- 3.25.1.2 Community engagement and support
- 3.25.1.3 Health and nutrition impact
- 3.25.1.4 Ethical sourcing practices
- 3.26 Governance and ethical considerations
- 3.26.1.1 Corporate governance structures
- 3.26.1.2 Transparency and reporting
- 3.26.1.3 Ethical business practices
- 3.26.1.4 Stakeholder engagement
- 3.27 Esg performance benchmarking of key players
- 3.28 Esg risk assessment and mitigation strategies
- 3.29 Future esg trends in the clean labelled food additives industry
- 3.30 Consumer behavior and market trends analysis
- 3.30.1 Consumer preferences and purchasing patterns
- 3.30.1.1 Clean label awareness and understanding
- 3.30.1.2 Willingness to pay premium
- 3.30.1.3 Ingredient avoidance behaviors
- 3.30.1.4 Label reading habits
- 3.30.2 Demographic analysis of clean label consumers
- 3.30.2.1 Age group analysis
- 3.30.2.2 Income level analysis
- 3.30.2.3 Geographic distribution
- 3.30.2.4 Lifestyle and psychographic segmentation
- 3.30.3 Consumer perception of clean labelled food additives
- 3.30.3.1 Perceived health benefits
- 3.30.3.2 Perceived environmental benefits
- 3.30.3.3 Perceived quality and value
- 3.30.3.4 Trust and credibility factors
- 3.30.4 Emerging consumer trends
- 3.30.4.1 Plant-based and vegan preferences
- 3.30.4.2 Allergen-free and free-from trends
- 3.30.4.3 Functional and fortified food preferences
- 3.30.4.4 Sustainability and ethical consumption
- 3.30.5 Impact of digital transformation on consumer engagement
- 3.30.6 Consumer feedback analysis and implications
- 3.30.1 Consumer preferences and purchasing patterns
- 3.31 Technological landscape and innovation analysis
- 3.31.1 Current technological trends
- 3.31.2 Emerging technologies
- 3.31.2.1 Advanced extraction technologies
- 3.31.2.2 Fermentation and biotechnology
- 3.31.2.3 Nanotechnology applications
- 3.31.2.4 High-pressure and non-thermal tech
- 3.31.3 Product innovation trends
- 3.31.3.1 Multi-functional ingredients
- 3.31.3.2 Alternatives to traditional additives
- 3.31.3.3 Novel plant-based ingredients
- 3.31.3.4 Upcycled ingredients
- 3.31.4 Formulation and application innovations
- 3.31.4.1 Shelf-life extension solutions
- 3.31.4.2 Flavor enhancement techniques
- 3.31.4.3 Texturizing solutions
- 3.31.4.4 Color stability innovations
- 3.31.5 Packaging and delivery system innovations
- 3.31.5.1 Sustainable packaging
- 3.31.5.2 Smart packaging
- 3.31.5.3 Portion control packaging
- 3.31.5.4 Extended shelf-life packaging
- 3.31.6 R&d activities and innovation hubs
- 3.31.7 Technology adoption trends across regions
- 3.31.8 Future technology roadmap (2025-2034)
- 3.32 Pricing analysis and economic factors
- 3.32.1 Pricing trends
- 3.32.1.1 Historical price trends
- 3.32.1.2 Current pricing scenario
- 3.32.1.3 Price forecast
- 3.32.2 Factors affecting pricing
- 3.32.2.1 Raw material costs
- 3.32.2.2 Processing costs
- 3.32.2.3 Compliance costs
- 3.32.2.4 Market competition
- 3.32.2.5 Consumer willingness to pay
- 3.32.3 Pricing strategies
- 3.32.3.1 Premium vs. Mass market
- 3.32.3.2 Value-added pricing
- 3.32.3.3 Bundle pricing
- 3.32.4 Regional price variations
- 3.32.5 Price-value relationship analysis
- 3.32.6 Economic indicators
- 3.32.6.1 Gdp growth and consumer spending
- 3.32.6.2 Inflation and currency fluctuations
- 3.32.6.3 Agricultural commodity prices
- 3.32.6.4 Energy cost
- 3.32.1 Pricing trends
- 3.33 Supplier landscape
- 3.34 Profit margin analysis
- 3.35 Key news & initiatives
- 3.36 Regulatory landscape
- 3.37 Impact forces
- 3.37.1 Growth drivers
- 3.37.1.1 The rising consumer preference for clean-label products
- 3.37.1.2 Expanding food & beverage industry
- 3.37.1.3 Expansion of plant-based and organic food products requiring clean-label ingredient
- 3.37.2 Industry pitfalls & challenges
- 3.37.2.1 High cost of clean labelled food additives
- 3.37.2.2 Challenges in maintaining taste, texture, and shelf life without artificial preservatives
- 3.37.1 Growth drivers
- 3.38 Growth potential analysis
- 3.39 Porter's analysis
- 3.40 PESTEL analysis
Chapter 4 Competitive Landscape, 2024
- 4.1 Introduction
- 4.2 Company market share analysis
- 4.2.1 By region
- 4.2.2 North America
- 4.2.3 Europe
- 4.2.4 Asia Pacific
- 4.2.5 LATAM
- 4.2.6 MEA
- 4.3 Company matrix analysis
- 4.4 Competitive analysis of major market players
- 4.5 Competitive positioning matrix
- 4.6 Key developments
- 4.6.1 Mergers & acquisitions
- 4.6.2 Partnerships & collaborations
- 4.6.3 New Product Launches
- 4.6.4 Expansion Plans
Chapter 5 Market Size and Forecast, By Ingredient Type 2021 - 2034 (USD Billion, Kilo Tons)
- 5.1 Key trends
- 5.2 Natural colors
- 5.3 Natural flavors
- 5.4 Natural preservatives
- 5.5 Natural sweeteners
- 5.6 Hydrocolloids and texturizers
- 5.7 Functional native starches
- 5.8 Natural emulsifiers
- 5.9 Other
Chapter 6 Market Size and Forecast, By Source, 2021 - 2034 (USD Billion, Kilo Tons)
- 6.1 Key trends
- 6.2 Plant-based
- 6.3 Animal-based
- 6.4 Microbial/fermentation
- 6.5 Mineral-based
Chapter 7 Market Size and Forecast, By Form, 2021 - 2034 (USD Billion, Kilo Tons)
- 7.1 Key trend
- 7.2 Dry/powder
- 7.3 Liquid
- 7.4 Others
Chapter 8 Market Size and Forecast, By Certification, 2021 - 2034 (USD Billion, Kilo Tons)
- 8.1 Key trend
- 8.2 Organic
- 8.3 Non-GMO
- 8.4 Natural
- 8.5 Clean label certified
- 8.6 Others
Chapter 9 Market Size and Forecast, By End Use, 2021 - 2034 (USD Billion, Kilo Tons)
- 9.1 Key trend
- 9.2 Bakery & confectionery
- 9.3 Beverages
- 9.4 Dairy & frozen
- 9.5 Processed foods
- 9.6 Sauces & condiments
- 9.7 Snacks & convenience
- 9.8 Meat, poultry & Seafood
- 9.9 Others
Chapter 10 Market Size and Forecast, By Functionality, 2021 - 2034 (USD Billion, Kilo Tons)
- 10.1 Key trend
- 10.2 Preservation
- 10.3 Texture modification
- 10.4 Flavor/color enhancement
- 10.5 Emulsification
- 10.6 Sweetening
- 10.7 Others
Chapter 11 Market Size and Forecast, By Consumer, 2021 - 2034 (USD Billion, Kilo Tons)
- 11.1 Key trend
- 11.2 Conventional product
- 11.3 Premium product
- 11.4 Health & wellness product
- 11.5 Children’s products
- 11.6 Others
Chapter 12 Market Estimates and Forecast, By Region, 2021 - 2034 (USD Billion) (Kilo Tons)
- 12.1 Key trends
- 12.2 North America
- 12.2.1 U.S.
- 12.2.2 Canada
- 12.3 Europe
- 12.3.1 Germany
- 12.3.2 UK
- 12.3.3 France
- 12.3.4 Spain
- 12.3.5 Italy
- 12.4 Asia Pacific
- 12.4.1 China
- 12.4.2 India
- 12.4.3 Japan
- 12.4.4 Australia
- 12.4.5 South Korea
- 12.5 Latin America
- 12.5.1 Brazil
- 12.5.2 Mexico
- 12.5.3 Argentina
- 12.6 Middle East and Africa
- 12.6.1 Saudi Arabia
- 12.6.2 South Africa
- 12.6.3 UAE
Chapter 13 Company Profiles
- 13.1 ADM
- 13.2 Cargill
- 13.3 Corbion Inc.
- 13.4 DSM
- 13.5 Frutarom
- 13.6 Ingredion
- 13.7 International Flavors & Fragrances Inc.
- 13.8 Kemin Industries, Inc.
- 13.9 Kerry Group
- 13.10 Sensient Technologies
- 13.11 Tate & Lyle

