

 |
市場調查報告書
商品編碼
1750618
電腦視覺市場中的人工智慧機會、成長動力、產業趨勢分析及 2025 - 2034 年預測AI in Computer Vision Market Opportunity, Growth Drivers, Industry Trend Analysis, and Forecast 2025 - 2034 |
||||||
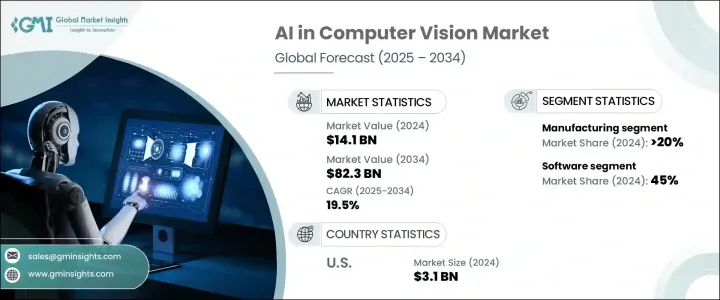
2024 年全球電腦視覺人工智慧市場價值為 141 億美元,預計到 2034 年將以 19.5% 的複合年成長率成長,達到 823 億美元,這得益於深度學習技術的進步,尤其是卷積神經網路 (CNN) 和 Transformer 模型,它們提高了視覺資料處理的準確性和效率。這些發展使機器能夠解讀複雜的視覺訊息,促進物件偵測、分類和識別等應用。隨著人工智慧系統越來越擅長處理多樣化和複雜的視覺資料,它們的效用遍及醫療保健、汽車、零售和製造等各個領域。來自監視攝影機、無人機和智慧型手機等來源的視覺資料量不斷增加,迫切需要開發自動分析工具。
人工智慧驅動的電腦視覺系統可以即時處理和分析海量影像和視訊資料集,提供對安防和醫療等行業至關重要的及時準確的洞察。這些系統能夠偵測異常、辨識人臉、辨識物體並監控活動,其速度和精確度遠超傳統方法。在安防領域,這可以實現主動威脅檢測和自動化監控;在醫療領域,它可以透過醫學影像促進早期診斷,支援手術輔助,並增強病患監護。隨著這些技術的不斷發展,它們在提升各種應用的營運效率、安全性和決策能力方面發揮著越來越重要的作用。
| 市場範圍 | |
|---|---|
| 起始年份 | 2024 |
| 預測年份 | 2025-2034 |
| 起始值 | 141億美元 |
| 預測值 | 823億美元 |
| 複合年成長率 | 19.5% |
2024年,製造業佔了20%的市場佔有率,價值30億美元。在製造業中整合人工智慧驅動的視覺系統有助於實現自動化品質控制,減少人為錯誤並確保產品標準的一致性。這些系統透過即時識別缺陷和異常來提高營運效率,從而最佳化生產流程並減少浪費。工業4.0概念的採用,將人工智慧、物聯網(IoT)和機器人技術結合,正在加速電腦視覺技術在製造環境中的部署。
軟體領域在2024年引領市場,佔45%的佔有率。軟體解決方案是電腦視覺領域人工智慧不可或缺的一部分,能夠實現臉部辨識、物件偵測和影像分類等複雜任務。這些軟體平台高度可客製化,能夠適應特定行業需求,包括醫學影像、自動駕駛汽車導航和零售分析。人工智慧軟體的靈活性和可擴展性使其成為尋求提陞技術能力和實現更高投資回報的公司的首選投資。
2024年,北美電腦視覺市場人工智慧 (AI) 產值達31億美元,這得益於領先的科技公司、政府和私營部門的大量投資以及強大的研發現狀系統。麻省理工學院 (MIT) 和史丹佛大學 (Stanford) 等大學以及企業研究實驗室為人工智慧技術的發展做出了貢獻。美國的汽車、醫療保健和零售等行業是人工智慧電腦視覺工具的早期採用者,並利用這些工具實現自動化、進階監控、診斷和物流營運。
電腦視覺產業人工智慧的主要參與者包括亞馬遜、NVIDIA、IBM、微軟、英特爾、Google、AMD、康耐視、Teledyne Technologies 和 Basler AG。這些公司在開發和部署人工智慧驅動的視覺系統方面處於領先地位,涵蓋各個領域,推動創新並擴大市場覆蓋範圍。為了鞏固市場地位,電腦視覺產業的人工智慧公司正在採取多項關鍵策略,包括投資研發以增強人工智慧演算法和硬體的功能,建立策略合作夥伴關係和合作關係以擴展其技術專長和市場覆蓋範圍,以及專注於產品創新以滿足不同產業不斷變化的需求。
目錄
第1章:方法論與範圍
第2章:執行摘要
第3章:行業洞察
- 產業生態系統分析
- 供應商格局
- 硬體提供者
- 軟體供應商
- 服務提供者
- 技術提供者
- 最終用途
- 利潤率分析
- 川普政府關稅的影響
- 對貿易的影響
- 貿易量中斷
- 報復措施
- 對產業的影響
- 供應方影響(原料)
- 主要材料價格波動
- 供應鏈重組
- 生產成本影響
- 需求面影響(售價)
- 價格傳導至終端市場
- 市佔率動態
- 消費者反應模式
- 供應方影響(原料)
- 受影響的主要公司
- 策略產業反應
- 供應鏈重組
- 定價和產品策略
- 政策參與
- 展望與未來考慮
- 對貿易的影響
- 技術與創新格局
- 機器人流程自動化
- AI最佳化硬體
- 深度學習平台
- 專利分析
- 重要新聞和舉措
- 電腦視覺中人工智慧的用例
- 監管格局
- 衝擊力
- 成長動力
- 深度學習和人工智慧演算法的快速進步
- 視覺資料量的增加
- 對自動化和品質控制的需求日益成長
- 邊緣運算整合度的提高
- 產業陷阱與挑戰
- 資料隱私和安全問題
- 與遺留系統整合
- 成長動力
- 成長潛力分析
- 波特的分析
- PESTEL分析
第4章:競爭格局
- 介紹
- 公司市佔率分析
- 競爭定位矩陣
- 戰略展望矩陣
第5章:市場估計與預測:按組件,2021 - 2034 年
- 主要趨勢
- 硬體
- 相機和影像感測器
- 處理器(GPU、TPU、VPU)
- 整合系統
- 邊緣運算設備
- 軟體
- 開發框架和工具
- 視覺 API 和 SDK
- 預訓練模型
- 客製化視覺解決方案
- 基於雲端的視覺服務
- 服務
- 實施與整合
- 培訓和支持
- 諮詢
- 維護和升級
第6章:市場估計與預測:按應用,2021 - 2034 年
- 主要趨勢
- 預測性維護
- 品質保證和檢驗
- 定位與引導
- 識別和測量
- 其他
第7章:市場估計與預測:依最終用途,2021 - 2034 年
- 主要趨勢
- 汽車和運輸
- 製造業
- 政府
- 零售
- 金融服務業
- 衛生保健
- 其他
第8章:市場估計與預測:依功能,2021 - 2034 年
- 主要趨勢
- 訓練
- 推論
第9章:市場估計與預測:依技術分類,2021 - 2034 年
- 主要趨勢
- 機器學習
- 通用人工智慧
第10章:市場估計與預測:按地區,2021 - 2034 年
- 主要趨勢
- 北美洲
- 美國
- 加拿大
- 歐洲
- 英國
- 德國
- 法國
- 義大利
- 西班牙
- 俄羅斯
- 北歐人
- 亞太地區
- 中國
- 印度
- 日本
- 澳洲
- 韓國
- 東南亞
- 拉丁美洲
- 巴西
- 墨西哥
- 阿根廷
- MEA
- 阿拉伯聯合大公國
- 南非
- 沙烏地阿拉伯
第 11 章:公司簡介
- Advanced Micro Device
- Amazon
- Basler
- Clarifai
- Cognex
- Deepomatic
- Graphcore
- Hailo
- IBM
- Intel
- Keyence
- Microsoft
- NVIDIA
- Omron
- Qualcomm
- Sick
- Sony
- Teledyne Technologies
- Texas Instruments
The Global AI in Computer Vision Market was valued at USD 14.1 billion in 2024 and is estimated to grow at a CAGR of 19.5% to reach USD 82.3 billion by 2034, driven by the advancements in deep learning technologies, particularly Convolutional Neural Networks (CNNs) and transformer models, have enhanced the accuracy and efficiency of visual data processing. These developments enable machines to interpret complex visual information, facilitating applications such as object detection, classification, and recognition. As AI systems become more adept at handling diverse and intricate visual data, their utility spans various sectors, including healthcare, automotive, retail, and manufacturing. The increasing volume of visual data from sources like surveillance cameras, drones, and smartphones necessitates the development of automated analysis tools.
AI-powered computer vision systems can process and analyze large image and video datasets in real time, providing timely and accurate insights crucial for industries like security and healthcare. These systems can detect anomalies, recognizing faces, identifying objects, and monitoring activities with a level of speed and precision that far exceeds traditional methods. In security, this enables proactive threat detection and automated surveillance, while in healthcare, it facilitates early diagnosis through medical imaging, supports surgical assistance, and enhances patient monitoring. As these technologies continue to evolve, they are playing an increasingly integral role in improving operational efficiency, safety, and decision-making across a wide range of applications.
| Market Scope | |
|---|---|
| Start Year | 2024 |
| Forecast Year | 2025-2034 |
| Start Value | $14.1 Billion |
| Forecast Value | $82.3 Billion |
| CAGR | 19.5% |
In 2024, the manufacturing sector held a 20% share, valued at USD 3 billion. Integrating AI-driven vision systems in manufacturing facilitates automated quality control, reducing human error and ensuring consistent product standards. These systems enhance operational efficiency by identifying defects and anomalies in real time, leading to optimized production processes and reduced waste. The adoption of Industry 4.0 concepts, which combine AI, the Internet of Things (IoT), and robotics, is accelerating the deployment of computer vision technologies in manufacturing environments.
The software segment led the market in 2024, capturing 45% share. Software solutions are integral to AI in computer vision, enabling complex tasks such as facial recognition, object detection, and image classification. These software platforms are highly customizable, allowing adaptation to specific industry needs, including medical imaging, autonomous vehicle navigation, and retail analytics. The flexibility and scalability of AI software make it a preferred investment for companies seeking to enhance their technological capabilities and achieve a higher return on investment.
North America AI in Computer Vision Market generated USD 3.1 billion in 2024, attributed to the presence of leading technology companies, substantial government and private sector investments, and a robust research and development ecosystem. Institutions such as MIT and Stanford, along with corporate research labs, contribute to developing AI technologies. Industries in the U.S., including automotive, healthcare, and retail, are early adopters of AI-powered computer vision tools, leveraging them for automation, advanced surveillance, diagnostics, and logistical operations.
Key players in the AI in Computer Vision Industry include Amazon, NVIDIA, IBM, Microsoft, Intel, Google, Advanced Micro Devices Inc., Cognex Corporation, Teledyne Technologies, and Basler AG. These companies are at the forefront of developing and deploying AI-driven vision systems across various sectors, driving innovation and expanding the market's reach. To strengthen their market position, companies in the AI in computer vision industry are adopting several key strategies. These include investing in research and development to enhance the capabilities of AI algorithms and hardware, forming strategic partnerships and collaborations to expand their technological expertise and market reach, and focusing on product innovation to meet the evolving needs of different industries.
Table of Contents
Chapter 1 Methodology & Scope
- 1.1 Research design
- 1.1.1 Research approach
- 1.1.2 Data collection methods
- 1.2 Base estimates & calculations
- 1.2.1 Base year calculation
- 1.2.2 Key trends for market estimation
- 1.3 Forecast model
- 1.4 Primary research and validation
- 1.4.1 Primary sources
- 1.4.2 Data mining sources
- 1.5 Market scope & definition
Chapter 2 Executive Summary
- 2.1 Industry 3600 synopsis, 2021 - 2034
Chapter 3 Industry Insights
- 3.1 Industry ecosystem analysis
- 3.2 Supplier landscape
- 3.2.1 Hardware providers
- 3.2.2 Software providers
- 3.2.3 Service providers
- 3.2.4 Technology providers
- 3.2.5 End use
- 3.3 Profit margin analysis
- 3.4 Impact of Trump administration tariffs
- 3.4.1 Impact on trade
- 3.4.1.1 Trade volume disruptions
- 3.4.1.2 Retaliatory measures
- 3.4.2 Impact on industry
- 3.4.2.1 Supply-side impact (raw materials)
- 3.4.2.1.1 Price volatility in key materials
- 3.4.2.1.2 Supply chain restructuring
- 3.4.2.1.3 Production cost implications
- 3.4.2.2 Demand-side impact (selling price)
- 3.4.2.2.1 Price transmission to end markets
- 3.4.2.2.2 Market share dynamics
- 3.4.2.2.3 Consumer response patterns
- 3.4.2.1 Supply-side impact (raw materials)
- 3.4.3 Key companies impacted
- 3.4.4 Strategic industry responses
- 3.4.4.1 Supply chain reconfiguration
- 3.4.4.2 Pricing and product strategies
- 3.4.4.3 Policy engagement
- 3.4.5 Outlook & future considerations
- 3.4.1 Impact on trade
- 3.5 Technology & innovation landscape
- 3.5.1 Robotic process automation
- 3.5.2 AI optimized hardware
- 3.5.3 Deep learning platform
- 3.6 Patent analysis
- 3.7 Key news & initiatives
- 3.8 Use cases of AI in computer vision
- 3.9 Regulatory landscape
- 3.10 Impact forces
- 3.10.1 Growth drivers
- 3.10.1.1 Rapid advancements in deep learning & AI algorithms
- 3.10.1.2 Rise in amount of visual data
- 3.10.1.3 Growing need for automation and quality control
- 3.10.1.4 Increase in the edge computing integration
- 3.10.2 Industry pitfalls & challenges
- 3.10.2.1 Data privacy and security concerns
- 3.10.2.2 Integration with legacy systems
- 3.10.1 Growth drivers
- 3.11 Growth potential analysis
- 3.12 Porter's analysis
- 3.13 PESTEL analysis
Chapter 4 Competitive Landscape, 2024
- 4.1 Introduction
- 4.2 Company market share analysis
- 4.3 Competitive positioning matrix
- 4.4 Strategic outlook matrix
Chapter 5 Market Estimates & Forecast, By Component, 2021 - 2034 ($Bn, Units)
- 5.1 Key trends
- 5.2 Hardware
- 5.2.1 Cameras and image sensors
- 5.2.2 Processors (GPUs, TPUs, VPUs)
- 5.2.3 Integrated systems
- 5.2.4 Edge computing devices
- 5.3 Software
- 5.3.1 Development frameworks and tools
- 5.3.2 Vision APIs and SDKs
- 5.3.3 Pre-trained models
- 5.3.4 Custom vision solutions
- 5.3.5 Cloud-based vision services
- 5.4 Services
- 5.4.1 Implementation and integration
- 5.4.2 Training and support
- 5.4.3 Consulting
- 5.4.4 Maintenance and upgrades
Chapter 6 Market Estimates & Forecast, By Application, 2021 - 2034 ($Bn)
- 6.1 Key trends
- 6.2 Predictive maintenance
- 6.3 Quality assurance and inspection
- 6.4 Positioning and guidance
- 6.5 Identification and measurement
- 6.6 Others
Chapter 7 Market Estimates & Forecast, By End Use, 2021 - 2034 ($Bn)
- 7.1 Key trends
- 7.2 Automotive and transportation
- 7.3 Manufacturing
- 7.4 Government
- 7.5 Retail
- 7.6 BFSI
- 7.7 Healthcare
- 7.8 Others
Chapter 8 Market Estimates & Forecast, By Function, 2021 - 2034 ($Bn)
- 8.1 Key trends
- 8.2 Training
- 8.3 Inferences
Chapter 9 Market Estimates & Forecast, By Technology, 2021 - 2034 ($Bn)
- 9.1 Key trends
- 9.2 ML
- 9.3 Gen AI
Chapter 10 Market Estimates & Forecast, By Region, 2021 - 2034 ($Bn)
- 10.1 Key trends
- 10.2 North America
- 10.2.1 U.S.
- 10.2.2 Canada
- 10.3 Europe
- 10.3.1 UK
- 10.3.2 Germany
- 10.3.3 France
- 10.3.4 Italy
- 10.3.5 Spain
- 10.3.6 Russia
- 10.3.7 Nordics
- 10.4 Asia Pacific
- 10.4.1 China
- 10.4.2 India
- 10.4.3 Japan
- 10.4.4 Australia
- 10.4.5 South Korea
- 10.4.6 Southeast Asia
- 10.5 Latin America
- 10.5.1 Brazil
- 10.5.2 Mexico
- 10.5.3 Argentina
- 10.6 MEA
- 10.6.1 UAE
- 10.6.2 South Africa
- 10.6.3 Saudi Arabia
Chapter 11 Company Profiles
- 11.1 Advanced Micro Device
- 11.2 Amazon
- 11.3 Basler
- 11.4 Clarifai
- 11.5 Cognex
- 11.6 Deepomatic
- 11.7 Google
- 11.8 Graphcore
- 11.9 Hailo
- 11.10 IBM
- 11.11 Intel
- 11.12 Keyence
- 11.13 Microsoft
- 11.14 NVIDIA
- 11.15 Omron
- 11.16 Qualcomm
- 11.17 Sick
- 11.18 Sony
- 11.19 Teledyne Technologies
- 11.20 Texas Instruments
 電腦視覺市場中的人工智慧:按組件、技術、功能、應用、部署模式和最終用戶產業分類——2026-2032年全球市場預測
 2026年全球聲學迴聲消除市場報告2026年全球人工智慧電腦視覺市場報告2026年全球人工智慧(AI)音樂相似度搜尋市場報告
 電腦視覺領域的人工智慧(AI)市場-策略分析與預測(2026-2031)頭部和眼動追蹤軟體市場:按追蹤類型、組件、部署模式、應用程式和最終用戶分類,全球預測(2026-2032年)
 電腦視覺人工智慧市場分析及預測(至2035年):按類型、產品、技術、組件、應用、最終用戶、流程、部署和解決方案分類全球可視化人數計算攝影機市場:按技術、部署模式、外形規格、精度等級和應用分類,2026-2032年預測嵌入式視覺板級相機市場:按技術、分銷管道和應用分類 - 全球預測(2026-2032 年)
 電腦視覺人工智慧 (AI) 市場規模、佔有率和成長分析(按機器學習模型、產品、功能、技術、應用、垂直產業和地區分類)—產業預測 (2026-2033)