

 |
市場調查報告書
商品編碼
1750601
柴油主發電機市場機會、成長動力、產業趨勢分析及 2025 - 2034 年預測Diesel Prime Power Generators Market Opportunity, Growth Drivers, Industry Trend Analysis, and Forecast 2025 - 2034 |
||||||
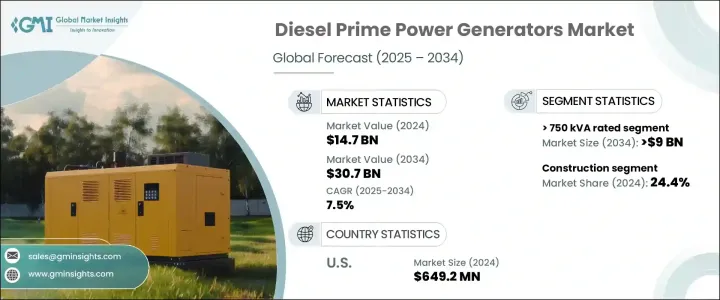
2024年,全球柴油主發電機市場規模達147億美元,預計到2034年將以7.5%的複合年成長率成長,達到307億美元,這得益於各行各業對穩定高效電力供應日益成長的需求。這一成長主要歸因於基礎設施的快速擴張以及發展中經濟體對可靠電網系統日益成長的需求。世界各地的各行各業都面臨著頻繁停電和電力基礎設施不穩定的問題,因此採用可靠的電源來維持營運的連續性至關重要。柴油主發電機已成為工業、商業機構和離網場所等需要持續供電的關鍵解決方案。
基礎設施項目的廣泛成長和工業化步伐的加快,為市場帶來了強勁的發展勢頭。隨著各國加大對大規模開發的投資,對可靠能源系統的需求也愈發迫切。備用電源和持續供電的需求日益凸顯,尤其是在經常停電和電網不穩定的地區。旨在降低排放的技術進步也在塑造市場格局方面發揮關鍵作用。隨著政府和組織機構對永續實踐的重視,製造商正在創新柴油發電機技術,使其既符合排放法規,又能提供高性能。此外,工業設施和敏感商業應用等高功率營運的擴張也持續推動市場的發展。電力可靠性、靈活性和耐用性仍然是最終用戶的首要考慮因素,這為基於柴油的主要電力系統創造了強大的商業案例。
| 市場範圍 | |
|---|---|
| 起始年份 | 2024 |
| 預測年份 | 2025-2034 |
| 起始值 | 147億美元 |
| 預測值 | 307億美元 |
| 複合年成長率 | 7.5% |
市場也受益於對高負載處理設備需求產業的投資增加。隨著人們對環境永續性的認知不斷提高,將再生能源融入混合動力發電機模式的動力也日益增強。製造商正在積極開發節油型引擎和混合動力配置,以兼顧電力需求和環境問題。產品供應的這種演變符合不同地區最終用戶的多樣化需求,從而實現了更好的客製化和更廣泛的應用。向永續解決方案的轉變正在促進產品開發,從而催生更先進、更具成本效益和更高效的發電機組。
根據額定功率,柴油主發電機市場細分為 > 50 kVA - 125 kVA、? 50 kVA、> 125 kVA - 200 kVA、> 330 kVA - 750 kVA、> 200 kVA - 330 kVA 和 > 750 kVA。其中,> 750 kVA 類別佔據主導地位,預計到 2034 年將超過 90 億美元。這些大容量發電機專為電網不可用或不可靠的嚴苛環境而設計。它們能夠在惡劣條件下持續提供大量電力,使其成為關鍵任務應用的理想選擇。其堅固的設計和高效率使其成為需要持續穩定電力的場景中不可或缺的一部分,尤其是在營運要求高的行業中。
按應用領域分類,該行業可分為酒店、電信、採礦、建築、石油和天然氣、農業、工業及其他。光是建築業在2024年的市佔率就高達24.4%。這是由於在電網接入通常受限或不穩定的施工現場,對不間斷電源的需求不斷成長。智慧電源管理系統與再生能源組件的整合進一步提高了建築領域的營運效率。工業建築活動仍然嚴重依賴柴油發電機,這進一步增強了該行業在整體市場成長中的作用。
從區域來看,美國市場穩定擴張,2022年市值達5.706億美元,2023年達到6.108億美元,2024年達6.492億美元。美國日益容易受到極端天氣事件影響,加劇了對可靠備用電源系統的需求。預計北美市場將大幅成長,到2034年將突破10億美元。這一成長主要源於電網基礎設施老化以及城市和偏遠地區對穩定能源日益成長的需求。排放控制、數位監控和智慧發電機技術的創新正在提升產品性能,並促進該地區的普及。
柴油主發電機產業整合程度適中,前五大公司佔全球約40%的市場。這些公司以其強大的技術專長和廣泛的供應網路而聞名。其廣泛的產品組合可滿足能源、醫療保健、製造和商業營運等行業的多樣化需求。他們注重創新和適應性,確保在快速變化的能源格局中保持競爭力。
目錄
第1章:方法論與範圍
第2章:執行摘要
第3章:行業洞察
- 產業生態系統分析
- 川普政府關稅分析
- 對貿易的影響
- 貿易量中斷
- 報復措施
- 對產業的影響
- 供應方影響(原料)
- 主要材料價格波動
- 供應鏈重組
- 生產成本影響
- 需求面影響(售價)
- 價格傳導至終端市場
- 市佔率動態
- 消費者反應模式
- 供應方影響(原料)
- 受影響的主要公司
- 策略產業反應
- 供應鏈重組
- 定價和產品策略
- 政策參與
- 展望與未來考慮
- 對貿易的影響
- 監管格局
- 產業衝擊力
- 成長動力
- 產業陷阱與挑戰
- 成長潛力分析
- 波特的分析
- PESTEL分析
第4章:競爭格局
- 介紹
- 戰略儀表板
- 策略舉措
- 公司市佔率分析
- 競爭基準測試
- 創新與永續發展格局
第5章:市場規模及預測:依功率等級,2021 - 2034 年
- 主要趨勢
- ≤50千伏安
- > 50千伏安 - 125千伏安
- > 125 千伏安 - 200 千伏安
- > 200 千伏安 - 330 千伏安
- > 330 千伏安 - 750 千伏安
- > 750千伏安
第6章:市場規模及預測:依應用,2021 - 2034
- 主要趨勢
- 電信
- 飯店業
- 石油和天然氣
- 礦業
- 建造
- 農業
- 產業
- 其他
第7章:市場規模及預測:依地區,2021 - 2034
- 主要趨勢
- 北美洲
- 美國
- 加拿大
- 歐洲
- 俄羅斯
- 英國
- 德國
- 法國
- 西班牙
- 奧地利
- 義大利
- 亞太地區
- 中國
- 澳洲
- 印度
- 日本
- 韓國
- 印尼
- 馬來西亞
- 泰國
- 越南
- 菲律賓
- 緬甸
- 孟加拉
- 中東
- 沙烏地阿拉伯
- 阿拉伯聯合大公國
- 卡達
- 土耳其
- 伊朗
- 阿曼
- 非洲
- 埃及
- 奈及利亞
- 阿爾及利亞
- 南非
- 安哥拉
- 肯亞
- 莫三比克
- 拉丁美洲
- 巴西
- 墨西哥
- 阿根廷
- 智利
第8章:公司簡介
- Ashok Leyland
- Atlas Copco
- Briggs & Stratton
- Caterpillar
- Cummins
- Deere & Company
- Generac Power Systems
- HIMOINSA
- Kirloskar
- Mahindra POWEROL
- Mitsubishi Heavy Industries
- Rapid Power Generation
- Rehlko
- Rolls-Royce
- Siemens
- Volvo Penta
- Wartsilä
- Yanmar Holdings
The Global Diesel Prime Power Generators Market was valued at USD 14.7 billion in 2024 and is estimated to grow at a CAGR of 7.5% to reach USD 30.7 billion by 2034, driven by the increasing need for a stable and efficient power supply across various sectors. This surge is primarily attributed to rapid infrastructure expansion and the growing demand for reliable grid systems in developing economies. Industries around the world are facing frequent power outages and unstable electrical infrastructure, making it essential to adopt dependable power sources to maintain operational continuity. Diesel prime power generators have emerged as a critical solution for industries, commercial establishments, and off-grid locations that require consistent power without interruption.
The market is seeing considerable momentum from the widespread growth of infrastructure projects and the increasing pace of industrialization. As nations invest in large-scale developments, the demand for reliable energy systems becomes even more crucial. The need for backup and continuous power has become more pronounced, especially in areas facing regular blackouts and grid instability. Technological advancements aimed at lowering emissions are also playing a pivotal role in shaping the market landscape. As governments and organizations emphasize sustainable practices, manufacturers are innovating diesel generator technologies that align with emission regulations while delivering high performance. Furthermore, the expansion of high-power operations such as industrial facilities and sensitive commercial applications continues to boost the market. Power reliability, flexibility, and durability remain top priorities for end-users, creating a strong business case for diesel-based prime power systems.
| Market Scope | |
|---|---|
| Start Year | 2024 |
| Forecast Year | 2025-2034 |
| Start Value | $14.7 Billion |
| Forecast Value | $30.7 billion |
| CAGR | 7.5% |
The market is also benefiting from increased investments in sectors that require high-load handling equipment. With growing awareness around environmental sustainability, there is a stronger push to integrate renewable energy sources into hybrid generator models. Manufacturers are actively developing fuel-efficient engines and hybrid configurations that address both power demands and environmental concerns. This evolution in product offerings is in line with the diverse needs of end-users across various regions, allowing for better customization and wider adoption. The transition toward sustainable solutions is enhancing product development, leading to more advanced, cost-effective, and efficient generator sets.
Based on power rating, the diesel prime power generators market is segmented into ≤ 50 kVA, > 50 kVA - 125 kVA, > 125 kVA - 200 kVA, > 200 kVA - 330 kVA, > 330 kVA - 750 kVA, and > 750 kVA. Among these, the > 750 kVA category holds a dominant position and is anticipated to exceed USD 9 billion by 2034. These high-capacity generators are specifically designed for demanding environments where the grid is either unavailable or unreliable. Their ability to consistently deliver large volumes of power under strenuous conditions makes them ideal for mission-critical applications. Their robust design and high efficiency make them indispensable in scenarios requiring continuous and stable electricity, especially in industries with high operational demands.
In terms of application, the industry is categorized into hospitality, telecom, mining, construction, oil and gas, agriculture, industrial, and others. The construction segment alone held a 24.4% share in 2024. This is due to the increased demand for uninterrupted power on job sites where grid access is often limited or unreliable. The integration of intelligent power management systems and renewable components further enhances operational efficiency in the construction domain. Industrial construction activities continue to rely heavily on diesel generators, reinforcing the segment's role in overall market growth.
Regionally, the United States has shown steady market expansion, with values reaching USD 570.6 million in 2022, USD 610.8 million in 2023, and USD 649.2 million in 2024. The country's increasing susceptibility to extreme weather events has amplified the demand for reliable backup power systems. The broader North American market is projected to grow significantly and is expected to cross USD 1 billion by 2034. This growth is driven by aging grid infrastructure and a rising need for consistent energy in both urban and remote locations. Innovations in emission control, digital monitoring, and smart generator technologies are enhancing product performance and adoption across the region.
The diesel prime power generators industry is moderately consolidated, with the top five players accounting for approximately 40% of the global market. These companies are known for their strong technological expertise and expansive supply networks. Their broad product portfolios cater to diverse needs across sectors including energy, healthcare, manufacturing, and commercial operations. Their focus on innovation and adaptability ensures that they remain competitive in a rapidly changing energy landscape.
Table of Contents
Chapter 1 Methodology & Scope
- 1.1 Research design
- 1.2 Market estimates & forecast parameters
- 1.3 Forecast calculation
- 1.4 Data sources
- 1.4.1 Primary
- 1.4.2 Secondary
- 1.4.2.1 Paid
- 1.4.2.2 Public
- 1.5 Market definitions
Chapter 2 Executive Summary
- 2.1 Industry synopsis, 2021 - 2034
Chapter 3 Industry Insights
- 3.1 Industry ecosystem analysis
- 3.2 Trump administration tariffs analysis
- 3.2.1 Impact on trade
- 3.2.1.1 Trade volume disruptions
- 3.2.1.2 Retaliatory measures
- 3.2.2 Impact on the industry
- 3.2.2.1 Supply-side impact (raw materials)
- 3.2.2.1.1 Price volatility in key materials
- 3.2.2.1.2 Supply chain restructuring
- 3.2.2.1.3 Production cost implications
- 3.2.2.2 Demand-side impact (selling price)
- 3.2.2.2.1 Price transmission to end markets
- 3.2.2.2.2 Market share dynamics
- 3.2.2.2.3 Consumer response patterns
- 3.2.2.1 Supply-side impact (raw materials)
- 3.2.3 Key companies impacted
- 3.2.4 Strategic industry responses
- 3.2.4.1 Supply chain reconfiguration
- 3.2.4.2 Pricing and product strategies
- 3.2.4.3 Policy engagement
- 3.2.5 Outlook and future considerations
- 3.2.1 Impact on trade
- 3.3 Regulatory landscape
- 3.4 Industry impact forces
- 3.4.1 Growth drivers
- 3.4.2 Industry pitfalls & challenges
- 3.5 Growth potential analysis
- 3.6 Porter's analysis
- 3.6.1 Bargaining power of suppliers
- 3.6.2 Bargaining power of buyers
- 3.6.3 Threat of new entrants
- 3.6.4 Threat of substitutes
- 3.7 PESTEL analysis
Chapter 4 Competitive Landscape, 2025
- 4.1 Introduction
- 4.2 Strategic dashboard
- 4.3 Strategic initiatives
- 4.4 Company market share analysis, 2024
- 4.5 Competitive benchmarking
- 4.6 Innovation & sustainability landscape
Chapter 5 Market Size and Forecast, By Power Rating, 2021 - 2034 (USD Million & Units)
- 5.1 Key trends
- 5.2 ≤ 50 kVA
- 5.3 > 50 kVA - 125 kVA
- 5.4 > 125 kVA - 200 kVA
- 5.5 > 200 kVA - 330 kVA
- 5.6 > 330 kVA - 750 kVA
- 5.7 > 750 kVA
Chapter 6 Market Size and Forecast, By Application, 2021 - 2034 (USD Million & Units)
- 6.1 Key trends
- 6.2 Telecom
- 6.3 Hospitality
- 6.4 Oil & gas
- 6.5 Mining
- 6.6 Construction
- 6.7 Agriculture
- 6.8 Industries
- 6.9 Others
Chapter 7 Market Size and Forecast, By Region, 2021 - 2034 (USD Million & Units)
- 7.1 Key trends
- 7.2 North America
- 7.2.1 U.S.
- 7.2.2 Canada
- 7.3 Europe
- 7.3.1 Russia
- 7.3.2 UK
- 7.3.3 Germany
- 7.3.4 France
- 7.3.5 Spain
- 7.3.6 Austria
- 7.3.7 Italy
- 7.4 Asia Pacific
- 7.4.1 China
- 7.4.2 Australia
- 7.4.3 India
- 7.4.4 Japan
- 7.4.5 South Korea
- 7.4.6 Indonesia
- 7.4.7 Malaysia
- 7.4.8 Thailand
- 7.4.9 Vietnam
- 7.4.10 Philippines
- 7.4.11 Myanmar
- 7.4.12 Bangladesh
- 7.5 Middle East
- 7.5.1 Saudi Arabia
- 7.5.2 UAE
- 7.5.3 Qatar
- 7.5.4 Turkey
- 7.5.5 Iran
- 7.5.6 Oman
- 7.6 Africa
- 7.6.1 Egypt
- 7.6.2 Nigeria
- 7.6.3 Algeria
- 7.6.4 South Africa
- 7.6.5 Angola
- 7.6.6 Kenya
- 7.6.7 Mozambique
- 7.7 Latin America
- 7.7.1 Brazil
- 7.7.2 Mexico
- 7.7.3 Argentina
- 7.7.4 Chile
Chapter 8 Company Profiles
- 8.1 Ashok Leyland
- 8.2 Atlas Copco
- 8.3 Briggs & Stratton
- 8.4 Caterpillar
- 8.5 Cummins
- 8.6 Deere & Company
- 8.7 Generac Power Systems
- 8.8 HIMOINSA
- 8.9 Kirloskar
- 8.10 Mahindra POWEROL
- 8.11 Mitsubishi Heavy Industries
- 8.12 Rapid Power Generation
- 8.13 Rehlko
- 8.14 Rolls-Royce
- 8.15 Siemens
- 8.16 Volvo Penta
- 8.17 Wartsilä
- 8.18 Yanmar Holdings
 全球柴油發電機市場(至2031年):按設計(固定式和可攜式)、應用(備用、抑低尖峰負載、主用和連續用)、最終用戶(工業、商業和住宅)、額定功率和地區分類
 柴油發電機市場:2026-2032年全球市場預測(依額定千伏安、冷卻方式、安裝方式、應用及銷售管道)
 柴油發電機市場規模、佔有率、成長及全球產業分析:按類型、應用和地區分類,並提供2026-2034年的洞察和預測液氣冷卻劑分配單元市場:依產品類型、技術、應用、終端用戶產業及通路分類,全球預測,2026-2032年
 柴油發電機:市場佔有率分析、產業趨勢與統計、成長預測(2026-2031)
 2026年全球空氣冷發電機市場報告2026年全球柴油發電機市場報告
 柴油發電機監控系統市場 - 全球產業規模、佔有率、趨勢、機會及預測(按類型、應用、組件、地區和競爭格局分類),2021-2031年
 日本柴油發電機市場規模、佔有率、趨勢及預測(按容量、應用、移動性、最終用戶及地區分類),2026年至2034年
 柴油發電機市場規模、佔有率和趨勢分析報告:按額定輸出功率、應用、地區和細分市場預測(2026-2033 年)