


 |
市場調查報告書
商品編碼
1750594
工業電子燃料市場機會、成長動力、產業趨勢分析及 2025 - 2034 年預測Industrial E-Fuel Market Opportunity, Growth Drivers, Industry Trend Analysis, and Forecast 2025 - 2034 |
||||||
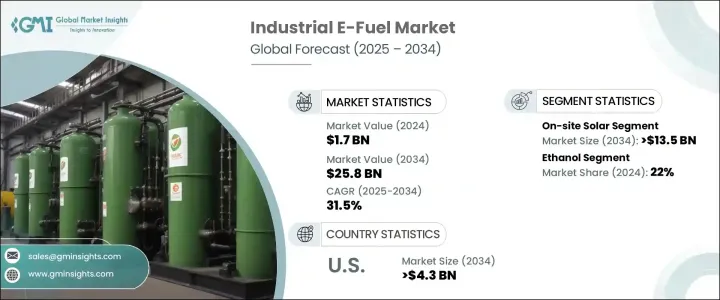
2024年,全球工業電子燃料市場規模達17億美元,預計2034年將以31.5%的複合年成長率成長,達到258億美元。這得歸功於全球脫碳的推動以及工業領域對永續能源替代品日益成長的需求。隨著各行各業紛紛尋求傳統化石燃料的可行替代品,電子燃料已成為製造業、重型運輸和航空等產業的有力解決方案。先進生產技術的融合,加上效率和成本控制的改進,持續提升了這些合成燃料的可行性。政府的支持性舉措、清潔能源激勵措施以及全球減排目標加速了其應用。
此外,對再生能源與工業營運整合的高度重視,鼓勵企業採用長期、碳中和的能源架構。企業將其策略與全球永續發展目標結合,優先考慮低排放燃料,以減少對傳統化石能源的依賴。邁向穩定且富有韌性的能源供應鏈的舉措不僅受到環境法規的推動,也受到本地化清潔能源生產的經濟優勢的驅動。這一趨勢為電子燃料釋放了新的潛力,尤其是在難以脫碳的產業,因為單靠再生能源電力可能無法滿足需求。
| 市場範圍 | |
|---|---|
| 起始年份 | 2024 |
| 預測年份 | 2025-2034 |
| 起始值 | 17億美元 |
| 預測值 | 258億美元 |
| 複合年成長率 | 31.5% |
預計到2034年,現場太陽能發電領域將創造135億美元的產值,這反映了其在提供Power-to-X流程所需的再生電力方面的關鍵貢獻。這些再生能源支持碳中和燃料生產,並幫助各行各業實現永續發展目標。先進的控制系統和支援性政策框架推動了向離網再生能源發電的轉變,這與分散式電燃料營運無縫銜接。
乙醇市場在2024年佔據22%的市場佔有率,預計到2034年將以32%的複合年成長率成長。乙醇與現有燃料基礎設施的兼容性以及易於融入各種工業流程的特性,使其成為可靠且可擴展的替代品。隨著生產技術的不斷進步,生物基乙醇的發展勢頭強勁,各行各業都在尋求靈活的解決方案來滿足脫碳要求。生物基乙醇能夠與其他合成燃料無縫混合,這增強了其在工業領域的吸引力,有助於推動向永續能源的轉型。
2024年,美國工業電子燃料市場產值達2.354億美元,預計2034年將達到43億美元,這得益於聯邦扶持政策、清潔能源資助計畫以及再生能源技術日益普及的應用。美國將繼續利用多樣化的太陽能和風能資源,透過Power-to-X和其他新興途徑支持電子燃料生產。再加上燃料合成和碳捕獲技術的進步,這些努力正在鞏固美國在工業電子燃料轉型領域的全球領先地位。
eFuel Pacific、Climeworks、Electrochaea、Archer Daniels Midland、Ballard Power Systems、MAN Energy Solutions、INFRA Synthetic Fuels、保時捷、HIF Global、Clean Fuels Alliance America、Sunfire、Arc eFuels、Liquid Wind、LanzaJet、FuelCell Energy、NSunfire、Arc eFuels、Liquid Wind、LanzaJet、FuelCell Energy、N這些公司專注於擴大產能、投資再生能源設施,並建立策略聯盟以加速商業化進程。許多公司也利用碳捕獲技術,並建立整合供應鏈,以支援可擴展的清潔燃料分銷。
目錄
第1章:方法論與範圍
第2章:執行摘要
第3章:行業洞察
- 產業生態系統分析
- 川普政府關稅分析
- 對貿易的影響
- 貿易量中斷
- 報復措施
- 對產業的影響
- 供給側影響(原料)
- 主要材料價格波動
- 供應鏈重組
- 生產成本影響
- 需求面影響(售價)
- 價格傳導至終端市場
- 市佔率動態
- 消費者反應模式
- 供給側影響(原料)
- 受影響的主要公司
- 策略產業反應
- 供應鏈重組
- 定價和產品策略
- 政策參與
- 展望與未來考慮
- 對貿易的影響
- 監管格局
- 產業衝擊力
- 成長動力
- 產業陷阱與挑戰
- 成長潛力分析
- 波特的分析
- PESTEL分析
第4章:競爭格局
- 介紹
- 戰略儀表板
- 策略舉措
- 公司市佔率分析
- 競爭基準測試
- 創新與技術格局
第5章:市場規模及預測:按再生能源,2021 - 2034 年
- 主要趨勢
- 現場太陽能
- 風
第6章:市場規模及預測:依技術分類,2021 - 2034 年
- 主要趨勢
- 費托合成
- 增強型多普勒雷達系統
- 其他
第7章:市場規模及預測:依產品,2021 - 2034
- 主要趨勢
- 電子汽油
- 電動柴油
- 電子煤油
- 乙醇
- 電子甲醇
- 其他
第8章:市場規模及預測:按地區,2021 - 2034
- 主要趨勢
- 北美洲
- 美國
- 加拿大
- 歐洲
- 英國
- 德國
- 法國
- 荷蘭
- 西班牙
- 亞太地區
- 中國
- 印度
- 日本
- 韓國
- 澳洲
- 中東和非洲
- 沙烏地阿拉伯
- 阿拉伯聯合大公國
- 南非
- 拉丁美洲
- 巴西
- 阿根廷
第9章:公司簡介
- Archer Daniels Midland
- Arcadia eFuels
- Ballard Power Systems
- Ceres Power
- Clean Fuels Alliance America
- Climeworks
- Electrochaea
- eFuel Pacific
- ExxonMobil
- FuelCell Energy
- HIF Global
- INFRA Synthetic Fuels
- LanzaJet
- Liquid Wind
- MAN Energy Solutions
- Norsk e-Fuel
- Porsche
- Sunfire
The Global Industrial E-Fuel Market was valued at USD 1.7 billion in 2024 and is estimated to grow at a CAGR of 31.5% to reach USD 25.8 billion by 2034, driven by the global push toward decarbonization and the rising need for sustainable energy alternatives across industrial applications. As industries search for viable replacements for conventional fossil fuels, e-fuels have emerged as a compelling solution for sectors such as manufacturing, heavy transport, and aviation. The integration of advanced production technologies, coupled with improvements in efficiency and cost control, continues to enhance the viability of these synthetic fuels. Supportive government initiatives, clean energy incentives, and global emission reduction targets accelerate adoption.
Moreover, the heightened emphasis on integrating renewables with industrial operations encourages businesses to adopt long-term, carbon-neutral energy frameworks. Companies align their strategies with global sustainability targets, prioritizing low-emission fuels that reduce dependence on traditional fossil energy sources. The move toward stable and resilient energy supply chains is not only driven by environmental regulations but also by the economic advantages of localized, clean energy production. This trend unlocks new potential for e-fuels, especially in hard-to-decarbonize sectors where renewable electricity alone may not suffice.
| Market Scope | |
|---|---|
| Start Year | 2024 |
| Forecast Year | 2025-2034 |
| Start Value | $1.7 billion |
| Forecast Value | $25.8 billion |
| CAGR | 31.5% |
The on-site solar segment is projected to generate USD 13.5 billion by 2034, reflecting its critical contribution in providing the renewable electricity required for Power-to-X processes. These renewable energy sources support carbon-neutral fuel production and help industries meet sustainability goals. Advanced control systems and supportive policy frameworks fuel the shift toward off-grid renewable generation, which aligns seamlessly with decentralized e-fuel operations.
The ethanol segment held a 22% share in 2024 and is projected to grow at a CAGR of 32% through 2034. Its compatibility with current fuel infrastructure and ease of integration into various industrial processes have made ethanol a reliable and scalable alternative. With ongoing advances in production technologies, bio-based ethanol is gaining momentum as industries seek flexible solutions to meet decarbonization mandates. Its ability to blend seamlessly with other synthetic fuels enhances its appeal in industrial settings, transitioning toward sustainable energy.
United States Industrial E-Fuel Market generated USD 235.4 million in 2024 and is estimated to reach USD 4.3 billion by 2034, underpinned by supportive federal policies, clean energy funding programs, and increasing deployment of renewable technologies. The U.S. continues to leverage a diverse mix of solar and wind resources to support e-fuel production through Power-to-X and other emerging pathways. Coupled with advancements in fuel synthesis and carbon capture technologies, these efforts are helping to cement the U.S. as a global frontrunner in the industrial e-fuel transition.
Key players such as eFuel Pacific, Climeworks, Electrochaea, Archer Daniels Midland, Ballard Power Systems, MAN Energy Solutions, INFRA Synthetic Fuels, Porsche, HIF Global, Clean Fuels Alliance America, Sunfire, Arcadia eFuels, Liquid Wind, LanzaJet, FuelCell Energy, Norsk e-Fuel, ExxonMobil, and Ceres Power are strengthening their position through innovation, joint ventures, and sustainable technology development. These companies are focused on expanding production capacity, investing in renewable-powered facilities, and forming strategic alliances to accelerate commercialization. Many are also leveraging carbon capture technologies and creating integrated supply chains to support scalable, clean fuel distribution.
Table of Contents
Chapter 1 Methodology & Scope
- 1.1 Market definitions
- 1.2 Base estimates & calculations
- 1.3 Forecast calculation
- 1.4 Data sources
- 1.4.1 Primary
- 1.4.2 Secondary
- 1.4.2.1 Paid
- 1.4.2.2 Public
Chapter 2 Executive Summary
- 2.1 Industry synopsis, 2021 - 2034
Chapter 3 Industry Insights
- 3.1 Industry ecosystem analysis
- 3.2 Trump administration tariff analysis
- 3.2.1 Impact on trade
- 3.2.1.1 Trade volume disruptions
- 3.2.1.2 Retaliatory measures
- 3.2.2 Impact on the industry
- 3.2.2.1 Supply-side impact (raw materials)
- 3.2.2.1.1 Price volatility in key materials
- 3.2.2.1.2 Supply chain restructuring
- 3.2.2.1.3 Production cost implications
- 3.2.2.2 Demand-side impact (selling price)
- 3.2.2.2.1 Price transmission to end markets
- 3.2.2.2.2 Market share dynamics
- 3.2.2.2.3 Consumer response patterns
- 3.2.2.1 Supply-side impact (raw materials)
- 3.2.3 Key companies impacted
- 3.2.4 Strategic industry responses
- 3.2.4.1 Supply chain reconfiguration
- 3.2.4.2 Pricing and product strategies
- 3.2.4.3 Policy engagement
- 3.2.5 Outlook and future considerations
- 3.2.1 Impact on trade
- 3.3 Regulatory landscape
- 3.4 Industry impact forces
- 3.4.1 Growth drivers
- 3.4.2 Industry pitfalls & challenges
- 3.5 Growth potential analysis
- 3.6 Porter's Analysis
- 3.6.1 Bargaining power of suppliers
- 3.6.2 Bargaining power of buyers
- 3.6.3 Threat of new entrants
- 3.6.4 Threat of substitutes
- 3.7 PESTEL Analysis
Chapter 4 Competitive landscape, 2025
- 4.1 Introduction
- 4.2 Strategic dashboard
- 4.3 Strategic initiatives
- 4.4 Company market share analysis
- 4.5 Competitive benchmarking
- 4.6 Innovation & technology landscape
Chapter 5 Market Size and Forecast, By Renewable Source, 2021 - 2034 (USD Million)
- 5.1 Key trends
- 5.2 On-site solar
- 5.3 Wind
Chapter 6 Market Size and Forecast, By Technology, 2021 - 2034 (USD Million)
- 6.1 Key trends
- 6.2 Fischer-tropsch
- 6.3 eRWGS
- 6.4 Others
Chapter 7 Market Size and Forecast, By Product, 2021 - 2034 (USD Million)
- 7.1 Key trends
- 7.2 E-gasoline
- 7.3 E-diesel
- 7.4 E-kerosene
- 7.5 Ethanol
- 7.6 E-methanol
- 7.7 Others
Chapter 8 Market Size and Forecast, By Region, 2021 - 2034 (USD Million)
- 8.1 Key trends
- 8.2 North America
- 8.2.1 U.S.
- 8.2.2 Canada
- 8.3 Europe
- 8.3.1 UK
- 8.3.2 Germany
- 8.3.3 France
- 8.3.4 Netherlands
- 8.3.5 Spain
- 8.4 Asia Pacific
- 8.4.1 China
- 8.4.2 India
- 8.4.3 Japan
- 8.4.4 South Korea
- 8.4.5 Australia
- 8.5 Middle East & Africa
- 8.5.1 Saudi Arabia
- 8.5.2 UAE
- 8.5.3 South Africa
- 8.6 Latin America
- 8.6.1 Brazil
- 8.6.2 Argentina
Chapter 9 Company Profiles
- 9.1 Archer Daniels Midland
- 9.2 Arcadia eFuels
- 9.3 Ballard Power Systems
- 9.4 Ceres Power
- 9.5 Clean Fuels Alliance America
- 9.6 Climeworks
- 9.7 Electrochaea
- 9.8 eFuel Pacific
- 9.9 ExxonMobil
- 9.10 FuelCell Energy
- 9.11 HIF Global
- 9.12 INFRA Synthetic Fuels
- 9.13 LanzaJet
- 9.14 Liquid Wind
- 9.15 MAN Energy Solutions
- 9.16 Norsk e-Fuel
- 9.17 Porsche
- 9.18 Sunfire


