


 |
市場調查報告書
商品編碼
1750567
壓力表市場機會、成長動力、產業趨勢分析及 2025 - 2034 年預測Pressure Gauges Market Opportunity, Growth Drivers, Industry Trend Analysis, and Forecast 2025 - 2034 |
||||||
2024年,全球壓力表市場規模達14.8億美元,預計到2034年將以3.8%的複合年成長率成長,達到21.2億美元。壓力測量設備需求的不斷成長,很大程度上得益於石油天然氣、化學生產、發電和汽車製造等工業領域的快速發展。這些產業依賴對設備和系統內壓力進行持續、準確的監測,以確保運作安全、高效運作和合規性。隨著各行各業不斷推動自動化,對可靠、整合的壓力監測解決方案的需求也變得更加關鍵。支撐這些產業的技術基礎設施正在快速發展,越來越依賴包括壓力表在內的自動化工具來維護流程完整性並降低設備故障相關的風險。
製造設施、煉油廠和其他工業環境越來越重視營運效率和機械保護。壓力表在維持這些標準方面發揮關鍵作用,它可以防止過壓,避免造成嚴重的停機或代價高昂的損壞。在新興經濟體,尤其是亞太和拉丁美洲,日益成長的工業活動進一步加劇了對壓力表的需求。工業基礎不斷擴大的國家正成為重型機械和煉油廠營運的主要消費國,這推動了對先進壓力監測解決方案的需求相應成長。
| 市場範圍 | |
|---|---|
| 起始年份 | 2024 |
| 預測年份 | 2025-2034 |
| 起始值 | 14.8億美元 |
| 預測值 | 21.2億美元 |
| 複合年成長率 | 3.8% |
隨著工業 4.0 的推進,智慧技術的日益融合,壓力表市場也發生了翻天覆地的變化。如今,支援物聯網的壓力表具備即時資料追蹤、預測性維護和基於分析的效能洞察等功能。這些設備正在快速普及,尤其是在注重準確性和流程最佳化的行業。智慧壓力表能夠提高生產力、減少停機時間,並提供遠端自動化監控,因此在許多需要高效能監控工具的行業中,它已成為不可或缺的必需品。
依技術分類,市場分為波登管壓力表、隔膜壓力表、膜盒壓力表、絕對壓力表、壓力計以及其他類型,如波紋管壓力表、壓力計和差壓表。 2024年,波登管壓力表細分市場以約5.2億美元的收入引領市場,預計在預測期內的複合年成長率約為4%。波登管壓力表因其堅固的設計和承受極端工作條件的能力而持續受到青睞。其機械結構使其在惡劣環境下也能維持可靠的性能,適用於廣泛的工業應用。這些壓力表因其使用壽命長、維護成本低以及在電子壓力表可能失效的嚴苛條件下有效運作的能力而備受青睞。
根據產品類型,全球市場分為類比壓力表和數位壓力表。模擬壓力表(包括波登管式和隔膜式)在2024年佔據約61.4%的市場佔有率,預計到2034年複合年成長率將達到3.5%。儘管數位壓力表因其精確度和與智慧系統的兼容性而日益受到青睞,複合年成長率達到4.1%,但模擬壓力表憑藉其機械可靠性、成本效益以及在需要大規模部署且無需額外電子元件成本的行業中的廣泛應用,仍將佔據主導地位。其簡潔的設計和耐用的特性使其成為注重經濟性和營運效率的行業的理想選擇。
美國引領北美壓力表市場,2024年其估值達3.1億美元,預計2025年至2034年的複合年成長率將超過3.9%。美國強大的工業基礎和持續升級老化基礎設施的需求是推動這一成長的主要因素。壓力測量系統對於能源、製造、水處理和其他關鍵產業的應用仍然至關重要。機械壓力表因其可靠的性能和成本優勢而繼續廣泛應用,尤其是在各行各業尋求符合嚴格安全和性能標準的可靠解決方案的情況下。
壓力表市場仍然高度分散,眾多參與者提供種類繁多的產品。在成本敏感的地區,價格競爭特別激烈,對利潤率造成下行壓力。製造商正大力投資研發,以打造滿足不斷變化的工業應用需求的下一代壓力表。各公司也專注於產品創新和地理擴張,以期在新興市場中佔據更大的佔有率。在這種競爭格局下,快速適應不斷變化的市場動態並提供差異化解決方案的能力仍然是企業成長的關鍵因素。
目錄
第1章:方法論與範圍
第2章:執行摘要
第3章:行業洞察
- 產業生態系統分析
- 影響價值鏈的因素。
- 利潤率分析。
- 中斷
- 未來展望
- 製造商
- 經銷商
- 川普政府關稅分析
- 對貿易的影響
- 貿易量中斷
- 報復措施
- 對產業的影響
- 供給側影響(原料)
- 主要材料價格波動
- 供應鏈重組
- 生產成本影響
- 需求面影響(售價)
- 價格傳導至終端市場
- 市佔率動態
- 消費者反應模式
- 受影響的主要公司
- 策略產業反應
- 供應鏈重組
- 定價和產品策略
- 政策參與
- 展望與未來考慮
- 對貿易的影響
- 供應商格局
- 利潤率分析。
- 重要新聞和舉措
- 監管格局
- 衝擊力
- 成長動力
- 工業化和製造業成長
- 工業應用對自動化和物聯網的需求不斷成長
- 壓力感測技術的技術進步
- 產業陷阱與挑戰
- 高階車型的初始成本高
- 監管挑戰
- 成長動力
- 成長潛力分析
- 波特的分析
- PESTEL分析
第4章:競爭格局
- 介紹
- 公司市佔率分析
- 競爭定位矩陣
- 戰略展望矩陣
第5章:市場估計與預測:依產品類型,2021-2034
- 主要趨勢
- 模擬壓力表
- 數位壓力表
第6章:市場估計與預測:依技術,2021-2034 年
- 主要趨勢
- 波登管壓力表
- 隔膜壓力表
- 膜盒壓力表
- 絕對壓力表
- 壓力計壓力表
- 其他(波紋管、壓力計、差壓計)
第7章:市場估計與預測:依材料,2021-2034
- 主要趨勢
- 不銹鋼
- 黃銅
- 鋁
- 塑膠
- 其他(鋼、銅、青銅等)
第8章:市場估計與預測:依最終用途,2021-2034
- 主要趨勢
- 化工和石化
- 石油和天然氣
- 能源與電力
- 製藥
- 水和廢水處理
- 其他(航太、汽車等)
第9章:市場估計與預測:按配銷通路,2021-2034
- 主要趨勢
- 線上
- 離線
第10章:市場估計與預測:按地區,2021-2034
- 主要趨勢
- 北美洲
- 美國
- 加拿大
- 歐洲
- 英國
- 德國
- 法國
- 義大利
- 西班牙
- 俄羅斯
- 亞太地區
- 中國
- 印度
- 日本
- 韓國
- 澳洲
- 印尼
- 馬來西亞
- 拉丁美洲
- 巴西
- 墨西哥
- MEA
- 阿拉伯聯合大公國
- 沙烏地阿拉伯
- 南非
第 11 章:公司簡介
- Ametek
- Badotherm
- Circor
- Dwyer
- Emerson
- Fluke Corporation
- Honeywell International
- Kobold Instruments
- Newbow
- Omega Engineering
- QED Aerospace
- Wika Instruments
- Winters Instruments
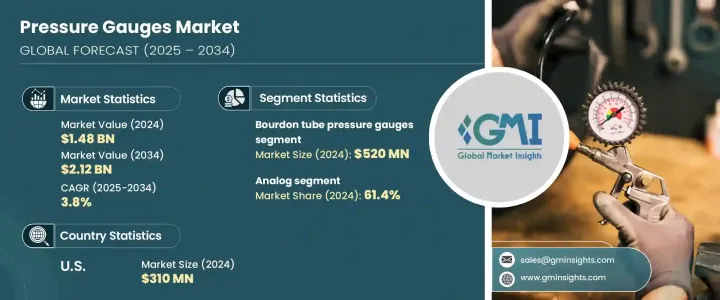
The Global Pressure Gauges Market was valued at USD 1.48 billion in 2024 and is estimated to grow at a CAGR of 3.8% to reach USD 2.12 billion by 2034. The growing demand for pressure measurement devices is largely driven by the accelerating development in industrial sectors such as oil and gas, chemical production, power generation, and automotive manufacturing. These sectors rely on consistent and accurate monitoring of pressure within equipment and systems to ensure operational safety, efficiency, and regulatory compliance. As industries continue to automate their operations, the need for reliable and integrated pressure monitoring solutions becomes even more critical. The technological infrastructure supporting these sectors is evolving rapidly, increasing reliance on automation tools, including pressure gauges, to maintain process integrity and reduce risks associated with equipment failure.
Manufacturing facilities, refineries, and other industrial environments are placing heightened emphasis on operational efficiency and machinery protection. Pressure gauges play a pivotal role in maintaining these standards by preventing over-pressurization, which can lead to significant downtime or costly damage. In emerging economies, especially in Asia-Pacific and Latin America, the demand is further intensified by the growing industrial activity. Nations with expanding industrial bases are turning into major consumers of heavy machinery and refinery operations, driving a corresponding increase in the need for advanced pressure monitoring solutions.
| Market Scope | |
|---|---|
| Start Year | 2024 |
| Forecast Year | 2025-2034 |
| Start Value | $1.48 Billion |
| Forecast Value | $2.12 Billion |
| CAGR | 3.8% |
The advancement of Industry 4.0 has transformed the pressure gauges market with the growing integration of smart technologies. Pressure gauges that are IoT-enabled now offer features such as real-time data tracking, predictive maintenance, and analytics-based performance insights. These devices are being adopted at a rapid pace, particularly in sectors where accuracy and process optimization are essential. With capabilities that enhance productivity, reduce downtime, and offer automated monitoring from remote locations, smart pressure gauges are becoming indispensable across a broad range of industries that demand high-performance monitoring tools.
By technology, the market is classified into bourdon tube, diaphragm, capsule, absolute, piezometer, and other types such as bellows, manometers, and differential pressure gauges. In 2024, the bourdon tube pressure gauges segment led the market with revenue of approximately USD 520 million and is projected to grow at a CAGR of around 4% during the forecast period. Bourdon tube gauges continue to be favored due to their robust design and ability to withstand extreme operational conditions. Their mechanical construction allows for reliable performance in harsh environments, making them suitable for a wide range of industrial applications. These gauges are valued for their longevity, low maintenance costs, and the ability to function effectively in demanding conditions where electronic alternatives may falter.
Based on product type, the global market is divided into analog and digital pressure gauges. Analog gauges, which include bourdon tube and diaphragm types, held around 61.4% of the market share in 2024 and are expected to register a CAGR of 3.5% through 2034. Although digital gauges are gaining traction due to their precision and compatibility with smart systems, growing at a CAGR of 4.1%, analog gauges continue to dominate because of their mechanical reliability, cost-effectiveness, and widespread application in industries that require large-scale deployment without the added cost of electronic components. Their simple design and durable nature make them ideal for industries focused on affordability and operational efficiency.
The United States led the North American pressure gauges market, reaching a valuation of USD 310 million in 2024 and forecasted to grow at a CAGR of over 3.9% from 2025 to 2034. The country's strong industrial base and the ongoing need to upgrade aging infrastructure are major factors contributing to this growth. Pressure measurement systems remain critical for applications across energy, manufacturing, water treatment, and other key sectors. Mechanical pressure gauges continue to be widely used due to their dependable performance and cost advantages, particularly as industries seek reliable solutions that meet strict safety and performance standards.
The pressure gauges market remains highly fragmented, with numerous players offering a wide variety of products. In cost-sensitive regions, price-based competition is especially intense, placing downward pressure on profit margins. Manufacturers are responding by investing heavily in R&D to create next-generation pressure gauges tailored to the evolving requirements of industrial applications. Companies are also focusing on product innovation and geographic expansion to capture a larger share of emerging markets. The ability to adapt quickly to changing market dynamics and deliver differentiated solutions remains a key factor for growth in this competitive landscape.
Table of Contents
Chapter 1 Methodology & Scope
- 1.1 Market scope & definitions
- 1.2 Base estimates & calculations
- 1.3 Forecast calculations.
- 1.4 Data sources
- 1.4.1 Primary
- 1.4.2 Secondary
- 1.4.2.1 Paid sources
- 1.4.2.2 Public sources
Chapter 2 Executive Summary
- 2.1 Industry synopsis, 2021-2034
Chapter 3 Industry Insights
- 3.1 Industry ecosystem analysis
- 3.1.1 Factor affecting the value chain.
- 3.1.2 Profit margin analysis.
- 3.1.3 Disruptions
- 3.1.4 Future outlook
- 3.1.5 Manufacturers
- 3.1.6 Distributors
- 3.2 Trump administration tariffs analysis
- 3.2.1 Impact on trade
- 3.2.1.1 Trade volume disruptions
- 3.2.1.2 Retaliatory measures
- 3.2.2 Impact on the industry
- 3.2.2.1 Supply-side impact (raw materials)
- 3.2.2.2 Price volatility in key materials
- 3.2.2.3 Supply chain restructuring
- 3.2.2.4 Production cost implications
- 3.2.2.5 Demand-side impact (selling price)
- 3.2.2.6 Price transmission to end markets
- 3.2.2.7 Market share dynamics
- 3.2.2.8 Consumer response patterns
- 3.2.3 Key companies impacted
- 3.2.4 Strategic industry responses
- 3.2.4.1 Supply chain reconfiguration
- 3.2.4.2 Pricing and product strategies
- 3.2.4.3 Policy engagement
- 3.2.5 Outlook and future considerations
- 3.2.1 Impact on trade
- 3.3 Supplier landscape
- 3.4 Profit margin analysis.
- 3.5 Key news & initiatives
- 3.6 Regulatory landscape
- 3.7 Impact forces
- 3.7.1 Growth drivers
- 3.7.1.1 Industrialization and manufacturing growth
- 3.7.1.2 Rising demand for automation and IoT in industrial applications
- 3.7.1.3 Technological advancements in pressure sensing technology
- 3.7.2 Industry pitfalls & challenges
- 3.7.2.1 High initial cost of premium models
- 3.7.2.2 Regulatory challenges
- 3.7.1 Growth drivers
- 3.8 Growth potential analysis
- 3.9 Porter's analysis
- 3.10 PESTEL analysis
Chapter 4 Competitive Landscape, 2024
- 4.1 Introduction
- 4.2 Company market share analysis
- 4.3 Competitive positioning matrix
- 4.4 Strategic outlook matrix
Chapter 5 Market Estimates & Forecast, By Product Type, 2021-2034 (USD Billion) (Thousand Units)
- 5.1 Key trends
- 5.2 Analog pressure gauges
- 5.3 Digital pressure gauges
Chapter 6 Market Estimates & Forecast, By Technology, 2021-2034 (USD Billion) (Thousand Units)
- 6.1 Key trends
- 6.2 Bourdon tube pressure gauges
- 6.3 Diaphragm pressure gauges
- 6.4 Capsule pressure gauges
- 6.5 Absolute pressure gauges
- 6.6 Piezometer pressure gauge
- 6.7 Others (Bellows, manometer, differential)
Chapter 7 Market Estimates & Forecast, By Material, 2021-2034 (USD Billion) (Thousand Units)
- 7.1 Key trends
- 7.2 Stainless steel
- 7.3 Brass
- 7.4 Aluminum
- 7.5 Plastic
- 7.6 Others (steel, copper, bronze etc.)
Chapter 8 Market Estimates & Forecast, By End Use, 2021-2034 (USD Billion) (Thousand Units)
- 8.1 Key trends
- 8.2 Chemical & petrochemical
- 8.3 Oil & gas
- 8.4 Energy & power
- 8.5 Pharmaceutical
- 8.6 Water & wastewater treatment
- 8.7 Others (aerospace, automotive, etc.)
Chapter 9 Market Estimates & Forecast, By Distribution Channel, 2021-2034 (USD Billion) (Thousand Units)
- 9.1 Key trends
- 9.2 Online
- 9.3 Offline
Chapter 10 Market Estimates & Forecast, By Region, 2021-2034 (USD Billion) (Thousand Units)
- 10.1 Key trends
- 10.2 North America
- 10.2.1 U.S.
- 10.2.2 Canada
- 10.3 Europe
- 10.3.1 UK
- 10.3.2 Germany
- 10.3.3 France
- 10.3.4 Italy
- 10.3.5 Spain
- 10.3.6 Russia
- 10.4 Asia Pacific
- 10.4.1 China
- 10.4.2 India
- 10.4.3 Japan
- 10.4.4 South Korea
- 10.4.5 Australia
- 10.4.6 Indonesia
- 10.4.7 Malaysia
- 10.5 Latin America
- 10.5.1 Brazil
- 10.5.2 Mexico
- 10.6 MEA
- 10.6.1 UAE
- 10.6.2 Saudi Arabia
- 10.6.3 South Africa
Chapter 11 Company Profiles
- 11.1 Ametek
- 11.2 Badotherm
- 11.3 Circor
- 11.4 Dwyer
- 11.5 Emerson
- 11.6 Fluke Corporation
- 11.7 Honeywell International
- 11.8 Kobold Instruments
- 11.9 Newbow
- 11.10 Omega Engineering
- 11.11 QED Aerospace
- 11.12 Wika Instruments
- 11.13 Winters Instruments


