


 |
市場調查報告書
商品編碼
1750536
智慧瓦斯表市場機會、成長動力、產業趨勢分析及 2025 - 2034 年預測Smart Gas Meters Market Opportunity, Growth Drivers, Industry Trend Analysis, and Forecast 2025 - 2034 |
||||||
2024年,全球智慧瓦斯表市場規模達66億美元,預計到2034年將以16.9%的複合年成長率成長,達到315億美元。這一成長軌跡主要源自於對精準計費、更完善的能耗監控以及即時監測損耗能力日益成長的需求。隨著公用事業供應商不斷提升營運效率,智慧計量系統正獲得顯著發展,尤其是在住宅和商業用戶中。消費者能源使用意識的不斷提升,以及先進技術的融合,進一步加速了這些計量表在各領域的應用。各地區政府也在推動公用事業基礎設施的數位化,這為公共和私營部門的利害關係人投資智慧燃氣表系統提供了強大的動力。這些計量表使用戶能夠即時監控燃氣使用情況,最佳化能源消耗,並最終降低每月帳單,從而為消費者和供應商帶來顯著的價值提升。此外,朝向更永續、更環保的能源消費模式轉變,也推動各行各業採用能夠增強能源問責制和透明度的系統。
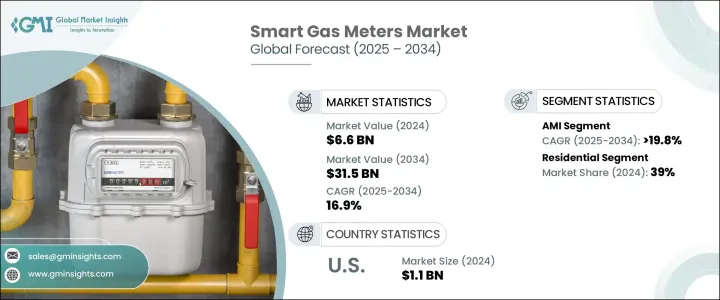
根據技術,市場可分為先進計量基礎設施 (AMI) 和自動抄表 (AMR)。其中,AMI 領域有望實現顯著成長,預計預測期內複合年成長率將超過 19.8%。這一成長得益於智慧基礎設施的廣泛部署,這些基礎設施是國家和地區現代化計劃的一部分。 AMI 解決方案在公用事業公司和最終用戶之間提供雙向通訊,從而實現對天然氣使用情況的更動態控制和即時資料收集。這些功能不僅支援更快解決問題,還有助於改善能源管理,並為公用事業提供者節省長期成本。隨著公用事業公司持續投資數位轉型,AMI 預計將在未來幾年佔據科技領域的主導地位。
| 市場範圍 | |
|---|---|
| 起始年份 | 2024 |
| 預測年份 | 2025-2034 |
| 起始值 | 66億美元 |
| 預測值 | 315億美元 |
| 複合年成長率 | 16.9% |
從應用角度來看,智慧瓦斯表市場細分為商業、住宅和公用事業領域。 2024年,住宅領域約佔全球市場佔有率的39%,領先其他所有領域。消費者越來越希望即時了解能源使用情況,而智慧燃氣表正是實現這一目標所需的工具。隨著家庭致力於減少消耗並提高能源效率,對智慧燃氣表解決方案的需求持續成長。支持性監管政策和激勵措施,以及向清潔能源轉型的趨勢,也大大促進了該領域的擴張。智慧瓦斯表的便利性和成本效益使其在住宅領域尤其具有吸引力,並推動了其廣泛應用。
美國已成為全球市場的重要一環,其智慧瓦斯表市場規模預計在2022年達到8億美元,2023年將達到9億美元,2024年將達到11億美元。美國正經歷計量系統技術的快速進步,以及日益成長的清潔能源實踐。這些發展促使公用事業供應商使用更聰明的替代方案升級現有基礎設施。美國智慧瓦斯表的普及既受到環保目標的推動,也受到提高電網可靠性和效率的需求的推動。公用事業公司和消費者對這些燃氣表的接受度日益提高,預計將在可預見的未來保持美國市場強勁成長勢頭。
智慧瓦斯表市場的競爭格局較為集中,五大巨頭合計佔約35%的市場。這些核心公司正致力於提升製造能力、增強技術產品,並建立廣泛的全球供應鏈,以增強其市場影響力。他們正投入大量資金進行研發,以推出符合全球永續發展目標的創新計量技術。與能源供應商和科技公司進行策略合作正成為這些市場領導者獲得大規模合約的熱門途徑。此外,他們也高度重視本地生產和卓越的售後服務,這有助於加快部署速度並提高客戶滿意度。
目錄
第1章:方法論與範圍
第2章:執行摘要
第3章:行業洞察
- 產業生態系統
- 川普政府關稅分析
- 對貿易的影響
- 貿易量中斷
- 報復措施
- 對產業的影響
- 供應方影響(原料)
- 主要材料價格波動
- 供應鏈重組
- 生產成本影響
- 需求面影響(售價)
- 價格傳導至終端市場
- 市佔率動態
- 消費者反應模式
- 供應方影響(原料)
- 受影響的主要公司
- 策略產業反應
- 供應鏈重組
- 定價和產品策略
- 政策參與
- 展望與未來考慮
- 對貿易的影響
- 監管格局
- 產業衝擊力
- 成長動力
- 產業陷阱與挑戰
- 成長潛力分析
- 波特的分析
- PESTEL分析
第4章:競爭格局
- 介紹
- 公司市佔率
- 戰略儀表板
- 策略舉措
- 競爭基準測試
- 創新與永續發展格局
第5章:市場規模及預測:依技術分類,2021 - 2034 年
- 主要趨勢
- 急性心肌梗塞
- 抗腫瘤藥物
第6章:市場規模及預測:依應用,2021 - 2034
- 主要趨勢
- 住宅
- 商業的
- 公用事業
第7章:市場規模及預測:依地區,2021 - 2034
- 主要趨勢
- 北美洲
- 美國
- 加拿大
- 歐洲
- 德國
- 英國
- 法國
- 瑞典
- 義大利
- 亞太地區
- 中國
- 日本
- 印度
- 韓國
- 澳洲
- 中東和非洲
- 阿拉伯聯合大公國
- 沙烏地阿拉伯
- 南非
- 埃及
- 拉丁美洲
- 巴西
- 墨西哥
- 阿根廷
第8章:公司簡介
- Aclara Technologies
- Apator
- Azbil Kimmon
- Chint Group
- Honeywell International
- Itron
- Landis+Gyr
- Neptune Technology Group
- Osaki Electric
- Raychem RPG
- Schneider Electric
- Sensus
- Wasion Group
- Zenner International
The Global Smart Gas Meters Market was valued at USD 6.6 billion in 2024 and is estimated to grow at a CAGR of 16.9% to reach USD 31.5 billion by 2034. This growth trajectory is primarily driven by increasing demand for accurate billing, better consumption monitoring, and the ability to detect losses in real time. As utility providers push for operational efficiency, smart metering systems are gaining significant traction, especially among residential and commercial users. Rising consumer awareness about energy usage, along with the integration of advanced technologies, is further accelerating the adoption of these meters across diverse sectors. Governments across various regions are also promoting digitalization in utility infrastructure, providing a strong incentive for both private and public stakeholders to invest in intelligent gas metering systems. These meters enable users to monitor real-time gas usage, optimize energy consumption, and ultimately reduce monthly bills, which adds considerable value to consumers and providers alike. Additionally, the shift toward more sustainable and environmentally conscious energy consumption is pushing industries to adopt systems that enhance energy accountability and transparency.
The market is categorized by technology into Advanced Metering Infrastructure (AMI) and Automatic Meter Reading (AMR). Among these, the AMI segment is poised for remarkable growth, projected to register a CAGR exceeding 19.8% during the forecast period. This growth is attributed to widespread rollouts of smart infrastructure as part of broader national and regional modernization initiatives. AMI solutions offer two-way communication between utilities and end-users, enabling more dynamic control over gas usage and real-time data collection. These capabilities not only support faster issue resolution but also contribute to improved energy management and long-term cost savings for utility providers. As utilities continue investing in digital transformation, AMI is expected to dominate the technology landscape in the coming years.
| Market Scope | |
|---|---|
| Start Year | 2024 |
| Forecast Year | 2025-2034 |
| Start Value | $6.6 Billion |
| Forecast Value | $31.5 Billion |
| CAGR | 16.9% |
In terms of application, the smart gas meters market is segmented into commercial, residential, and utility sectors. The residential segment accounted for approximately 39% of the global market share in 2024, leading all other segments. Consumers are increasingly seeking real-time visibility into their energy usage, and smart meters provide the tools needed to achieve that. As households aim to reduce consumption and become more energy-efficient, the demand for intelligent gas metering solutions continues to climb. Supportive regulatory policies and incentives, along with the trend of switching to cleaner energy sources, are also contributing significantly to the expansion of this segment. The convenience and cost-effectiveness offered by smart meters make them particularly appealing in the residential space, driving widespread adoption.
The United States has emerged as a key market in the global landscape, with its smart gas meters market valued at USD 800 million in 2022, USD 900 million in 2023, and reaching USD 1.1 billion in 2024. The country is witnessing rapid technological advancements in metering systems and a growing push toward cleaner energy practices. These developments are prompting utility providers to upgrade existing infrastructure with smarter alternatives. The adoption of smart meters in the US is being fueled by both environmental goals and the need to enhance grid reliability and efficiency. The growing acceptance of these meters among utility firms and consumers alike is expected to keep the US market on a strong upward path in the foreseeable future.
The competitive landscape of the smart gas meters market is moderately concentrated, with five major players collectively holding about 35% of the total market share. These key companies are focusing on expanding their manufacturing capabilities, enhancing their technological offerings, and building extensive global supply chains to strengthen their market presence. Significant investments are being funneled into research and development to introduce innovative metering technologies that align with global sustainability goals. Strategic collaborations with energy providers and tech firms are becoming a popular route for these market leaders to secure large-scale contracts. Additionally, there is a strong emphasis on local production and superior after-sales services, which help speed up deployment and improve customer satisfaction.
Table of Contents
Chapter 1 Methodology & Scope
- 1.1 Research design
- 1.2 Base estimates & calculations
- 1.3 Forecast calculation
- 1.4 Primary research & validation
- 1.4.1 Primary sources
- 1.4.2 Data mining sources
- 1.5 Market definitions
Chapter 2 Executive Summary
- 2.1 Industry synopsis, 2021 - 2034
Chapter 3 Industry Insights
- 3.1 Industry ecosystem
- 3.2 Trump administration tariff analysis
- 3.2.1 Impact on trade
- 3.2.1.1 Trade volume disruptions
- 3.2.1.2 Retaliatory measures
- 3.2.2 Impact on the industry
- 3.2.2.1 Supply-side impact (raw materials)
- 3.2.2.1.1 Price volatility in key materials
- 3.2.2.1.2 Supply chain restructuring
- 3.2.2.1.3 Production cost implications
- 3.2.2.2 Demand-side impact (selling price)
- 3.2.2.2.1 Price transmission to end markets
- 3.2.2.2.2 Market share dynamics
- 3.2.2.2.3 Consumer response patterns
- 3.2.2.1 Supply-side impact (raw materials)
- 3.2.3 Key companies impacted
- 3.2.4 Strategic industry responses
- 3.2.4.1 Supply chain reconfiguration
- 3.2.4.2 Pricing and product strategies
- 3.2.4.3 Policy engagement
- 3.2.5 Outlook and future considerations
- 3.2.1 Impact on trade
- 3.3 Regulatory landscape
- 3.4 Industry impact forces
- 3.4.1 Growth drivers
- 3.4.2 Industry pitfalls & challenges
- 3.5 Growth potential analysis
- 3.6 Porter's analysis
- 3.6.1 Bargaining power of suppliers
- 3.6.2 Bargaining power of buyers
- 3.6.3 Threat of new entrants
- 3.6.4 Threat of substitutes
- 3.7 PESTEL analysis
Chapter 4 Competitive landscape, 2024
- 4.1 Introduction
- 4.2 Company market share
- 4.3 Strategic dashboard
- 4.4 Strategic initiative
- 4.5 Competitive benchmarking
- 4.6 Innovation & sustainability landscape
Chapter 5 Market Size and Forecast, By Technology, 2021 - 2034 (‘000 Units, USD Million)
- 5.1 Key trends
- 5.2 AMI
- 5.3 AMR
Chapter 6 Market Size and Forecast, By Application, 2021 - 2034 (‘000 Units, USD Million)
- 6.1 Key trends
- 6.2 Residential
- 6.3 Commercial
- 6.4 Utility
Chapter 7 Market Size and Forecast, By Region, 2021 - 2034 (‘000 Units, USD Million)
- 7.1 Key trends
- 7.2 North America
- 7.2.1 U.S.
- 7.2.2 Canada
- 7.3 Europe
- 7.3.1 Germany
- 7.3.2 UK
- 7.3.3 France
- 7.3.4 Sweden
- 7.3.5 Italy
- 7.4 Asia Pacific
- 7.4.1 China
- 7.4.2 Japan
- 7.4.3 India
- 7.4.4 South Korea
- 7.4.5 Australia
- 7.5 Middle East & Africa
- 7.5.1 UAE
- 7.5.2 Saudi Arabia
- 7.5.3 South Africa
- 7.5.4 Egypt
- 7.6 Latin America
- 7.6.1 Brazil
- 7.6.2 Mexico
- 7.6.3 Argentina
Chapter 8 Company Profiles
- 8.1 Aclara Technologies
- 8.2 Apator
- 8.3 Azbil Kimmon
- 8.4 Chint Group
- 8.5 Honeywell International
- 8.6 Itron
- 8.7 Landis+Gyr
- 8.8 Neptune Technology Group
- 8.9 Osaki Electric
- 8.10 Raychem RPG
- 8.11 Schneider Electric
- 8.12 Sensus
- 8.13 Wasion Group
- 8.14 Zenner International
 智慧燃氣表市場報告:按組件、類型、應用和地區分類(2026-2034 年)
 智慧燃氣表市場:2026-2032年全球市場預測(按表現型、瓦斯類型、組件、通訊方式、應用、安裝方式、最終用戶和通路分類)
 2026年全球智慧燃氣表市場報告日本智慧瓦斯表市場報告(按組件(硬體、軟體)、類型(自動計量基礎設施 (AMI)、自動抄表 (AMR))、最終用途(住宅、商業、工業)和地區分類,2026-2034 年)
 全球智慧瓦斯表市場
 全球智慧燃氣表市場(按技術、類型、組件、最終用戶和地區分類)- 預測至 2030 年
 智慧燃氣表市場規模、佔有率和成長分析(按組件、類型、技術、最終用戶和地區)- 2025-2032 年產業預測
 智慧燃氣表:市場佔有率分析、產業趨勢與統計、成長預測(2025-2030 年)
 智慧燃氣表市場規模、佔有率、趨勢分析報告:按組件、按類型、按技術、按最終用途、按地區、細分市場預測,2024-2030 年