


 |
市場調查報告書
商品編碼
1750434
生物琥珀酸市場機會、成長動力、產業趨勢分析及 2025 - 2034 年預測Bio-Succinic Acid Market Opportunity, Growth Drivers, Industry Trend Analysis, and Forecast 2025 - 2034 |
||||||
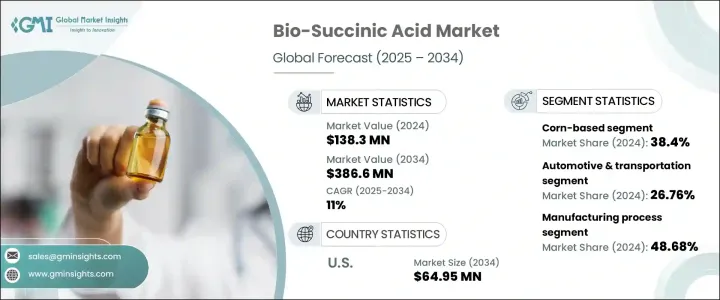
2024年,全球生物琥珀酸市場規模達1.383億美元,預計到2034年將以11%的複合年成長率成長,達到3.866億美元,這得益於消費者對永續生物基化學品(而非傳統石油基產品)日益成長的需求。隨著各行各業和政府部門對環保解決方案的重視,生物琥珀酸作為綠色產品備受青睞,為各種應用領域提供了可再生和可生物分解的選擇。人們對永續性的日益重視,加上對環境影響的監管愈發嚴格,使得生物琥珀酸在化學產業中扮演著重要角色。
各行各業日益轉向永續材料,顯著提升了對生物琥珀酸的需求,因為它是生產生物基聚合物的關鍵原料。在這些聚合物中,聚丁二酸丁二醇酯 (PBS) 因其生物分解性、多功能性以及在眾多應用中取代石油基塑膠的潛力而脫穎而出。 PBS 需求的激增推動了對生物琥珀酸的需求,因為它可用於生產 PBS 和其他環保聚合物,從而進一步擴大了生物琥珀酸的市場。
| 市場範圍 | |
|---|---|
| 起始年份 | 2024 |
| 預測年份 | 2025-2034 |
| 起始值 | 1.383億美元 |
| 預測值 | 3.866億美元 |
| 複合年成長率 | 11% |
2024年,玉米生產的生物琥珀酸市佔率為38.4%。玉米富含碳水化合物,特別適合透過發酵過程生產生物琥珀酸。其易得性、成本效益以及穩定可靠的供應能力使其成為大規模生產的首選原料。玉米基生物琥珀酸日益普及,得益於其成熟的供應鏈和發酵技術的可擴展性。隨著生物琥珀酸需求的成長,替代原料也正在被探索。
發酵製程因其成本效益高且依賴再生原料,佔了49%的市場。這種方法可以實現規模化生產,並減少對環境的影響,使其成為大規模生產的首選。然而,一些新方法正在興起,例如從葡萄糖和糖直接合成,這些方法在受控條件下可以獲得更高的產量。化學催化也越來越受到關注,儘管其較高的成本和環境問題限制了其廣泛應用。結合發酵和催化的混合製程正在被探索,作為一種在平衡成本的同時提高生產效率和永續性的解決方案。
2024年,美國生物琥珀酸市場產值達2,238萬美元,預計到2034年將達到6,495萬美元,這得益於政府對生物基化學品的激勵措施以及工業界對再生資源日益成長的需求。美國是生物琥珀酸的主要生產國,得益於其先進的製造業基礎設施和政府對綠色技術的大力支持。
全球生物琥珀酸市場的主要參與者包括Corbion NV、川崎化成化學、巴斯夫、三井物產和Reverdia。這些公司正致力於擴大產品組合、提高生產效率並探索新的原料以提升市場佔有率。例如,Corbion NV和Reverdia一直在利用先進的發酵製程來最佳化產量並降低成本,而三井物產則正在探索利用農業廢棄物等可再生原料進行生產。透過採取這些策略,這些公司正積極利用行業日益成長的生物琥珀酸需求,以應對行業向更永續的解決方案邁進。
目錄
第1章:方法論與範圍
第2章:執行摘要
第3章:行業洞察
- 產業生態系統分析
- 影響價值鏈的因素
- 利潤率分析
- 中斷
- 未來展望
- 製造商
- 經銷商
- 川普政府關稅
- 對貿易的影響
- 貿易量中斷
- 報復措施
- 對產業的影響
- 供給側影響(原料)
- 主要材料價格波動
- 供應鏈重組
- 生產成本影響
- 需求面影響(售價)
- 價格傳導至終端市場
- 市佔率動態
- 消費者反應模式
- 受影響的主要公司
- 策略產業回應
- 供應鏈重構
- 定價和產品策略
- 政策參與
- 展望與未來考慮
- 對貿易的影響
- 貿易統計(HS編碼)
- 主要出口國
- 主要進口國
註:以上貿易統計僅針對重點國家。
- 利潤率分析
- 監管格局
- 衝擊力
- 成長動力
- 對生物基化學品和永續替代品的需求不斷成長
- 消費者對永續和綠色產品的偏好強烈
- 政府法規推廣環保和可生物分解產品
- 產業陷阱與挑戰
- 與石油基替代品相比生產成本較高
- 原料供應有限,影響可擴展性
- 成長動力
- 成長潛力分析
- 波特的分析
- PESTEL分析
第4章:競爭格局
- 介紹
- 公司市佔率分析
- 競爭定位矩陣
- 戰略展望矩陣
第5章:市場估計與預測:依原料來源,2021 年至 2034 年
- 主要趨勢
- 玉米基
- 甘蔗基
- 木薯為主
- 木質纖維素生質能(木材、農業廢棄物等)
- 其他(藻類、微生物發酵等)
第6章:市場估計與預測:依最終用途產業,2021 年至 2034 年
- 主要趨勢
- 汽車與運輸
- 包裝產業
- 紡織業
- 建築與基礎設施
- 消費品
- 醫療保健和製藥
- 農業
- 能源領域
第7章:市場估計與預測:依製造程序,2021 年至 2034 年
- 主要趨勢
- 基於發酵的生產
- 葡萄糖和糖直接合成
- 化學催化
- 混合製程(發酵和催化相結合)
第8章:市場估計與預測:按地區,2021 年至 2034 年
- 主要趨勢
- 北美洲
- 美國
- 加拿大
- 歐洲
- 德國
- 英國
- 法國
- 西班牙
- 義大利
- 俄羅斯
- 亞太地區
- 中國
- 印度
- 日本
- 澳洲
- 韓國
- 拉丁美洲
- 巴西
- 墨西哥
- 阿根廷
- 中東和非洲
- 沙烏地阿拉伯
- 南非
- 阿拉伯聯合大公國
第9章:公司簡介
- AHB Global
- BASF SE
- Corbion NV
- Kawasaki Kasei Chemicals
- Mitsubishi Chemical Corporation
- Mitsui & Co., Ltd
- Myriant Corporation
- Nippon Shokubai
- Reverdia
- Roquette Freres
The Global Bio-Succinic Acid Market was valued at USD 138.3 million in 2024 and is estimated to grow at a CAGR of 11% to reach USD 386.6 million by 2034, driven by a rising consumer demand for sustainable, bio-based chemical alternatives to traditional petroleum-based products. As industries and governments alike focus on eco-friendly solutions, bio-succinic acid has gained traction as a green product, offering a renewable and biodegradable option in various applications. The increased emphasis on sustainability, coupled with stricter regulations on environmental impact, has made bio-succinic acid a key player in the chemical industry.
The increasing shift towards sustainable materials in various industries has significantly bolstered the demand for bio-succinic acid, as it is a key building block in the production of bio-based polymers. Among these polymers, polybutylene succinate (PBS) stands out due to its biodegradability, versatility, and potential to replace petroleum-based plastics in numerous applications. This surge in demand for PBS is driving the need for bio-succinic acid, as it is used in the production of PBS and other environmentally friendly polymers, further expanding the market for bio-succinic acid.
| Market Scope | |
|---|---|
| Start Year | 2024 |
| Forecast Year | 2025-2034 |
| Start Value | $138.3 Million |
| Forecast Value | $386.6 Million |
| CAGR | 11% |
The bio-succinic acid market from the corn segment held 38.4% share in 2024. Corn, being a carbohydrate-rich resource, is particularly well-suited for fermentation-based processes that yield bio-succinic acid. Its availability, cost-effectiveness, and ability to provide a consistent and reliable supply make it a preferred feedstock for large-scale production. The growing adoption of corn-based bio-succinic acid is driven by its established supply chain and the scalability of fermentation technologies. As demand for bio-succinic acid grows, alternative feedstocks are also being explored.
The fermentation-based process segment held 49% share due to its cost-effectiveness and reliance on renewable feedstocks. This method allows for scalable production with reduced environmental impact, making it the preferred choice for large-scale manufacturing. However, new approaches, such as direct synthesis from glucose and sugars, are emerging, offering higher yields under controlled conditions. Chemical catalysis is also gaining attention, although its higher costs and environmental concerns limit its widespread application. The hybrid process, combining fermentation and catalysis, is being explored as a solution to improve production efficiency and sustainability while balancing cost.
U.S Bio-Succinic Acid Market generated USD 22.38 million in 2024, with projections to reach USD 64.95 million by 2034, attributed to government incentives supporting bio-based chemicals and the growing industrial demand for renewable resources. The U.S. is a major producer of bio-succinic acid, benefiting from an advanced manufacturing infrastructure and strong governmental support for green technologies.
Key players in the Global Bio-Succinic Acid Market include Corbion N.V., Kawasaki Kasei Chemicals, BASF SE, Mitsui & Co., Ltd., and Reverdia. Companies are focusing on expanding their product portfolios, improving production efficiency, and exploring new raw materials to enhance their market share. For instance, Corbion N.V. and Reverdia have been leveraging advanced fermentation processes to optimize yields and reduce costs, while Mitsui & Co., Ltd. is exploring the use of renewable raw materials like agricultural waste for production. By adopting these strategies, these companies are positioning themselves to capitalize on the growing demand for bio-succinic acid as industries move toward more sustainable solutions.
Table of Contents
Chapter 1 Methodology & Scope
- 1.1 Market scope & definition
- 1.2 Base estimates & calculations
- 1.3 Forecast calculation
- 1.4 Data sources
- 1.4.1 Primary
- 1.4.2 Secondary
- 1.4.2.1 Paid sources
- 1.4.2.2 Public sources
- 1.5 Primary research and validation
- 1.5.1 Primary sources
- 1.5.2 Data mining sources
Chapter 2 Executive Summary
- 2.1 Industry synopsis, 2021-2034
Chapter 3 Industry Insights
- 3.1 Industry ecosystem analysis
- 3.1.1 Factor affecting the value chain
- 3.1.2 Profit margin analysis
- 3.1.3 Disruptions
- 3.1.4 Future outlook
- 3.1.5 Manufacturers
- 3.1.6 Distributors
- 3.2 Trump administration tariffs
- 3.2.1 Impact on trade
- 3.2.1.1 Trade volume disruptions
- 3.2.1.2 Retaliatory measures
- 3.2.2 Impact on the industry
- 3.2.3 Supply-side impact (raw materials)
- 3.2.3.1 Price volatility in key materials
- 3.2.3.2 Supply chain restructuring
- 3.2.3.3 Production cost implications
- 3.2.4 Demand-side impact (selling price)
- 3.2.4.1 Price transmission to end markets
- 3.2.4.2 Market share dynamics
- 3.2.4.3 Consumer response patterns
- 3.2.5 Key companies impacted
- 3.2.6 Strategic Industry Responses
- 3.2.6.1 Supply Chain Reconfiguration
- 3.2.6.2 Pricing and Product Strategies
- 3.2.6.3 Policy Engagement
- 3.2.7 Outlook and Future Considerations
- 3.2.1 Impact on trade
- 3.3 Trade statistics (HS Code)
- 3.3.1 Major Exporting Countries
- 3.3.2 Major Importing Countries
Note: the above trade statistics will be provided for key countries only.
- 3.4 Profit margin analysis
- 3.5 Regulatory landscape
- 3.6 Impact forces
- 3.6.1 Growth drivers
- 3.6.1.1 Rising demand for bio-based chemicals and sustainable alternatives
- 3.6.1.2 Strong consumer preference for sustainable and green products
- 3.6.1.3 Government regulations promoting eco-friendly and biodegradable products
- 3.6.2 Industry pitfalls & challenges
- 3.6.2.1 High production costs compared to petroleum-based alternatives
- 3.6.2.2 Limited availability of raw materials, affecting scalability
- 3.6.1 Growth drivers
- 3.7 Growth potential analysis
- 3.8 Porter's analysis
- 3.9 PESTEL analysis
Chapter 4 Competitive Landscape, 2024
- 4.1 Introduction
- 4.2 Company market share analysis
- 4.3 Competitive positioning matrix
- 4.4 Strategic outlook matrix
Chapter 5 Market Estimates and Forecast, By Raw Material Source, 2021 – 2034 (USD Million) (Kilo Tons)
- 5.1 Key trends
- 5.2 Corn-based
- 5.3 Sugarcane-based
- 5.4 Cassava-based
- 5.5 Lignocellulosic biomass (wood, agricultural waste, etc.)
- 5.6 Others (algae, microbial fermentation, etc.)
Chapter 6 Market Estimates and Forecast, By End Use Industry, 2021 – 2034 (USD Million) (Kilo Tons)
- 6.1 Key trends
- 6.2 Automotive & transportation
- 6.3 Packaging industry
- 6.4 Textile industry
- 6.5 Construction & infrastructure
- 6.6 Consumer goods
- 6.7 Healthcare & pharmaceuticals
- 6.8 Agriculture
- 6.9 Energy sector
Chapter 7 Market Estimates and Forecast, By Manufacturing Process, 2021 – 2034 (USD Million) (Kilo Tons)
- 7.1 Key trends
- 7.2 Fermentation-based production
- 7.3 Direct synthesis from glucose & sugars
- 7.4 Chemical catalysis
- 7.5 Hybrid process (combination of fermentation & catalysis)
Chapter 8 Market Estimates and Forecast, By Region, 2021 – 2034 (USD Million) (Kilo Tons)
- 8.1 Key trends
- 8.2 North America
- 8.2.1 U.S.
- 8.2.2 Canada
- 8.3 Europe
- 8.3.1 Germany
- 8.3.2 UK
- 8.3.3 France
- 8.3.4 Spain
- 8.3.5 Italy
- 8.3.6 Russia
- 8.4 Asia Pacific
- 8.4.1 China
- 8.4.2 India
- 8.4.3 Japan
- 8.4.4 Australia
- 8.4.5 South Korea
- 8.5 Latin America
- 8.5.1 Brazil
- 8.5.2 Mexico
- 8.5.3 Argentina
- 8.6 Middle East and Africa
- 8.6.1 Saudi Arabia
- 8.6.2 South Africa
- 8.6.3 UAE
Chapter 9 Company Profiles
- 9.1 AHB Global
- 9.2 BASF SE
- 9.3 Corbion N.V.
- 9.4 Kawasaki Kasei Chemicals
- 9.5 Mitsubishi Chemical Corporation
- 9.6 Mitsui & Co., Ltd
- 9.7 Myriant Corporation
- 9.8 Nippon Shokubai
- 9.9 Reverdia
- 9.10 Roquette Freres


