


 |
市場調查報告書
商品編碼
1750342
抗氧化飲料市場機會、成長動力、產業趨勢分析及 2025 - 2034 年預測Antioxidant Drinks Market Opportunity, Growth Drivers, Industry Trend Analysis, and Forecast 2025 - 2034 |
||||||
2024年,全球抗氧化飲料市場規模達203億美元,預計到2034年將以6%的複合年成長率成長,達到361億美元。這一成長趨勢主要源自於消費者對健康保健日益成長的關注,他們越來越青睞具有功能性益處的飲料。隨著越來越多的人致力於增強免疫系統、延緩老化和減少體內毒素的積累,富含抗氧化成分的飲料正日益受到青睞。現代消費者資訊豐富,積極尋求有助於預防性保健的產品,這種行為正在重塑飲料市場格局。
隨著人們越來越意識到氧化壓力的有害影響及其與慢性疾病和老化之間的聯繫,對抗氧化壓力的飲料需求激增。如今,注重健康的消費者不僅尋求口感佳,還尋求符合清潔標籤趨勢的飲料,青睞透明度和天然成分。市場已明顯轉向低卡路里、無糖和植物性產品,推動功能性飲料成為主流。此外,超市、專賣店、便利商店和線上平台等零售通路中抗氧化飲料的供應日益豐富,消費者更容易獲得自己喜歡的產品,從而推動了市場擴張。
| 市場範圍 | |
|---|---|
| 起始年份 | 2024 |
| 預測年份 | 2025-2034 |
| 起始值 | 203億美元 |
| 預測值 | 361億美元 |
| 複合年成長率 | 6% |
市場表現因地區而異,北美和歐洲的產品滲透率較高。同時,隨著傳統健康飲品重新受到歡迎,亞太地區也正經歷快速成長。在所有人群中,線上零售越來越受到青睞,尤其是注重便利性和直銷的年輕消費者群體。這種不斷變化的零售格局為品牌創造了新的機遇,使其能夠透過個人化和創新的產品吸引消費者。
創新是這個市場的顯著特徵,各公司不斷開發新配方,以滿足日益成長的功能性、健康型飲料需求。隨著健康成為消費者生活方式中不可或缺的一部分,製造商預計將嘗試新的成分和技術,以保持競爭力。隨著消費者繼續優先考慮健康益處而非合成添加劑,天然功能性成分(尤其是與整體健康相關的成分)的使用可能會越來越受到青睞。
依產品類型分類,抗氧化飲料市場分為天然類和強化類。天然抗氧化飲料佔據了相當大的市場佔有率,2024年市場價值達到136億美元。這些飲料加工流程簡單,原料來源完整,深受追求清潔標籤和營養豐富的消費者的青睞。天然產品被認為更安全、更健康,能夠提供維持免疫功能和整體健康的必需抗氧化劑。
就來源而言,市場區隔包括水果、蔬菜、草藥和植物藥等。水果飲料在2024年佔據59%的市場佔有率,佔據主導地位,預計在預測期內將以5.8%的複合年成長率成長。水果來源仍然是抗氧化飲料的核心,因為它們營養豐富,消費者認可度高,使其成為市場主導力量。
依產品類別分類,市場包括即飲茶、蔬果混合茶、強化水、能量飲料和運動飲料、康普茶和發酵飲料、功能性咖啡和可可飲料等。其中,即飲茶預計到2025年將達到62億美元,複合年成長率預計為6.2%。這類飲料因其代謝益處和緩解壓力的特性而備受青睞,消費者更青睞其便利性和可感知的健康益處。
就分銷通路而言,市場包括超市和大賣場、便利商店、專賣店、線上零售、餐飲服務等。超市和大賣場預計在2025年的價值為79億美元,預測期間的複合年成長率為5.5%。這些門市憑藉其便利的地理位置、龐大的客流量以及多樣化的產品選擇,吸引了注重性價比和高階消費的消費者,因此仍然是領先的分銷方式。
美國是抗氧化飲料市場的主導者,2024年貢獻了34億美元的收入。人們對功能性飲料的興趣日益濃厚,以及人們對健康益處的認知不斷提高,是推動需求激增的關鍵因素。美國消費者越來越青睞標籤透明且健康益處已證實的產品。這種轉變促使製造商不斷創新,拓展產品組合,以滿足更注重健康的消費者群體的需求。
塑造競爭格局的主要公司包括可口可樂公司、達能公司、雀巢公司、三得利控股公司和塔塔消費品公司。這些公司擁有強大的全球影響力,擁有全面的產品組合以及強大的生產和分銷基礎設施,使其能夠高效、持續地滿足不同市場不斷成長的需求。
目錄
第1章:方法論與範圍
第2章:執行摘要
第3章:行業洞察
- 市場介紹
- 產業價值鏈分析
- 原物料採購
- 加工製造
- 包裝和分銷
- 零售和消費者訪問
- 技術格局
- 加工技術
- 保存方法
- 包裝創新
- 新興技術
- 市場動態
- 市場促進因素
- 健康意識不斷增強
- 慢性病盛行率不斷上升
- 功能性飲料的需求不斷成長
- 從含糖飲料轉向更健康的替代品
- 市場限制
- 生產成本高
- 嚴格的監管框架
- 發展中地區消費者意識有限
- 口味和風味挑戰
- 市場機會
- 產品創新與開發
- 新興市場的擴張
- 電子商務成長
- 清潔標籤和天然成分趨勢
- 市場挑戰
- 維持抗氧化劑的生物可利用性
- 供應鏈中斷
- 競爭定價壓力
- 證實健康聲明
- 市場促進因素
- 杵分析
- 波特五力分析
- 監管框架和標準
- 全球法規
- 區域監管機構
- 健康聲明法規
- 標籤要求
- 法規對市場成長的影響
- Covid-19影響分析
- 消費者行為分析
- 消費者人口統計
- 購買模式
- 偏好因素
- 健康認知與意識
- 永續性和環境方面
- 永續採購實踐
- 環保包裝舉措
- 減少廢棄物的策略
- 碳足跡考量
- 川普政府關稅分析
- 對貿易的影響
- 貿易量中斷
- 報復措施
- 對產業的影響
- 供應方影響(原料)
- 主要材料價格波動
- 供應鏈重組
- 生產成本影響
- 需求面影響(售價)
- 價格傳導至終端市場
- 市佔率動態
- 消費者反應模式
- 受影響的主要公司
- 策略產業反應
- 供應鏈重組
- 定價和產品策略
- 政策參與
- 貿易統計(HS編碼)
- 主要出口國(2021-2024年)
- 美國
- 日本
- 韓國
- 主要進口國(2021-2024年)
- 印度
- 俄羅斯
- 美國
- 主要出口國(2021-2024年)
- 供應方影響(原料)
- 對貿易的影響
註:以上貿易統計僅針對重點國家。
第4章:競爭格局
- 介紹
- 市佔率分析
- 主要參與者所採用的關鍵策略
- 併購
- 夥伴關係和合作
- 產品發布和創新
- 擴張計劃
- 競爭基準測試
- 戰略定位矩陣
- 競爭儀錶板
- 新興參與者分析
- 投資分析與融資方案
第5章:市場估計與預測:依產品類型,2021 - 2034 年
- 主要趨勢
- 自然的
- 強化
第6章:市場估計與預測:依來源 2021 - 2034
- 主要趨勢
- 水果
- 莓果(藍莓、蔓越莓、草莓)
- 柑橘類水果
- 石榴
- 其他水果
- 蔬菜
- 甜菜根
- 紅蘿蔔
- 其他蔬菜
- 草藥和植物藥
- 綠茶
- 馬黛茶
- 薑黃
- 其他草藥和植物藥
- 其他
第7章:市場估計與預測:依產品類別,2021 - 2034 年
- 主要趨勢
- 即飲茶
- 水果和蔬菜
- 增強型水
- 能量和運動飲料
- 功能性咖啡和可可飲料
- 康普茶和發酵飲料
- 其他
第8章:市場估計與預測:按配銷通路,2021 - 2034 年
- 主要趨勢
- 超市和大賣場
- 便利商店
- 專賣店
- 網路零售
- 餐飲服務
- 其他
第9章:市場估計與預測:按地區,2021 - 2034 年
- 主要趨勢
- 北美洲
- 美國
- 加拿大
- 歐洲
- 德國
- 英國
- 法國
- 西班牙
- 義大利
- 俄羅斯
- 亞太地區
- 中國
- 印度
- 日本
- 澳洲
- 韓國
- 拉丁美洲
- 巴西
- 墨西哥
- 阿根廷
- 中東和非洲
- 沙烏地阿拉伯
- 南非
- 阿拉伯聯合大公國
第10章:公司簡介
- Bai Brands LLC (Dr Pepper Snapple Group)
- Danone SA
- GT's Living Foods
- Hint, Inc.
- ITO EN, Ltd.
- Karma Culture LLC
- Keurig Dr Pepper Inc.
- Lemon Perfect
- Monster Beverage Corporation
- Nestle SA
- Ocean Spray Cranberries, Inc.
- PepsiCo, Inc.
- POM Wonderful LLC
- Red Bull GmbH
- Suntory Holdings Limited
- Tata Consumer Products Limited
- The Coca-Cola Company
- Unilever PLC
- Vita Coco
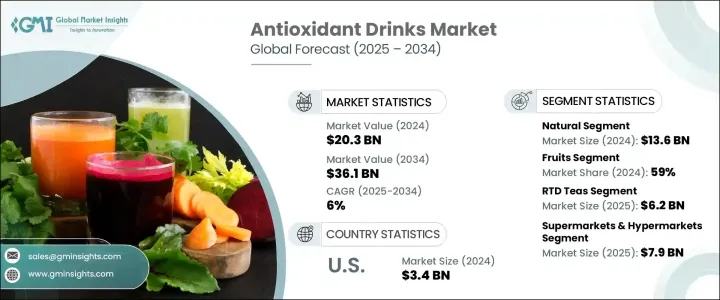
The Global Antioxidant Drinks Market was valued at USD 20.3 billion in 2024 and is estimated to grow at a CAGR of 6% to reach USD 36.1 billion by 2034. This upward trend is driven primarily by the rising focus on health and wellness, with consumers increasingly favoring beverages that offer functional benefits. Antioxidant-rich drinks are gaining momentum as more people aim to improve their immune systems, delay aging, and reduce toxin buildup in the body. The modern consumer is highly informed and actively seeks products that support preventive health, and this behavior is reshaping the beverage landscape.
Greater awareness of the harmful effects of oxidative stress and its links to chronic diseases and aging has led to an upsurge in demand for drinks that counteract these effects. Health-conscious buyers now look for beverages that not only taste good but also align with clean-label trends, favoring transparency and natural ingredients. The market has seen a marked shift toward low-calorie, sugar-free, and plant-based options, helping functional drinks become mainstream. Additionally, improved availability of antioxidant beverages across retail channels such as supermarkets, specialty stores, convenience outlets, and online platforms is making it easier for consumers to access their preferred products, thereby fueling market expansion.
| Market Scope | |
|---|---|
| Start Year | 2024 |
| Forecast Year | 2025-2034 |
| Start Value | $20.3 Billion |
| Forecast Value | $36.1 Billion |
| CAGR | 6% |
Market performance varies by region, with North America and Europe demonstrating strong product penetration. Meanwhile, the Asia-Pacific region is witnessing rapid growth as traditional wellness drinks gain renewed popularity. Across all demographics, online retail is increasingly preferred, especially among younger buyers who value convenience and direct-to-consumer accessibility. This changing retail dynamic is creating new opportunities for brands to engage customers with personalized and innovative offerings.
Innovation is a defining trait of this market, with companies developing new formulations to meet the growing demand for functional, health-enhancing beverages. As wellness becomes an integral part of consumer lifestyles, manufacturers are expected to experiment with new ingredients and technologies to stay competitive. The use of naturally functional ingredients, particularly those associated with holistic wellness, is likely to gain traction as consumers continue to prioritize health benefits over synthetic additives.
By product type, the antioxidant drinks market is divided into natural and fortified categories. Natural antioxidant drinks captured a significant market share, recording a value of USD 13.6 billion in 2024. These beverages, which are made with minimal processing and sourced from whole ingredients, are preferred by consumers seeking clean-label, nutrient-dense options. Natural products are perceived as safer and healthier, offering essential antioxidants that support immune function and overall wellness.
In terms of sources, the market segments include fruits, vegetables, herbs and botanicals, and others. Fruit-based beverages led the segment with a 59% share in 2024 and are expected to grow at a CAGR of 5.8% through the forecast period. Fruit sources remain central to antioxidant beverages due to their high nutrient content and favorable consumer perception, making them a dominant force in the market.
When categorized by product category, the market comprises RTD teas, fruit and vegetable blends, enhanced waters, energy and sports drinks, kombucha and fermented drinks, functional coffee and cocoa-based beverages, and others. Among these, RTD teas are projected to reach USD 6.2 billion in 2025 and are anticipated to grow at a CAGR of 6.2%. These beverages are valued for their metabolic benefits and stress-relief properties, with consumers gravitating toward their convenience and perceived health benefits.
In terms of distribution channels, the market includes supermarkets and hypermarkets, convenience stores, specialty outlets, online retail, food service, and others. Supermarkets and hypermarkets accounted for a projected value of USD 7.9 billion in 2025, with an estimated CAGR of 5.5% over the forecast period. These outlets remain a leading distribution method due to their widespread accessibility, large consumer footfall, and diverse product offerings that appeal to both value-conscious and premium shoppers.
The United States is the dominant player in the antioxidant drinks market, contributing USD 3.4 billion in revenue in 2024. Growing interest in functional beverages and increasing awareness of health benefits are key factors driving the surge in demand. Consumers in the U.S. are gravitating toward products with transparent labeling and proven wellness benefits. This shift has encouraged manufacturers to innovate and expand their portfolios to cater to a more health-focused audience.
Major companies shaping the competitive landscape include The Coca-Cola Company, Danone S.A., Nestle S.A., Suntory Holdings, and Tata Consumer Products. These firms maintain a strong global presence with comprehensive product portfolios and robust production and distribution infrastructure, allowing them to meet rising demand efficiently and consistently across diverse markets.
Table of Contents
Chapter 1 Methodology and Scope
- 1.1 Market scope and definition
- 1.2 Base estimates and calculations
- 1.3 Forecast calculation
- 1.4 Data sources
- 1.4.1 Primary
- 1.4.2 Secondary
- 1.4.2.1 Paid sources
- 1.4.2.2 Public sources
- 1.5 Primary research and validation
- 1.5.1 Primary sources
- 1.5.2 Data mining sources
Chapter 2 Executive Summary
- 2.1 Market snapshot
- 2.2 Global antioxidant drinks market overview
- 2.3 Key industry highlights
- 2.4 Regional insights
- 2.5 Investment scenario
- 2.6 Competitive landscape overview
- 2.7 Future market outlook
Chapter 3 Industry Insights
- 3.1 Market introduction
- 3.2 Industry value chain analysis
- 3.2.1 Raw material sourcing and procurement
- 3.2.2 Processing and manufacturing
- 3.2.3 Packaging and distribution
- 3.2.4 Retail and consumer access
- 3.3 Technology landscape
- 3.3.1 Processing technologies
- 3.3.2 Preservation methods
- 3.3.3 Packaging innovations
- 3.3.4 Emerging technologies
- 3.4 Market dynamics
- 3.4.1 Market drivers
- 3.4.1.1 Rising health consciousness
- 3.4.1.2 Increasing prevalence of chronic diseases
- 3.4.1.3 Growing demand for functional beverages
- 3.4.1.4 Shift from sugary drinks to healthier alternatives
- 3.4.2 Market restraints
- 3.4.2.1 High production costs
- 3.4.2.2 Stringent regulatory framework
- 3.4.2.3 Limited consumer awareness in developing regions
- 3.4.2.4 Taste and flavor challenges
- 3.4.3 Market opportunities
- 3.4.3.1 Product innovation and development
- 3.4.3.2 Expansion in emerging markets
- 3.4.3.3 E-commerce growth
- 3.4.3.4 Clean label and natural ingredients trend
- 3.4.4 Market challenges
- 3.4.4.1 Maintaining bioavailability of antioxidants
- 3.4.4.2 Supply chain disruptions
- 3.4.4.3 Competitive pricing pressure
- 3.4.4.4 Substantiating health claims
- 3.4.1 Market drivers
- 3.5 Pestle analysis
- 3.6 Porter's five forces analysis
- 3.7 Regulatory framework and standards
- 3.7.1 Global regulations
- 3.7.2 Regional regulatory landscape
- 3.7.3 Health claim regulations
- 3.7.4 Labeling requirements
- 3.7.5 Impact of regulations on market growth
- 3.8 Covid-19 impact analysis
- 3.9 Consumer behavior analysis
- 3.9.1 Consumer demographics
- 3.9.2 Purchase patterns
- 3.9.3 Preference factors
- 3.9.4 Health perception and awareness
- 3.10 Sustainability and environmental aspects
- 3.10.1 Sustainable sourcing practices
- 3.10.2 Eco-friendly packaging initiatives
- 3.10.3 Waste reduction strategies
- 3.10.4 Carbon footprint considerations
- 3.11 Trump administration tariff analysis
- 3.11.1 Impact on trade
- 3.11.1.1 Trade volume disruptions
- 3.11.1.2 Retaliatory measures
- 3.11.2 Impact on the industry
- 3.11.2.1 Supply-side impact (raw materials)
- 3.11.2.1.1 Price volatility in key materials
- 3.11.2.1.2 Supply chain restructuring
- 3.11.2.1.3 Production cost implications
- 3.11.2.2 Demand-side impact (selling price)
- 3.11.2.2.1 Price transmission to end markets
- 3.11.2.2.2 Market share dynamics
- 3.11.2.2.3 Consumer response patterns
- 3.11.2.3 Key companies impacted
- 3.11.2.4 Strategic industry responses
- 3.11.2.5 Supply chain reconfiguration
- 3.11.2.6 Pricing and product strategies
- 3.11.2.7 Policy engagement
- 3.11.2.8 Trade Statistics (HS Code)
- 3.11.2.8.1 Major Exporting Countries, 2021-2024 (USD Bn)
- 3.11.2.8.1.1 U.S.
- 3.11.2.8.1.2 Japan
- 3.11.2.8.1.3 South Korea
- 3.11.2.8.2 Major Importing Countries, 2021-2024 (USD Bn)
- 3.11.2.8.2.1 India
- 3.11.2.8.2.2 Russia
- 3.11.2.8.2.3 U.S.
- 3.11.2.8.1 Major Exporting Countries, 2021-2024 (USD Bn)
- 3.11.2.1 Supply-side impact (raw materials)
- 3.11.1 Impact on trade
Note: the above trade statistics will be provided for key countries only.
Chapter 4 Competitive Landscape, 2024
- 4.1 Introduction
- 4.2 Market share analysis
- 4.3 Key strategies adopted by major players
- 4.3.1 Mergers and acquisitions
- 4.3.2 Partnerships and collaborations
- 4.3.3 Product launches and innovations
- 4.3.4 Expansion initiatives
- 4.4 Competitive benchmarking
- 4.5 Strategic positioning matrix
- 4.6 Competitive dashboard
- 4.7 Emerging players analysis
- 4.8 Investment analysis and funding scenario
Chapter 5 Market Estimates and Forecast, By Product Type, 2021 - 2034 (USD Billion) (Kilo Tons)
- 5.1 Key trends
- 5.2 Natural
- 5.3 Fortified
Chapter 6 Market Estimates and Forecast, By Source 2021 - 2034 (USD Billion) (Kilo Tons)
- 6.1 Key trends
- 6.2 Fruits
- 6.2.1 Berries (blueberry, cranberry, strawberry)
- 6.2.2 Citrus fruits
- 6.2.3 Pomegranate
- 6.2.4 Other fruits
- 6.3 Vegetable
- 6.3.1 Beetroot
- 6.3.2 Carrot
- 6.3.3 Other vegetables
- 6.4 Herbs & botanicals
- 6.4.1 Green tea
- 6.4.2 Yerba mate
- 6.4.3 Turmeric
- 6.4.4 Other herbs & botanicals
- 6.5 Others
Chapter 7 Market Estimates and Forecast, By Product category, 2021 - 2034 (USD Billion) (Kilo Tons)
- 7.1 Key trends
- 7.2 RTD teas
- 7.3 Fruits & vegetables
- 7.4 Enhanced water
- 7.5 Energy and sports drinks
- 7.6 Functional coffee and cocoa beverages
- 7.7 Kombucha and fermented drinks
- 7.8 Others
Chapter 8 Market Estimates and Forecast, By Distribution Channel, 2021 - 2034 (USD Billion) (Kilo Tons)
- 8.1 Key trends
- 8.2 Supermarkets & hypermarkets
- 8.3 Convenience stores
- 8.4 Speciality stores
- 8.5 Online retail
- 8.6 Food service
- 8.7 Others
Chapter 9 Market Estimates and Forecast, By Region, 2021 - 2034 (USD Billion) (Kilo Tons)
- 9.1 Key trends
- 9.2 North America
- 9.2.1 U.S.
- 9.2.2 Canada
- 9.3 Europe
- 9.3.1 Germany
- 9.3.2 UK
- 9.3.3 France
- 9.3.4 Spain
- 9.3.5 Italy
- 9.3.6 Russia
- 9.4 Asia Pacific
- 9.4.1 China
- 9.4.2 India
- 9.4.3 Japan
- 9.4.4 Australia
- 9.4.5 South Korea
- 9.5 Latin America
- 9.5.1 Brazil
- 9.5.2 Mexico
- 9.5.3 Argentina
- 9.6 Middle East and Africa
- 9.6.1 Saudi Arabia
- 9.6.2 South Africa
- 9.6.3 UAE
Chapter 10 Company Profiles
- 10.1 Bai Brands LLC (Dr Pepper Snapple Group)
- 10.2 Danone S.A.
- 10.3 GT's Living Foods
- 10.4 Hint, Inc.
- 10.5 ITO EN, Ltd.
- 10.6 Karma Culture LLC
- 10.7 Keurig Dr Pepper Inc.
- 10.8 Lemon Perfect
- 10.9 Monster Beverage Corporation
- 10.10 Nestle S.A.
- 10.11 Ocean Spray Cranberries, Inc.
- 10.12 PepsiCo, Inc.
- 10.13 POM Wonderful LLC
- 10.14 Red Bull GmbH
- 10.15 Suntory Holdings Limited
- 10.16 Tata Consumer Products Limited
- 10.17 The Coca-Cola Company
- 10.18 Unilever PLC
- 10.19 Vita Coco
 營養補充飲料市場預測至2034年:按飲料類型、功能成分、健康益處、消費群組、包裝類型、劑型、通路和地區分類的全球分析
 紅藤葉萃取物市場機會、成長促進因素、產業趨勢分析和 2024 年至 2032 年預測