


 |
市場調查報告書
商品編碼
1750333
視網膜電圖市場機會、成長動力、產業趨勢分析及 2025 - 2034 年預測Electroretinogram Market Opportunity, Growth Drivers, Industry Trend Analysis, and Forecast 2025 - 2034 |
||||||
2024年,全球視網膜電圖市場規模達4.732億美元,預估年複合成長率為8%,2034年將達9.988億美元。這主要得益於老年黃斑部病變、青光眼和糖尿病視網膜病變等視網膜疾病日益加重的負擔,這些疾病也催生了對更精準、更早期診斷工具的需求。隨著全球人口老化,這些疾病的發生率也在上升,這反過來又加速了視網膜電圖系統在臨床環境中的應用。公眾健康意識的不斷提高以及對預防性眼部保健的日益重視,推動了市場滲透。視網膜電圖(ERG)測試使眼科醫生能夠檢測視網膜功能障礙,從而有助於確保及時進行醫療干預並改善患者預後。
視網膜電圖 (ERG) 系統的技術進步在重塑市場趨勢和用戶採用方面發揮了關鍵作用。向攜帶式電池供電設備的轉變使得在偏遠地區或農村地區進行眼科診斷成為可能,提高了可及性,並促進了先前缺乏此類資源的人群的早期發現。這些緊湊型系統適用於現場篩檢、行動診所和即時檢測,進一步推動了全球醫療保健網路對其的需求。除了行動性之外,自動化和整合軟體的持續改進也顯著提高了 ERG 程式的效率。自動化方案、即時資料處理和直覺的介面正在簡化臨床醫生的工作流程,減少人為錯誤,並提供更一致、更可靠的診斷結果。這項技術進步不僅提高了患者吞吐量,還提高了長期資料管理,這對於追蹤病情進展和治療效果至關重要。
| 市場範圍 | |
|---|---|
| 起始年份 | 2024 |
| 預測年份 | 2025-2034 |
| 起始值 | 4.732億美元 |
| 預測值 | 9.988億美元 |
| 複合年成長率 | 8% |
預計到2034年,桌上型視網膜視網膜成像市場將創造6.027億美元的市場價值。這一成長軌跡主要得益於該系統可自訂的配置、卓越的解析度以及與診斷軟體套件的整合。其對各種臨床環境的適應性,以及進行詳細且準確的視網膜評估的能力,確保其仍然是治療複雜視網膜疾病的專家的首選。
全視野閃光視網膜電圖 (Flash ERG) 市場在 2024 年的營收為 2.105 億美元。這些系統仍然是評估光感受器活動和診斷各種視網膜疾病的首選方法。它們能夠在一次診斷過程中評估視桿細胞和視錐細胞的功能,使其成為眼科評估不可或缺的工具。全視野閃光視網膜電圖的效率、速度和準確性預計將在整個預測期內保持強勁的需求。
美國視網膜電圖市場在2024年創收1.713億美元,預計2034年將以7.4%的複合年成長率成長。強大的醫療基礎設施、慢性視網膜疾病盛行率的上升以及優惠的醫療政策是推動該地區成長的主要因素。全球各地的醫療機構都在投資先進的診斷技術,醫療器材製造商和醫療服務提供者之間的合作也為持續創新和應用奠定了堅實的基礎。
Diagnosys、LKC Technologies、Konan Medical USA、M&S Technologies、Metrovision、Diopsys 和 Roland Consult 等領先企業強調持續創新和產品差異化,以提升其市場地位。許多公司正在透過先進的攜帶式和自動化 ERG 系統擴展其產品線。 CSO 和 Vision 與研究機構和診所合作,以改善臨床驗證。策略分銷合作夥伴關係和向新興市場的擴張也是公司優先考慮的事項,旨在擴大客戶覆蓋範圍並提升全球市場佔有率。
目錄
第1章:方法論與範圍
第2章:執行摘要
第3章:行業洞察
- 產業生態系統分析
- 產業衝擊力
- 成長動力
- 視網膜疾病盛行率上升
- ERG 設備的技術進步
- 老年人口不斷增加
- 早期疾病檢測需求不斷成長
- 產業陷阱與挑戰
- 缺乏熟練的專業人員
- 有限的報銷政策
- 成長動力
- 成長潛力分析
- 監管格局
- 川普政府關稅
- 對貿易的影響
- 貿易量中斷
- 各國應對措施
- 對產業的影響
- 供應方影響(製造成本)
- 主要材料價格波動
- 供應鏈重組
- 生產成本影響
- 需求面影響(消費者成本)
- 價格傳導至終端市場
- 市佔率動態
- 消費者反應模式
- 供應方影響(製造成本)
- 受影響的主要公司
- 策略產業反應
- 供應鏈重組
- 定價和產品策略
- 政策參與
- 展望與未來考慮
- 對貿易的影響
- 定價分析
- 技術格局
- 差距分析
- 波特的分析
- PESTEL分析
第4章:競爭格局
- 介紹
- 公司市佔率分析
- 公司矩陣分析
- 競爭定位矩陣
- 策略儀表板
第5章:市場估計與預測:按類型,2021 - 2034 年
- 主要趨勢
- 全場閃光視網膜電圖(ffERG)
- 模式視網膜電圖 (PERG)
- 多焦點視網膜電圖 (mfERG)
第6章:市場估計與預測:按產品,2021 - 2034 年
- 主要趨勢
- 桌面
- 手持式
第7章:市場估計與預測:按應用,2021 - 2034 年
- 主要趨勢
- 臨床診斷
- 研究
第8章:市場估計與預測:依最終用途,2021 - 2034 年
- 主要趨勢
- 醫院和診所
- 眼科中心
- 研究機構
第9章:市場估計與預測:按地區,2021 - 2034 年
- 主要趨勢
- 北美洲
- 美國
- 加拿大
- 歐洲
- 德國
- 英國
- 法國
- 西班牙
- 義大利
- 荷蘭
- 亞太地區
- 中國
- 日本
- 印度
- 澳洲
- 韓國
- 拉丁美洲
- 巴西
- 墨西哥
- 阿根廷
- 中東和非洲
- 南非
- 沙烏地阿拉伯
- 阿拉伯聯合大公國
第10章:公司簡介
- an-vision
- ChongQing SunKingdom Medical
- CSO
- Diagnosys
- Diopsys
- Electro-Diagnostic Imaging
- Konan Medical USA
- LKC Technologies
- M&S Technologies
- Metrovision
- Roland Consult Stasche & Finger
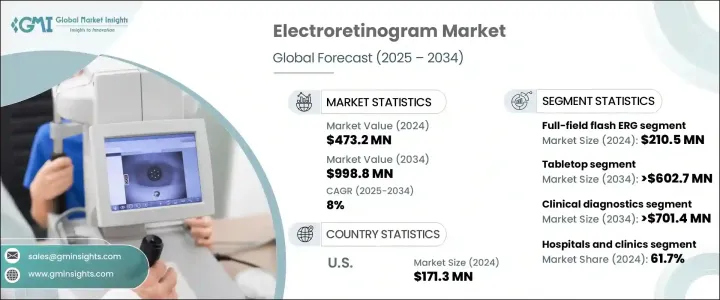
The Global Electroretinogram Market was valued at USD 473.2 million in 2024 and is estimated to grow at a CAGR of 8% to reach USD 998.8 million by 2034, driven by the increasing burden of retinal conditions, including age-related macular degeneration, glaucoma, and diabetic retinopathy, that fuel demand for more accurate and early diagnostic tools. As the global population ages, the incidence of these diseases is rising, which in turn is accelerating the adoption of electroretinogram systems across clinical settings. Rising public health awareness and the growing emphasis on preventive eye care boost market penetration. ERG testing allows ophthalmologists to detect retinal dysfunction, helping ensure timely medical intervention and better patient outcomes.
Technological advancements in electroretinogram (ERG) systems have played a pivotal role in reshaping market trends and user adoption. The shift toward portable, battery-operated devices has made it feasible to deliver ophthalmic diagnostics in hard-to-reach or rural areas, increasing accessibility and facilitating early detection in populations that previously lacked such resources. These compact systems are useful for on-site screenings, mobile clinics, and point-of-care testing, further fueling their demand across global healthcare networks. In addition to mobility, ongoing improvements in automation and integrated software are significantly enhancing the efficiency of ERG procedures. Automated protocols, real-time data processing, and intuitive interfaces are streamlining workflows for clinicians, reducing human error, and delivering more consistent and reliable diagnostic outcomes. This technological evolution is improving not only patient throughput but also long-term data management, which is crucial for tracking disease progression and treatment efficacy.
| Market Scope | |
|---|---|
| Start Year | 2024 |
| Forecast Year | 2025-2034 |
| Start Value | $473.2 Million |
| Forecast Value | $998.8 Million |
| CAGR | 8% |
The tabletop segment is expected to generate USD 602.7 million by 2034. This growth trajectory is primarily supported by the systems' customizable configurations, superior resolution, and integration with diagnostic software suites. Their adaptability to various clinical environments, along with the ability to produce detailed and accurate retinal assessments, ensures they remain the preferred choice for specialists managing complex retinal disorders.
The full-field flash ERG segment generated USD 210.5 million in 2024. These systems remain the preferred modality for evaluating photoreceptor activity and diagnosing a wide array of retinal disorders. Their ability to assess rod and cone cell function in a single diagnostic session makes them indispensable for ophthalmic evaluations. The efficiency, speed, and accuracy of full-field flash ERGs are expected to keep demand robust throughout the forecast timeline.
U.S. Electroretinogram Market generated USD 171.3 million in 2024 and is forecasted to grow at a CAGR of 7.4% through 2034. A strong healthcare infrastructure, increased prevalence of chronic retinal diseases, and favorable health policies are major factors propelling growth in the region. Healthcare facilities worldwide are investing in advanced diagnostic technologies, and partnerships between medical device manufacturers and care providers are fostering a strong foundation for continued innovation and adoption.
Leading players such as Diagnosys, LKC Technologies, Konan Medical USA, M&S Technologies, Metrovision, Diopsys, and Roland Consult emphasize continuous innovation and product differentiation to boost their presence. Many companies are expanding their product lines with advanced portable and automated ERG systems. CSO and Vision collaborate with research institutes and clinics to improve clinical validation. Strategic distribution partnerships and expansion into emerging markets are also prioritized to broaden customer reach and increase global market share.
Table of Contents
Chapter 1 Methodology and Scope
- 1.1 Market scope and definitions
- 1.2 Research design
- 1.2.1 Research approach
- 1.2.2 Data collection methods
- 1.3 Base estimates and calculations
- 1.3.1 Base year calculation
- 1.3.2 Key trends for market estimation
- 1.4 Forecast model
- 1.5 Primary research and validation
- 1.5.1 Primary sources
- 1.5.2 Data mining sources
Chapter 2 Executive Summary
- 2.1 Industry 3600 synopsis
Chapter 3 Industry Insights
- 3.1 Industry ecosystem analysis
- 3.2 Industry impact forces
- 3.2.1 Growth drivers
- 3.2.1.1 Rising prevalence of retinal disorders
- 3.2.1.2 Technological advancements in ERG devices
- 3.2.1.3 Growing geriatric population
- 3.2.1.4 Rising demand for early disease detection
- 3.2.2 Industry pitfalls and challenges
- 3.2.2.1 Lack of skilled professionals
- 3.2.2.2 Limited reimbursement policies
- 3.2.1 Growth drivers
- 3.3 Growth potential analysis
- 3.4 Regulatory landscape
- 3.5 Trump administration tariffs
- 3.5.1 Impact on trade
- 3.5.1.1 Trade volume disruptions
- 3.5.1.2 Country-wise response
- 3.5.2 Impact on the industry
- 3.5.2.1 Supply-side impact (Cost of manufacturing)
- 3.5.2.1.1 Price volatility in key materials
- 3.5.2.1.2 Supply chain restructuring
- 3.5.2.1.3 Production cost implications
- 3.5.2.2 Demand-side impact (Cost to consumers)
- 3.5.2.2.1 Price transmission to end markets
- 3.5.2.2.2 Market share dynamics
- 3.5.2.2.3 Consumer response patterns
- 3.5.2.1 Supply-side impact (Cost of manufacturing)
- 3.5.3 Key companies impacted
- 3.5.4 Strategic industry responses
- 3.5.4.1 Supply chain reconfiguration
- 3.5.4.2 Pricing and product strategies
- 3.5.4.3 Policy engagement
- 3.5.5 Outlook and future considerations
- 3.5.1 Impact on trade
- 3.6 Pricing analysis
- 3.7 Technology landscape
- 3.8 Gap analysis
- 3.9 Porter's analysis
- 3.10 PESTEL analysis
Chapter 4 Competitive Landscape, 2024
- 4.1 Introduction
- 4.2 Company market share analysis
- 4.3 Company matrix analysis
- 4.4 Competitive positioning matrix
- 4.5 Strategy dashboard
Chapter 5 Market Estimates and Forecast, By Type, 2021 - 2034 ($ Mn and Units)
- 5.1 Key trends
- 5.2 Full-field flash ERG (ffERG)
- 5.3 Pattern ERG (PERG)
- 5.4 Multifocal ERG (mfERG)
Chapter 6 Market Estimates and Forecast, By Product, 2021 - 2034 ($ Mn and Units)
- 6.1 Key trends
- 6.2 Tabletop
- 6.3 Handheld
Chapter 7 Market Estimates and Forecast, By Application, 2021 - 2034 ($ Mn)
- 7.1 Key trends
- 7.2 Clinical diagnostics
- 7.3 Research
Chapter 8 Market Estimates and Forecast, By End Use, 2021 - 2034 ($ Mn)
- 8.1 Key trends
- 8.2 Hospitals and clinics
- 8.3 Ophthalmic centers
- 8.4 Research institutes
Chapter 9 Market Estimates and Forecast, By Region, 2021 - 2034 ($ Mn and Units)
- 9.1 Key trends
- 9.2 North America
- 9.2.1 U.S.
- 9.2.2 Canada
- 9.3 Europe
- 9.3.1 Germany
- 9.3.2 UK
- 9.3.3 France
- 9.3.4 Spain
- 9.3.5 Italy
- 9.3.6 Netherlands
- 9.4 Asia Pacific
- 9.4.1 China
- 9.4.2 Japan
- 9.4.3 India
- 9.4.4 Australia
- 9.4.5 South Korea
- 9.5 Latin America
- 9.5.1 Brazil
- 9.5.2 Mexico
- 9.5.3 Argentina
- 9.6 Middle East and Africa
- 9.6.1 South Africa
- 9.6.2 Saudi Arabia
- 9.6.3 UAE
Chapter 10 Company Profiles
- 10.1 an-vision
- 10.2 ChongQing SunKingdom Medical
- 10.3 CSO
- 10.4 Diagnosys
- 10.5 Diopsys
- 10.6 Electro-Diagnostic Imaging
- 10.7 Konan Medical USA
- 10.8 LKC Technologies
- 10.9 M&S Technologies
- 10.10 Metrovision
- 10.11 Roland Consult Stasche & Finger
 視網膜成像設備市場:2026-2032年全球市場預測(按設備類型、連接方式、便攜性、應用、最終用戶、適應症和分銷管道分類)
 全球圖市場規模、佔有率、趨勢和成長分析報告(2026-2034)智慧型影像設備市場按產品類型、應用、最終用戶和分銷管道分類 - 全球預測 2026-2032
 視網膜成像設備:全球市場佔有率和排名、總收入和需求預測(2025-2031年)
 全球視網膜電圖市場全球視網膜成像設備市場
 智慧型成像設備市場,按設備類型、按技術、按組件、按連接性、按應用、按國家和地區 - 2025 年至 2032 年全球行業分析、市場規模、市場佔有率和預測
 視網膜影像設備市場:依產品類型、依技術、依最終用戶、按地區全球視網膜電圖市場按類型、產品、應用、適應症、最終用戶和地區分類
 視網膜電圖 (ERG) 的全球市場:產業分析·規模·佔有率·成長·趨勢·預測 (2024-2031年)