


 |
市場調查報告書
商品編碼
1750311
鈣鈦礦市場機會、成長動力、產業趨勢分析及 2025 - 2034 年預測Perovskite Market Opportunity, Growth Drivers, Industry Trend Analysis, and Forecast 2025 - 2034 |
||||||
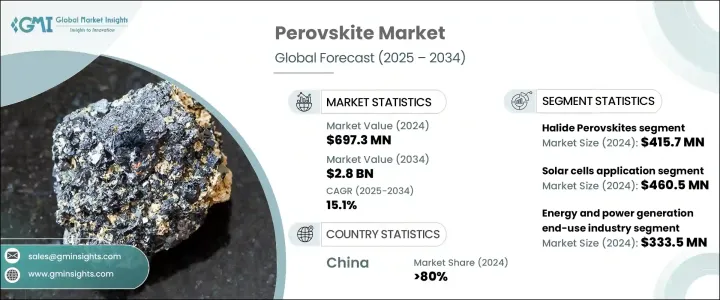
2024年,全球鈣鈦礦市場規模達6.973億美元,預計年複合成長率將達15.1%,2034年將達28億美元。這得歸功於全球對永續能源和材料創新日益成長的關注,尤其是在清潔能源應用領域。隨著能源基礎設施不斷調整以支援再生能源的整合,鈣鈦礦因其多功能性、輕量化特性以及與先進能源系統的兼容性而備受關注。這些材料在軟性高效薄膜配置中的出色性能,正在為太陽能、感測器和消費性電子產品領域開闢新的應用可能性。
持續的研發工作由公共和私營部門的舉措推動,這些舉措致力於加速能源轉型,尤其是在美國,政府支持的永續發展目標與光子學和半導體創新的投資相一致。人們對將矽與鈣鈦礦結合用於疊層太陽能電池的興趣日益濃厚,這有望超越傳統光伏電池的效率水平。其適應性也支持應用於攜帶式和穿戴式太陽能設備,滿足住宅和商業市場的需求。薄膜電子技術的快速創新促成了創新裝置設計,進一步提升了鈣鈦礦在面向未來技術的應用價值。
| 市場範圍 | |
|---|---|
| 起始年份 | 2024 |
| 預測年份 | 2025-2034 |
| 起始值 | 6.973億美元 |
| 預測值 | 28億美元 |
| 複合年成長率 | 15.1% |
2024年,鹵化物鈣鈦礦市場規模達4.157億美元,預計2034年將以16.7%的複合年成長率成長。這些材料憑藉其卓越的光吸收能力,在太陽能和光電應用中表現出色。它們在串聯太陽能配置中表現出色,持續吸引研究人員和商業開發者的注意。新興太陽能材料領域資金的穩定成長顯示全球對這些技術的信心十足。鹵化物鈣鈦礦領域的創新預計將加速高效能太陽能和光子學解決方案的進展。
太陽能電池領域在2024年佔據市場主導地位,規模達4.605億美元,佔66.1%,預計到2034年將以18%的複合年成長率成長。鈣鈦礦太陽能電池(尤其是在串聯結構中)的能量轉換效率不斷提高,推動了其在全球太陽能產業的應用。由於製造成本降低和可擴展的製造方法,技術正擴大被整合到住宅和公用事業規模項目中的太陽能電池板中。這一趨勢與全球向再生能源轉型的趨勢一致,預計太陽能將引領未來清潔能源投資。
2024年,中國鈣鈦礦市場佔據了80%的市場佔有率,這得益於全球關鍵零件(例如晶圓、電池和組件)的產能集中在中國境內。這種廣泛的控制不僅鞏固了其作為太陽能技術主要出口國的地位,也增強了其對包括鈣鈦礦在內的新興太陽能領域定價、可擴展性和創新速度的戰略影響力。中國在研發方面的積極投入、國家補貼以及垂直整合的製造生態系統使其能夠將下一代技術商業化。
該市場的頂尖公司包括 Frontier Materials、Swift Solar、Oxford PV、Saule Technologies 和 Microquanta Semiconductor。為了鞏固市場地位,領先公司專注於擴大產能,透過材料創新提高效率,並與能源供應商和研究機構建立策略夥伴關係。許多公司投資試點生產線,測試大規模部署的可行性,同時透過專利保護其智慧財產權,以保持競爭優勢。這些策略旨在滿足全球需求並鞏固長期市場地位。
目錄
第1章:方法論與範圍
第2章:執行摘要
第3章:行業洞察
- 產業生態系統分析
- 影響價值鏈的因素
- 利潤率分析
- 中斷
- 前景
- 製造商
- 經銷商
- 川普政府關稅
- 對貿易的影響
- 貿易量中斷
- 報復措施
- 對產業的影響
- 供給側影響(原料)
- 主要材料價格波動
- 供應鏈重組
- 生產成本影響
- 需求面影響(售價)
- 價格傳導至終端市場
- 市佔率動態
- 消費者反應模式
- 供給側影響(原料)
- 受影響的主要公司
- 策略產業反應
- 供應鏈重組
- 定價和產品策略
- 政策參與
- 展望與未來考慮
- 對貿易的影響
- 貿易統計資料(HS 編碼) 註:以上貿易統計僅提供主要國家。
- 主要出口國
- 主要進口國
- 利潤率分析
- 重要新聞和舉措
- 監管格局
- 衝擊力
- 成長動力
- 全球能源需求成長推動下一代光電應用
- 政府對清潔和分散能源系統的優惠獎勵措施
- 鈣鈦礦太陽能技術的卓越效率與成本優勢
- 增加發展中和偏遠地區的離網電氣化項目
- 產業陷阱與挑戰
- 鈣鈦礦材料在惡劣環境下的穩定性與耐久性問題
- 缺乏成熟的大規模製造和商業化基礎設施
- 成長動力
- 成長潛力分析
- 波特的分析
- PESTEL分析
第4章:競爭格局
- 競爭格局
- 公司概況
- 產品組合和規格
- SWOT分析
- 公司市佔率分析
- 各公司全球市場佔有率
- 區域市佔率分析
- 產品組合佔有率分析
- 策略舉措
- 併購
- 夥伴關係和合作
- 產品發布和創新
- 擴張計劃和投資
- 公司標竿分析
- 產品創新標竿分析
- 定價策略比較
- 配電網路比較
- 客戶服務和支援比較
第5章:市場估計與預測:依材料類型,2021-2034
- 主要趨勢
- 鹵化物鈣鈦礦
- 有機-無機雜化鹵化物鈣鈦礦
- 全無機鹵化物鈣鈦礦
- 鉛基鹵化物鈣鈦礦
- 無鉛鹵化物鈣鈦礦
- 氧化物鈣鈦礦
- 鈦酸鹽基氧化物鈣鈦礦
- 鐵電氧化物鈣鈦礦
- 其他氧化物鈣鈦礦
- 其他鈣鈦礦材料
- 雙鈣鈦礦
- 層狀鈣鈦礦
- 鈣鈦礦啟發材料
第6章:市場估計與預測:按應用,2021-2034
- 主要趨勢
- 太陽能電池
- 單結鈣鈦礦太陽能電池
- 串聯鈣鈦礦-矽太陽能電池
- 軟性鈣鈦礦太陽能電池
- 建築一體化光伏(bipv)
- 空間應用
- 發光二極體(LED)
- 顯示技術
- 照明應用
- 光電探測器和感測器
- X光偵測器
- 光電探測器
- 氣體感測器
- 壓力感測器
- 雷射和光學應用
- 儲能設備
- 量子計算應用
- 其他應用
- 催化
- 熱電裝置
- 神經形態計算
第7章:市場估計與預測:按最終用途產業,2021-2034 年
- 主要趨勢
- 能源和發電
- 電子與光電子
- 建築和建築材料
- 汽車和運輸
- 航太和國防
- 醫療保健和醫療器械
- 電信
- 其他
第8章:市場估計與預測:按地區,2021-2034
- 主要趨勢
- 北美洲
- 美國
- 加拿大
- 歐洲
- 德國
- 英國
- 法國
- 西班牙
- 義大利
- 歐洲其他地區
- 亞太地區
- 中國
- 印度
- 日本
- 澳洲
- 韓國
- 亞太其他地區
- 拉丁美洲
- 巴西
- 墨西哥
- 阿根廷
- 拉丁美洲其他地區
- 中東和非洲
- 沙烏地阿拉伯
- 南非
- 阿拉伯聯合大公國
- 中東和非洲其他地區
第9章:公司簡介
- Oxford PV
- Saule Technologies
- Microquanta Semiconductor
- Swift Solar
- Frontier Materials
- Toshiba
- Panasonic
- Sekisui Chemical
- Hanwha Vision
- GCL Suzhou Nanotechnology
- EneCoat Technologies
- Kaneka Corporation
- Aisin Corporation
- UtmoLight
- Wonder Solar
- Other Notable Players
The Global Perovskite Market was valued at USD 697.3 million in 2024 and is estimated to grow at a CAGR of 15.1% to reach USD 2.8 billion by 2034, driven by the rising global attention toward sustainable energy and material innovation in the spotlight, especially in clean energy applications. As energy infrastructures adapt to support renewable integration, perovskites are gaining traction due to their versatility, lightweight properties, and compatibility with advanced energy systems. These materials are unlocking new possibilities in solar power, sensors, and consumer electronics thanks to their strong performance in flexible and efficient thin-film configurations.
Ongoing R&D is driven by public and private initiatives focused on accelerating energy transformation, particularly in the United States, where government-backed sustainability targets align with investments in photonics and semiconductor innovation. Interest is growing in combining silicon with perovskite for tandem solar cell use, offering potential to exceed the efficiency levels of traditional photovoltaics. Their adaptability also supports applications in portable and wearable solar devices, addressing demand from residential and commercial markets. Rapid innovation in thin-film electronics enables creative device designs, further increasing the relevance of perovskites in future-facing technologies.
| Market Scope | |
|---|---|
| Start Year | 2024 |
| Forecast Year | 2025-2034 |
| Start Value | $697.3 Million |
| Forecast Value | $2.8 Billion |
| CAGR | 15.1% |
In 2024, halide perovskites generated USD 415.7 million and are expected to grow at a CAGR of 16.7% through 2034. These materials are proving especially effective in solar and optoelectronic applications because of their exceptional light absorption capabilities. Their ability to perform well in tandem solar configurations continues to draw attention from researchers and commercial developers. A steady increase in funding for emerging solar materials indicates robust global confidence in these technologies. Innovations involving halide perovskites are expected to accelerate progress in high-efficiency solar and photonics solutions.
The solar cell segment dominated the market with USD 460.5 million in 2024, holding a 66.1% share and anticipated to grow at 18% CAGR through 2034. The improved energy conversion efficiency of perovskite solar cells, especially in tandem configurations, propels their use in the global solar industry. Technology is increasingly being integrated into solar panels used in both residential and utility-scale projects due to reduced manufacturing costs and scalable fabrication methods. This trend aligns with the global transition toward renewable energy, with solar projected to lead future clean energy investments.
China Perovskite Market held 80% share in 2024, driven by the world's manufacturing capacity for critical components, such as wafers, cells, and modules, concentrated within its borders. This extensive control not only strengthens its position as the primary exporter of solar technologies but also reinforces its strategic influence over the pricing, scalability, and innovation pace across emerging solar segments, including perovskites. China's aggressive investments in R&D, state-backed subsidies, and vertically integrated manufacturing ecosystems enable it to commercialize next-generation technologies.
Top companies in this market include Frontier Materials, Swift Solar, Oxford PV, Saule Technologies, and Microquanta Semiconductor. To secure their positions, leading companies focus on scaling production capabilities, enhancing efficiency through material innovation, and forming strategic partnerships with energy providers and research institutions. Many invest in pilot production lines to test large-scale deployment viability while protecting their IP through patents to maintain a competitive advantage. These strategies are designed to meet global demand and reinforce long-term market presence.
Table of Contents
Chapter 1 Methodology & Scope
- 1.1 Market scope & definitions
- 1.2 Base estimates & calculations
- 1.3 Forecast calculations
- 1.4 Data sources
- 1.4.1 Primary
- 1.4.2 Secondary
- 1.4.2.1 Paid sources
- 1.4.2.2 Public sources
Chapter 2 Executive Summary
- 2.1 Industry synopsis, 2021-2034
Chapter 3 Industry Insights
- 3.1 Industry ecosystem analysis
- 3.1.1 Factor affecting the value chain
- 3.1.2 Profit margin analysis
- 3.1.3 Disruptions
- 3.1.4 Outlook
- 3.1.5 Manufacturers
- 3.1.6 Distributors
- 3.2 Trump administration tariffs
- 3.2.1 Impact on trade
- 3.2.1.1 Trade volume disruptions
- 3.2.1.2 Retaliatory measures
- 3.2.2 Impact on the industry
- 3.2.2.1 Supply-side impact (raw materials)
- 3.2.2.1.1 Price volatility in key materials
- 3.2.2.1.2 Supply chain restructuring
- 3.2.2.1.3 Production cost implications
- 3.2.2.2 Demand-side impact (selling price)
- 3.2.2.2.1 Price transmission to end markets
- 3.2.2.2.2 Market share dynamics
- 3.2.2.2.3 Consumer response patterns
- 3.2.2.1 Supply-side impact (raw materials)
- 3.2.3 Key companies impacted
- 3.2.4 Strategic industry responses
- 3.2.4.1 Supply chain reconfiguration
- 3.2.4.2 Pricing and product strategies
- 3.2.4.3 Policy engagement
- 3.2.5 Outlook and Future Considerations
- 3.2.1 Impact on trade
- 3.3 Trade statistics (HS Code) Note: the above trade statistics will be provided for key countries only.
- 3.3.1 Major exporting countries
- 3.3.2 Major importing countries
- 3.4 Profit margin analysis
- 3.5 Key news & initiatives
- 3.6 Regulatory landscape
- 3.7 Impact forces
- 3.7.1 Growth drivers
- 3.7.1.1 Rising global energy demand driving next-generation photovoltaic adoption
- 3.7.1.2 Favorable government incentives for clean and decentralized energy systems
- 3.7.1.3 Superior efficiency and cost advantages of perovskite-based solar technologies
- 3.7.1.4 Increasing off-grid electrification projects in developing and remote regions
- 3.7.2 Industry pitfalls & challenges
- 3.7.2.1 Stability and durability concerns of perovskite materials in harsh environments
- 3.7.2.2 Lack of established large-scale manufacturing and commercialization infrastructure
- 3.7.1 Growth drivers
- 3.8 Growth potential analysis
- 3.9 Porter's analysis
- 3.10 PESTEL analysis
Chapter 4 Competitive Landscape, 2024
- 4.1 Competitive landscape
- 4.1.1 Company overview
- 4.1.2 Product portfolio and specifications
- 4.1.3 Swot analysis
- 4.2 Company market share analysis, 2024
- 4.2.1 Global market share by company
- 4.2.2 Regional market share analysis
- 4.2.3 Product portfolio share analysis
- 4.3 Strategic initiative
- 4.3.1 Mergers and acquisitions
- 4.3.2 Partnerships and collaborations
- 4.3.3 Product launches and innovations
- 4.3.4 Expansion plans and investments
- 4.4 Company benchmarking
- 4.4.1 Product innovation benchmarking
- 4.4.2 Pricing strategy comparison
- 4.4.3 Distribution network comparison
- 4.4.4 Customer service and support comparison
Chapter 5 Market Estimates & Forecast, By Material Type, 2021-2034 (USD Million) (Kilo Tons)
- 5.1 Key trends
- 5.2 Halide perovskites
- 5.2.1 Organic-inorganic hybrid halide perovskites
- 5.2.2 All-inorganic halide perovskites
- 5.2.3 Lead-based halide perovskites
- 5.2.4 Lead-free halide perovskites
- 5.3 Oxide perovskites
- 5.3.1 Titanate-based oxide perovskites
- 5.3.2 Ferroelectric oxide perovskites
- 5.3.3 Other oxide perovskites
- 5.4 Other perovskite materials
- 5.4.1 Double perovskites
- 5.4.2 Layered perovskites
- 5.4.3 Perovskite-inspired materials
Chapter 6 Market Estimates & Forecast, By Application, 2021-2034 (USD Million) (Kilo Tons)
- 6.1 Key trends
- 6.2 Solar cells
- 6.2.1 Single-junction perovskite solar cells
- 6.2.2 Tandem perovskite-silicon solar cells
- 6.2.3 Flexible perovskite solar cells
- 6.2.4 Building-integrated photovoltaics (bipv)
- 6.2.5 Space applications
- 6.3 Light-emitting diodes (leds)
- 6.3.1 Display technologies
- 6.3.2 Lighting applications
- 6.4 Photodetectors and sensors
- 6.4.1 X-ray detectors
- 6.4.2 Photodetectors
- 6.4.3 Gas sensors
- 6.4.4 Pressure sensors
- 6.5 Lasers and optical applications
- 6.6 Energy storage devices
- 6.7 Quantum computing applications
- 6.8 Other applications
- 6.8.1 Catalysis
- 6.8.2 Thermoelectric devices
- 6.8.3 Neuromorphic computing
Chapter 7 Market Estimates & Forecast, By End Use Industry, 2021-2034 (USD Million) (Kilo Tons)
- 7.1 Key trends
- 7.2 Energy and power generation
- 7.3 Electronics and optoelectronics
- 7.4 Construction and building materials
- 7.5 Automotive and transportation
- 7.6 Aerospace and defense
- 7.7 Healthcare and medical devices
- 7.8 Telecommunications
- 7.9 Others
Chapter 8 Market Estimates & Forecast, By Region, 2021-2034 (USD Million) (Kilo Tons)
- 8.1 Key trends
- 8.2 North America
- 8.2.1 U.S.
- 8.2.2 Canada
- 8.3 Europe
- 8.3.1 Germany
- 8.3.2 UK
- 8.3.3 France
- 8.3.4 Spain
- 8.3.5 Italy
- 8.3.6 Rest of Europe
- 8.4 Asia Pacific
- 8.4.1 China
- 8.4.2 India
- 8.4.3 Japan
- 8.4.4 Australia
- 8.4.5 South Korea
- 8.4.6 Rest of Asia Pacific
- 8.5 Latin America
- 8.5.1 Brazil
- 8.5.2 Mexico
- 8.5.3 Argentina
- 8.5.4 Rest of Latin America
- 8.6 Middle East and Africa
- 8.6.1 Saudi Arabia
- 8.6.2 South Africa
- 8.6.3 UAE
- 8.6.4 Rest of Middle East and Africa
Chapter 9 Company Profiles
- 9.1 Oxford PV
- 9.2 Saule Technologies
- 9.3 Microquanta Semiconductor
- 9.4 Swift Solar
- 9.5 Frontier Materials
- 9.6 Toshiba
- 9.7 Panasonic
- 9.8 Sekisui Chemical
- 9.9 Hanwha Vision
- 9.10 GCL Suzhou Nanotechnology
- 9.11 EneCoat Technologies
- 9.12 Kaneka Corporation
- 9.13 Aisin Corporation
- 9.14 UtmoLight
- 9.15 Wonder Solar
- 9.16 Other Notable Players
 鈣鈦礦太陽能電池市場:2026-2032年全球市場預測(按類型、產品形式、類別、架構、結構、製造技術、吸收層成分、製造平台、應用和最終用戶分類)
 2026年鈣鈦礦太陽能電池全球市場報告
 鈣鈦礦太陽能電池全球市場規模、佔有率、趨勢和成長分析報告(2026-2034)
 全球鈣鈦礦太陽能電池市場:依產品類型、組件類型、結構、應用和地區劃分-市場規模、產業動態、機會分析和預測(2026-2035 年)
 鈣鈦礦太陽能電池市場-全球產業規模、佔有率、趨勢、機會和預測,按結構、產品、方法、應用、最終用途、地區和競爭格局分類,2020-2030年預測
 鈣鈦礦太陽能電池市場機會、成長促進因素、產業趨勢分析及預測(2025-2034年)
 2032 年鈣鈦礦太陽能電池市場預測:按類型、基板材料、層類型、技術、應用、最終用戶和地區分類的全球分析2032 年鈣鈦礦材料市場預測:按類型、成分、應用、最終用戶和地區進行的全球分析
 鈣鈦礦太陽能電池的全球市場
 鈣鈦礦太陽能電池市場規模、佔有率、趨勢分析報告:按產品、應用、產業、地區和細分市場預測,2025 年至 2030 年