


 |
市場調查報告書
商品編碼
1750307
共乘即服務市場機會、成長動力、產業趨勢分析及 2025 - 2034 年預測Carpool-as-a-Service Market Opportunity, Growth Drivers, Industry Trend Analysis, and Forecast 2025 - 2034 |
||||||
2024年,全球共乘即服務 (CaaS) 市場規模達179億美元,預計到2034年將以10.6%的複合年成長率成長,達到477億美元。受城市交通堵塞加劇、環境永續意識增強以及消費者對經濟實惠的共享交通解決方案日益成長的青睞等因素推動,該市場正呈現強勁成長勢頭。隨著城市數位化程度不斷提高,永續發展成為首要目標,私人營運商、市政交通機構和企業出行計畫正將共乘融入多模式交通系統。這種整合正在應對交通堵塞、油耗和通勤成本等關鍵挑戰,同時滿足當今出行用戶不斷變化的需求。
共乘即服務 (CaaS) 的需求正在各種用例中不斷成長,包括日常通勤、員工接駁車、長途旅行以及活動交通。基於應用程式的預訂、即時匹配和最佳化路線的便利性,使共乘成為替代單人用車的可行且具有吸引力的替代方案。企業正在採用這些平台來改善員工交通,減輕車隊管理負擔,並履行其環境、社會和治理 (ESG) 承諾。共乘在上班族、學生和城市居民中的廣泛吸引力,持續支撐著它在城市中心和不斷擴張的郊區的日常應用。
| 市場範圍 | |
|---|---|
| 起始年份 | 2024 |
| 預測年份 | 2025-2034 |
| 起始值 | 179億美元 |
| 預測值 | 477億美元 |
| 複合年成長率 | 10.6% |
先進技術是CaaS發展的關鍵推動力。人工智慧、GPS追蹤、即時路線規劃、應用程式內支付以及基於演算法的出行匹配等領域的創新,正在提升服務效率和客戶滿意度。這些解決方案正被整合到更廣泛的出行即服務 (MaaS) 平台中,將共乘與數位錢包、即時公共交通資料和智慧城市基礎設施連接起來。這種程度的互通性對於建立完全互聯的城市交通生態系統至關重要。
就平台而言,市場細分為行動應用程式、混合系統和基於 Web 的解決方案。行動應用程式引領市場,2024 年營收約 113 億美元。智慧型手機使用率的提高、行動網際網路的普及以及對即時共享出行解決方案日益成長的需求,推動了這一細分市場的主導地位。這些應用程式提供方便用戶使用的介面,並可方便地存取行程安排、即時追蹤和數位支付等功能。服務提供者專注於以行動為中心的策略,透過個人化通知、特定位置服務和流暢的導航來提高用戶參與度,從而提升忠誠度和用戶留存率。行動應用程式還可與車聯網系統和語音助理整合,實現免持交互、即時交通洞察和客製化通勤建議。此外,行動優先模式能夠以最小的基礎設施需求快速擴展,使服務供應商能夠有效率地啟動和擴展業務。
市場也按類型細分為點對點 (P2P)、企業對消費者 (B2C) 和其他模式。 P2P 細分市場在 2024 年佔據最大佔有率,為 60%。人們對去中心化共乘網路的興趣日益濃厚,這種網路透過數位平台將私人車主與乘客直接聯繫起來,這支撐了這個細分市場的成長。這種安排降低了開銷,提供了靈活性,並允許個人將車輛的閒置容量貨幣化。它吸引了尋求節省成本的日常通勤者和尋求額外收入的司機。 P2P 平台配備了智慧乘車匹配、安全支付和直接應用內部通訊等功能,可增強用戶信心並簡化乘車協調。隨著城市中心的發展和通勤需求的增加,P2P 服務持續受到歡迎,尤其是在學生、自由工作者和城市專業人士中。
從商業模式的角度來看,CaaS 市場包括佣金制、訂閱制、免費增值和其他收入策略。佣金制模式在 2024 年佔據了市場主導地位,因為它具有可擴展的結構,允許平台從每筆完成的行程中賺取一定比例的收入。該模式以極低的前期投資支援成長,對用戶和服務提供者都具有吸引力。它鼓勵臨時用戶和兼職司機廣泛參與,無需昂貴的入職培訓或車隊投資。由於其簡單易用、營運成本低且適應不同市場,該模式被廣泛應用,尤其適用於採用輕資產框架營運的平台。
根據應用,市場分為日常通勤、長途旅行、機場接送、活動旅行和其他。 2024年,日常通勤成為主要細分市場,佔據了最高的收入佔有率。隨著城市堵塞加劇、油價上漲以及消費者對環保通勤替代方案的意識增強,這一細分市場正在不斷擴大。共乘有助於緩解交通壓力、減少排放並降低通勤費用。專業人士、學生和零工等使用者經常依賴這些服務,尤其是在車輛密度高、停車位有限的城市。 GPS輔助路線規劃和行動支付等功能提高了可靠性,尤其是在尖峰時段。企業和機構擴大透過提供獎勵並將共享乘車服務整合到內部移動系統中來推廣日常共乘。
從地區來看,美國引領北美市場,2024 年市場規模達 52 億美元,預估預測期內複合年成長率為 10.9%。美國的成長動力源自於智慧型手機的高普及率、完善的數位基礎設施以及龐大的通勤人口。全美各大城市都面臨日常交通挑戰,對替代交通解決方案的需求強勁。多家提供先進數位解決方案的服務供應商的存在也支持了其廣泛應用。政府鼓勵永續交通的政策,加上共乘車道的開放和共享汽車通行費的降低,進一步激勵了 CaaS 的使用。隨著企業持續投資於基於雲端的系統、預測分析和人工智慧驅動的工具,以提升乘客體驗、營運效率和環境績效,市場正在快速發展。
目錄
第1章:方法論與範圍
第2章:執行摘要
第3章:行業洞察
- 產業生態系統分析
- 供應商格局
- 原物料供應商
- 組件提供者
- 製造商
- 技術提供者
- 配銷通路分析
- 最終用途
- 利潤率分析
- 供應商格局
- 川普政府關稅的影響
- 對貿易的影響
- 貿易量中斷
- 報復措施
- 對產業的影響
- 供給側影響(原料)
- 主要材料價格波動
- 供應鏈重組
- 生產成本影響
- 需求面影響(售價)
- 價格傳導至終端市場
- 市佔率動態
- 消費者反應模式
- 供給側影響(原料)
- 策略產業反應
- 供應鏈重組
- 定價和產品策略
- 對貿易的影響
- 技術與創新格局
- 專利分析
- 監管格局
- 成本細分分析
- 重要新聞和舉措
- 衝擊力
- 成長動力
- 城市擁擠與污染減少
- 政府支持與政策推動
- 為用戶節省成本
- 技術和平台成熟度
- 產業陷阱與挑戰
- 入住率低和可靠性問題
- 使用者信任與安全問題
- 成長動力
- 成長潛力分析
- 波特的分析
- PESTEL分析
第4章:競爭格局
- 介紹
- 公司市佔率分析
- 競爭定位矩陣
- 戰略展望矩陣
第5章:市場估計與預測:依商業模式,2021 - 2034 年
- 主要趨勢
- 佣金制模式
- 基於訂閱的模式
- 免費增值模式
- 其他
第6章:市場估計與預測:依平台,2021 - 2034 年
- 主要趨勢
- 行動應用程式
- 混合
- 網路為基礎的平台
第7章:市場估計與預測:按類型,2021 - 2034
- 主要趨勢
- 點對點(P2P)
- 企業對消費者(B2C)
- 其他
第8章:市場估計與預測:按應用,2021 - 2034 年
- 主要趨勢
- 日常通勤
- 長途旅行
- 機場接送
- 基於活動的旅行
- 其他
第9章:市場估計與預測:按地區,2021 - 2034 年
- 主要趨勢
- 北美洲
- 美國
- 加拿大
- 歐洲
- 德國
- 法國
- 英國
- 西班牙
- 義大利
- 俄羅斯
- 北歐人
- 亞太地區
- 中國
- 印度
- 日本
- 韓國
- 澳新銀行
- 東南亞
- 拉丁美洲
- 巴西
- 墨西哥
- 阿根廷
- MEA
- 阿拉伯聯合大公國
- 南非
- 沙烏地阿拉伯
第10章:公司簡介
- Berymo
- BlaBlaCar
- Carma
- DiDi
- Getaround
- Gojek Tech
- Grab.
- Liftshare
- Lyft
- Motar
- Ola Cabs
- Poparide
- Quick Ride
- Scoop
- Splt
- Trempy
- Uber
- Via.
- Waze Carpool
- Zimride
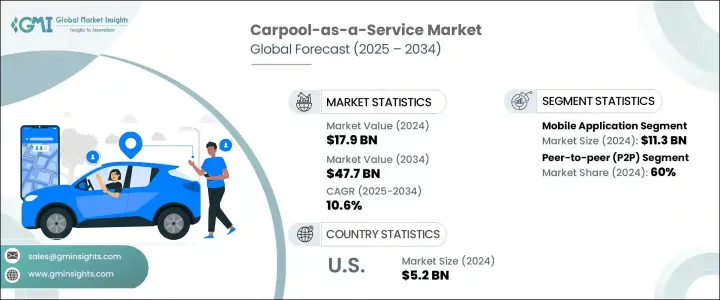
The Global Carpool-As-A-Service (CaaS) Market was valued at USD 17.9 billion in 2024 and is estimated to grow at a CAGR of 10.6% to reach USD 47.7 billion by 2034. The market is experiencing robust momentum, propelled by increasing urban congestion, heightened awareness of environmental sustainability, and a growing preference for affordable, shared transportation solutions. As cities become more digitally connected and sustainability becomes a primary objective, carpooling is being integrated into multimodal transport systems by private operators, municipal transit agencies, and corporate mobility programs. This integration is addressing key challenges such as traffic congestion, fuel consumption, and commuting costs while meeting the evolving needs of today's mobility users.
Demand for CaaS is expanding across various use cases, including routine commuting, employee shuttles, long-haul rides, and transportation for events. The convenience of app-based bookings, instant ride-matching, and optimized routing has positioned carpooling as a viable and attractive alternative to single-occupancy vehicle use. Businesses are adopting these platforms to improve employee transportation, reduce fleet management burdens, and align with environmental, social, and governance (ESG) commitments. The widespread appeal of shared rides among workers, students, and city dwellers continues to support daily adoption in both urban centers and expanding suburban regions.
| Market Scope | |
|---|---|
| Start Year | 2024 |
| Forecast Year | 2025-2034 |
| Start Value | $17.9 Billion |
| Forecast Value | $47.7 Billion |
| CAGR | 10.6% |
Advanced technology is a key enabler in the development of CaaS. Innovations in artificial intelligence, GPS tracking, real-time route mapping, in-app payments, and algorithm-based ride matching are driving service efficiency and customer satisfaction. These solutions are being integrated into broader mobility-as-a-service (MaaS) platforms, linking carpooling to digital wallets, real-time public transit data, and smart city infrastructure. This level of interoperability is critical for building a fully connected urban transport ecosystem.
In terms of platforms, the market is segmented into mobile applications, hybrid systems, and web-based solutions. Mobile applications led the market, with revenue reaching approximately USD 11.3 billion in 2024. The dominance of this segment is fueled by increasing smartphone usage, widespread mobile internet access, and growing demand for real-time ride-sharing solutions. These applications offer a user-friendly interface and convenient access to features like ride scheduling, live tracking, and digital payments. Service providers are focusing on mobile-centric strategies that improve user engagement through personalized notifications, location-specific services, and smooth navigation, all of which enhance loyalty and user retention. Mobile apps also integrate with connected vehicle systems and voice assistants, allowing for hands-free interaction, real-time traffic insights, and tailored commuting suggestions. Additionally, the mobile-first model enables rapid expansion with minimal infrastructure requirements, allowing providers to launch and scale efficiently.
The market is also segmented by type into peer-to-peer (P2P), business-to-consumer (B2C), and other models. The P2P segment accounted for the largest share at 60% in 2024. The growth of this segment is underpinned by rising interest in decentralized ride-sharing networks that connect private vehicle owners with passengers directly through digital platforms. This arrangement reduces overhead, offers flexibility, and allows individuals to monetize their vehicle's idle capacity. It appeals to daily commuters seeking cost savings and drivers looking for extra income. P2P platforms come equipped with features such as intelligent ride matching, secure payments, and direct in-app communication, which strengthen user confidence and simplify ride coordination. As urban centers grow and commuting demand increases, P2P services continue to gain popularity, especially among students, freelancers, and urban professionals.
From a business model standpoint, the CaaS market includes commission-based, subscription-based, freemium, and other revenue strategies. The commission-based model dominated the market in 2024 due to its scalable structure that allows platforms to earn a percentage of each completed ride. This model supports growth with minimal upfront investment, making it attractive for both users and providers. It encourages broad participation from casual users and part-time drivers without the need for expensive onboarding or fleet investments. The structure is widely used due to its simplicity, low operational costs, and adaptability across different markets, especially for platforms that operate with asset-light frameworks.
By application, the market is divided into daily commuting, long-distance travel, airport transfers, event-based travel, and others. Daily commuting emerged as the leading segment in 2024, accounting for the highest revenue share. This segment is expanding as urban congestion worsens, fuel prices rise, and consumers become more conscious of eco-friendly commuting alternatives. Carpooling helps reduce traffic pressure, cut emissions, and lower commuting expenses. Users such as professionals, students, and gig workers regularly rely on these services, especially in cities with high vehicle density and limited parking. Features like GPS-assisted route planning and mobile payments improve reliability, particularly during peak hours. Businesses and institutions are increasingly promoting daily carpooling by offering incentives and integrating shared rides into internal mobility systems.
Regionally, the United States led the North American market, generating USD 5.2 billion in 2024 and projected to grow at a CAGR of 10.9% during the forecast period. Growth in the U.S. is driven by high smartphone adoption, established digital infrastructure, and a large commuting population. Major cities across the country face daily traffic challenges, creating strong demand for alternative transit solutions. The presence of multiple service providers offering advanced digital solutions also supports widespread adoption. Government policies encouraging sustainable transportation, combined with access to carpool lanes and reduced tolls for shared vehicles, further incentivize CaaS usage. The market is evolving rapidly as companies continue to invest in cloud-based systems, predictive analytics, and AI-driven tools that enhance rider experience, operational efficiency, and environmental performance.
Table of Contents
Chapter 1 Methodology & Scope
- 1.1 Research design
- 1.1.1 Research approach
- 1.1.2 Data collection methods
- 1.2 Base estimates & calculations
- 1.2.1 Base year calculation
- 1.2.2 Key trends for market estimation
- 1.3 Forecast model
- 1.4 Primary research and validation
- 1.4.1 Primary sources
- 1.4.2 Data mining sources
- 1.5 Market scope & definition
Chapter 2 Executive Summary
- 2.1 Industry 3600 synopsis, 2021 - 2034
Chapter 3 Industry Insights
- 3.1 Industry ecosystem analysis
- 3.1.1 Supplier landscape
- 3.1.1.1 Raw material providers
- 3.1.1.2 Component providers
- 3.1.1.3 Manufacturers
- 3.1.1.4 Technology providers
- 3.1.1.5 Distribution channel analysis
- 3.1.1.6 End use
- 3.1.2 Profit margin analysis
- 3.1.1 Supplier landscape
- 3.2 Impact of Trump administration tariffs
- 3.2.1 Impact on trade
- 3.2.1.1 Trade volume disruptions
- 3.2.1.2 Retaliatory measures
- 3.2.2 Impact on industry
- 3.2.2.1 Supply-side impact (raw materials)
- 3.2.2.1.1 Price volatility in key materials
- 3.2.2.1.2 Supply chain restructuring
- 3.2.2.1.3 Production cost implications
- 3.2.2.2 Demand-side impact (selling price)
- 3.2.2.2.1 Price transmission to end markets
- 3.2.2.2.2 Market share dynamics
- 3.2.2.2.3 Consumer response patterns
- 3.2.2.1 Supply-side impact (raw materials)
- 3.2.3 Strategic industry responses
- 3.2.3.1 Supply chain reconfiguration
- 3.2.3.2 Pricing and product strategies
- 3.2.1 Impact on trade
- 3.3 Technology & innovation landscape
- 3.4 Patent analysis
- 3.5 Regulatory landscape
- 3.6 Cost breakdown analysis
- 3.7 Key news & initiatives
- 3.8 Impact forces
- 3.8.1 Growth drivers
- 3.8.1.1 Urban congestion and pollution reduction
- 3.8.1.2 Government support and policy push
- 3.8.1.3 Cost savings for users
- 3.8.1.4 Technology and platform maturity
- 3.8.2 Industry pitfalls & challenges
- 3.8.2.1 Low occupancy and reliability issues
- 3.8.2.2 User trust and safety concerns
- 3.8.1 Growth drivers
- 3.9 Growth potential analysis
- 3.10 Porter's analysis
- 3.11 PESTEL analysis
Chapter 4 Competitive Landscape, 2024
- 4.1 Introduction
- 4.2 Company market share analysis
- 4.3 Competitive positioning matrix
- 4.4 Strategic outlook matrix
Chapter 5 Market Estimates & Forecast, By Business Model, 2021 - 2034 ($Bn)
- 5.1 Key trends
- 5.2 Commission-Based model
- 5.3 Subscription-Based model
- 5.4 Freemium model
- 5.5 Others
Chapter 6 Market Estimates & Forecast, By Platform, 2021 - 2034 ($Bn)
- 6.1 Key trends
- 6.2 Mobile application
- 6.3 Hybrid
- 6.4 Web-based platform
Chapter 7 Market Estimates & Forecast, By Type, 2021 - 2034 ($Bn)
- 7.1 Key trends
- 7.2 Peer-to-Peer (P2P)
- 7.3 Business-to-Consumer (B2C)
- 7.4 Others
Chapter 8 Market Estimates & Forecast, By Application, 2021 - 2034 ($Bn)
- 8.1 Key trends
- 8.2 Daily commuting
- 8.3 Long-Distance travel
- 8.4 Airport transfers
- 8.5 Event-Based travel
- 8.6 Others
Chapter 9 Market Estimates & Forecast, By Region, 2021 - 2034 ($Bn, Units)
- 9.1 Key trends
- 9.2 North America
- 9.2.1 U.S.
- 9.2.2 Canada
- 9.3 Europe
- 9.3.1 Germany
- 9.3.2 France
- 9.3.3 UK
- 9.3.4 Spain
- 9.3.5 Italy
- 9.3.6 Russia
- 9.3.7 Nordics
- 9.4 Asia Pacific
- 9.4.1 China
- 9.4.2 India
- 9.4.3 Japan
- 9.4.4 South Korea
- 9.4.5 ANZ
- 9.4.6 Southeast Asia
- 9.5 Latin America
- 9.5.1 Brazil
- 9.5.2 Mexico
- 9.5.3 Argentina
- 9.6 MEA
- 9.6.1 UAE
- 9.6.2 South Africa
- 9.6.3 Saudi Arabia
Chapter 10 Company Profiles
- 10.1 Berymo
- 10.2 BlaBlaCar
- 10.3 Carma
- 10.4 DiDi
- 10.5 Getaround
- 10.6 Gojek Tech
- 10.7 Grab.
- 10.8 Liftshare
- 10.9 Lyft
- 10.10 Motar
- 10.11 Ola Cabs
- 10.12 Poparide
- 10.13 Quick Ride
- 10.14 Scoop
- 10.15 Splt
- 10.16 Trempy
- 10.17 Uber
- 10.18 Via.
- 10.19 Waze Carpool
- 10.20 Zimride