


 |
市場調查報告書
商品編碼
1750284
太陽能光電回收市場機會、成長動力、產業趨勢分析及2025-2034年預測Solar PV Recycling Market Opportunity, Growth Drivers, Industry Trend Analysis, and Forecast 2025 - 2034 |
||||||
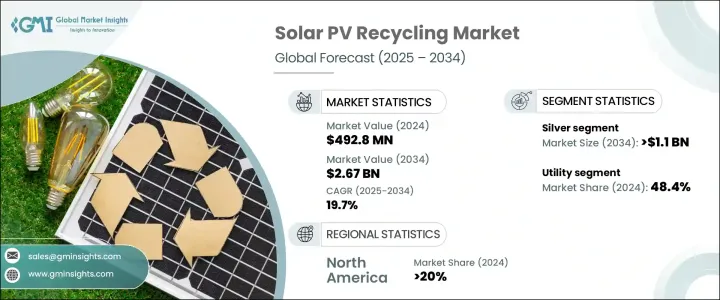
2024年,全球太陽能光電回收市場規模達4.928億美元,預計到2034年將以19.7%的複合年成長率成長,達到26.7億美元。這得歸功於全球日益增強的環境永續意識,以及管理日益增加的太陽能光電廢棄物的迫切需求。隨著越來越多二、三十年前安裝的光電板達到生命週期的終點,市場對高效率回收流程的需求激增。各國政府、環保機構和私人利益相關者正在推動改善回收基礎設施,以防止垃圾掩埋場的堆積,並回收電池板生產過程中使用的關鍵材料。
太陽能產業對高純度矽、銦和銀等有限資源的依賴,推動了回收創新的進一步發展。地緣政治動盪加劇以及全球供應鏈中斷,加劇了人們對國內材料回收的興趣,認為這不僅能增強供應安全,還能支持環境目標。企業正在轉向先進的回收技術,以最佳化成本並減少浪費。現代科技正在幫助製造商回收有價值的材料,同時符合循環經濟政策,進一步推動市場發展。
| 市場範圍 | |
|---|---|
| 起始年份 | 2024 |
| 預測年份 | 2025-2034 |
| 起始值 | 4.928億美元 |
| 預測值 | 26.7億美元 |
| 複合年成長率 | 19.7% |
2024年,銅的市佔率高達17.3%,這得益於其日益稀缺的材質和持續的高市場回收價值。銅是太陽能電池板和整個再生能源系統的關鍵組成部分,因此從退役太陽能板中回收銅已成為回收商的首要任務。隨著全球減少對採礦業依賴和支持循環經濟的壓力日益增大,從廢棄太陽能板中提取銅既能帶來環境效益,又能帶來經濟效益。
預計到2034年,住宅太陽能市場將創造8.01億美元的市場價值,這得益於消費者對太陽能廢棄物環境影響意識的不斷增強。越來越多的屋主尋求永續的解決方案,將太陽能板回收納入住宅太陽能系統正逐漸成為常態。國家關於電子和危險廢物處理的規定,以及稅收抵免和回收計劃,正在強化這種做法。隨著消費者優先考慮環保能源系統,回收商正利用這一轉變,提供家庭友善、合規且經濟高效的回收服務,以延長太陽能組件的使用壽命。
到2034年,亞太地區太陽能光電回收市場將創造11.2億美元的產值,這得益於中國、日本和印度等國家廣泛建立的太陽能基礎設施,以及大量過時或故障的太陽能板。日益嚴峻的廢棄物挑戰正促使該地區的政府和私人企業投資建造在地化的回收設施。這些措施不僅有助於實現國家永續發展目標,還能創造新的就業機會,並推動區域製造業生態系統的發展。
全球太陽能光電回收市場的主要參與者包括 Aurubis、SunPower Corporation、SILCONTEL、Solarcycle、Reiling、Veolia、Canadian Solar、天合光能、丸紅株式會社、We Recycle Solar、Echo Environmental 和 First Solar。為了在不斷發展的太陽能光電回收市場中站穩腳跟,各公司正在實施各種策略,例如建立本地回收設施、建立公私合作夥伴關係以及投資研發下一代回收方法。許多公司正在擴大業務覆蓋範圍、提升加工能力,並使營運符合環保合規標準,以提高獲利能力和品牌信譽。
目錄
第1章:方法論與範圍
第2章:執行摘要
第3章:行業洞察
- 產業生態系統
- 川普政府關稅分析
- 對貿易的影響
- 貿易量中斷
- 報復措施
- 對產業的影響
- 供給側影響(原料)
- 主要材料價格波動
- 供應鏈重組
- 生產成本影響
- 需求面影響(售價)
- 價格傳導至終端市場
- 市佔率動態
- 消費者反應模式
- 供給側影響(原料)
- 受影響的主要公司
- 策略產業反應
- 供應鏈重組
- 定價和產品策略
- 政策參與
- 展望與未來考慮
- 對貿易的影響
- 監管格局
- 產業衝擊力
- 成長動力
- 產業陷阱與挑戰
- 成長潛力分析
- 波特的分析
- PESTEL分析
第4章:競爭格局
- 介紹
- 策略舉措
- 公司市佔率
- 戰略儀表板
- 公司標竿分析
- 創新與技術格局
第5章:市場規模及預測:按可回收材料,2021 年至 2034 年
- 主要趨勢
- 銀
- 鋁
- 銅
- 玻璃
- 其他
第6章:市場規模及預測:依最終用途,2021 年至 2034 年
- 主要趨勢
- 住宅
- 商業和工業
- 公用事業
第7章:市場規模及預測:依工藝,2021 年至 2034 年
- 主要趨勢
- 機械的
- 熱的
- 雷射
第8章:市場規模及預測:按地區,2021 年至 2034 年
- 主要趨勢
- 北美洲
- 美國
- 加拿大
- 歐洲
- 德國
- 義大利
- 法國
- 英國
- 亞太地區
- 中國
- 印度
- 日本
- 中東和非洲
- 阿拉伯聯合大公國
- 南非
- 拉丁美洲
- 巴西
- 智利
第9章:公司簡介
- Aurubis
- Canadian Solar
- Echo Environmental
- First Solar
- Marubeni Corporation
- Reiling
- SILCONTEL
- Solarcycle
- SunPower Corporation
- Trina Solar
- Veolia
- We Recycle Solar
The Global Solar PV Recycling Market was valued at USD 492.8 million in 2024 and is estimated to grow at a CAGR of 19.7% to reach USD 2.67 billion by 2034, driven by increasing global awareness around environmental sustainability and the urgent need to manage the growing volume of solar photovoltaic waste. As more PV panels installed two to three decades ago reach the end of their lifecycle, the market is witnessing a surge in demand for efficient recycling processes. Governments, environmental agencies, and private stakeholders push for better recycling infrastructure to prevent landfill accumulation and recover critical materials used in panel production.
The solar industry's reliance on finite resources such as high-purity silicon, indium, and silver pushes for greater recycling innovation. Escalating geopolitical instability and disruptions in the global supply chain have heightened interest in domestic material recovery, which enhances supply security while supporting environmental goals. Companies are turning toward advanced recovery technologies to optimize costs and reduce waste. Modern techniques are helping manufacturers reclaim valuable materials while aligning with circular economy policies, further propelling market momentum.
| Market Scope | |
|---|---|
| Start Year | 2024 |
| Forecast Year | 2025-2034 |
| Start Value | $492.8 Million |
| Forecast Value | $2.67 Billion |
| CAGR | 19.7% |
In 2024, copper secured a notable 17.3% share, attributed to its increasing material scarcity and consistently high market recovery value. With copper being a critical component in solar panels and overall renewable energy systems, its recovery from decommissioned panels has become a major priority for recyclers. As pressure mounts globally to reduce dependency on mining and support a circular economy, copper extraction from used solar modules offers both environmental and financial benefits.
The residential segment is expected to generate USD 801 million by 2034, backed by heightened consumer awareness about the environmental impact of solar waste. Homeowners are increasingly seeking sustainable solutions, and the integration of panel recycling into residential solar energy systems is steadily becoming the norm. National regulations surrounding electronic and hazardous waste disposal, along with tax credits and take-back programs, are reinforcing this behavior. As consumers prioritize eco-friendly energy systems, recyclers are capitalizing on this shift by offering household-friendly, compliant, and cost-effective recycling services that extend the lifecycle of solar components.
Asia Pacific Solar PV Recycling Market generated USD 1,120 million by 2034, driven by the widespread solar infrastructure established across nations like China, Japan, and India, and the volume of outdated or failing solar panels. This mounting waste challenge is pushing governments and private enterprises in the region to invest in localized recycling facilities. These efforts are not only meeting national sustainability targets but also generating new employment opportunities and advancing regional manufacturing ecosystems.
Key players in the Global Solar PV Recycling Market include Aurubis, SunPower Corporation, SILCONTEL, Solarcycle, Reiling, Veolia, Canadian Solar, Trina Solar, Marubeni Corporation, We Recycle Solar, Echo Environmental, and First Solar. To secure their foothold in the evolving solar PV recycling market, companies are implementing strategies such as establishing local recycling facilities, forming public-private partnerships, and investing in R&D for next-generation recovery methods. Many are expanding their geographic reach, upgrading processing capacities, and aligning operations with environmental compliance standards to improve profitability and brand credibility.
Table of Contents
Chapter 1 Methodology & Scope
- 1.1 Research design
- 1.2 Base estimates & calculations
- 1.3 Forecast model
- 1.4 Primary research & validation
- 1.4.1 Primary sources
- 1.4.2 Data mining sources
- 1.5 Market definitions
Chapter 2 Executive Summary
- 2.1 Industry synopsis, 2021 – 2034
Chapter 3 Industry Insights
- 3.1 Industry ecosystem
- 3.2 Trump administration tariff analysis
- 3.2.1 Impact on trade
- 3.2.1.1 Trade volume disruptions
- 3.2.1.2 Retaliatory measures
- 3.2.2 Impact on the industry
- 3.2.2.1 Supply-side impact (raw materials)
- 3.2.2.1.1 Price volatility in key materials
- 3.2.2.1.2 Supply chain restructuring
- 3.2.2.1.3 Production cost implications
- 3.2.2.2 Demand-side impact (selling price)
- 3.2.2.2.1 Price transmission to end markets
- 3.2.2.2.2 Market share dynamics
- 3.2.2.2.3 Consumer response patterns
- 3.2.2.1 Supply-side impact (raw materials)
- 3.2.3 Key companies impacted
- 3.2.4 Strategic industry responses
- 3.2.4.1 Supply chain reconfiguration
- 3.2.4.2 Pricing and product strategies
- 3.2.4.3 Policy engagement
- 3.2.5 Outlook and future considerations
- 3.2.1 Impact on trade
- 3.3 Regulatory landscape
- 3.4 Industry impact forces
- 3.4.1 Growth drivers
- 3.4.2 Industry pitfalls & challenges
- 3.5 Growth potential analysis
- 3.6 Porter's analysis
- 3.6.1 Bargaining power of suppliers
- 3.6.2 Bargaining power of buyers
- 3.6.3 Threat of new entrants
- 3.6.4 Threat of substitutes
- 3.7 PESTEL analysis
Chapter 4 Competitive landscape, 2024
- 4.1 Introduction
- 4.2 Strategic initiatives
- 4.3 Company market share
- 4.4 Strategic dashboard
- 4.5 Company benchmarking
- 4.6 Innovation & technology landscape
Chapter 5 Market Size and Forecast, By Recyclable Material, 2021 – 2034 (USD Million)
- 5.1 Key trends
- 5.2 Silver
- 5.3 Aluminum
- 5.4 Copper
- 5.5 Glass
- 5.6 Others
Chapter 6 Market Size and Forecast, By End Use, 2021 – 2034 (USD Million)
- 6.1 Key trends
- 6.2 Residential
- 6.3 Commercial & industrial
- 6.4 Utility
Chapter 7 Market Size and Forecast, By Process, 2021 – 2034 (USD Million)
- 7.1 Key trends
- 7.2 Mechanical
- 7.3 Thermal
- 7.4 Laser
Chapter 8 Market Size and Forecast, By Region, 2021 – 2034 (USD Million)
- 8.1 Key trends
- 8.2 North America
- 8.2.1 U.S.
- 8.2.2 Canada
- 8.3 Europe
- 8.3.1 Germany
- 8.3.2 Italy
- 8.3.3 France
- 8.3.4 UK
- 8.4 Asia Pacific
- 8.4.1 China
- 8.4.2 India
- 8.4.3 Japan
- 8.5 Middle East & Africa
- 8.5.1 UAE
- 8.5.2 South Africa
- 8.6 Latin America
- 8.6.1 Brazil
- 8.6.2 Chile
Chapter 9 Company Profiles
- 9.1 Aurubis
- 9.2 Canadian Solar
- 9.3 Echo Environmental
- 9.4 First Solar
- 9.5 Marubeni Corporation
- 9.6 Reiling
- 9.7 SILCONTEL
- 9.8 Solarcycle
- 9.9 SunPower Corporation
- 9.10 Trina Solar
- 9.11 Veolia
- 9.12 We Recycle Solar
 太陽能板回收市場:2026-2032年全球市場預測(依製程、面板類型、回收材料、廢棄物來源、最終用途、客戶類型和收集管道分類)
 太陽能板回收市場規模、佔有率和趨勢分析報告:按類型、技術、壽命、地區和細分市場預測(2026-2033 年)
 日本太陽能板回收市場規模、佔有率、趨勢及預測(按製程、類型、材質、使用壽命及地區分類,2026-2034年)
 太陽能板回收市場-全球產業規模、佔有率、趨勢、機會、預測:按製程、類型、地區和競爭格局分類,2021-2031年
 太陽能板回收市場規模、佔有率和成長分析(按製程、材料、儲存期限、類型和地區分類)-2026-2033年產業預測
 可回收光學模組:全球市場佔有率和排名、總收入和需求預測(2025-2031 年)2025-2033年太陽能板回收市場報告(按流程、類型、材料、保存期限和地區)
 2032 年太陽能板回收市場預測:按類型、保存期限、技術、材料、最終用戶和地區進行的全球分析
 太陽能板回收市場:全球按類型、壽命、製程、材質和地區分類-預測至2030年
 零廢棄太陽能板回收市場分析及預測至 2033 年:按類型、產品、服務、技術、組件、應用、材料類型、流程、最終用戶、模組