


 |
市場調查報告書
商品編碼
1741030
地震服務市場機會、成長動力、產業趨勢分析及 2025 - 2034 年預測Seismic Services Market Opportunity, Growth Drivers, Industry Trend Analysis, and Forecast 2025 - 2034 |
||||||
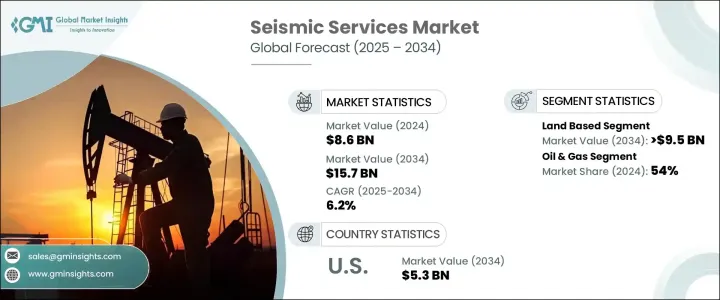
2024年,全球地震服務市場規模達86億美元,預計2034年將以6.2%的複合年成長率成長,達到157億美元。這得益於全球能源探勘技術的重大轉變、對高解析度地下成像的日益依賴以及下一代地球物理技術的快速應用。隨著全球探勘活動日益轉向數據驅動,地震服務正逐漸成為能源發展策略的重要支柱。如今,營運商需要更快、更準確地洞察地下結構,這促使地震服務提供者提供整合的、數位優先的解決方案。隨著能源產業正在經歷重大轉型——平衡化石燃料與再生能源——地震技術的角色正從石油和天然氣領域擴展到離岸風電、地熱和採礦業等領域。在監管要求和環境評估的推動下,對永續探勘的日益重視正在重塑地震創新的投資流向。企業不僅採用3D和4D地震等先進的成像技術,還將機器學習和人工智慧融入資料處理,簡化營運、降低成本並提高決策速度。隨著全球能源需求日益複雜,地震服務市場已成為實現更智慧、更清潔、更有效率資源探勘的關鍵推手。
油價的不確定性和地緣政治情勢的變化持續影響著探勘預算和地震服務量。服務公司與能源生產商之間的合作對於推動創新和拓展能力仍然至關重要。關鍵地震設備和材料的關稅正在增加營運成本,並可能減緩全球合作,限制尖端技術的取得。儘管如此,各公司正在透過本地採購策略和數位創新來尋找適應的方法。
| 市場範圍 | |
|---|---|
| 起始年份 | 2024 |
| 預測年份 | 2025-2034 |
| 起始值 | 86億美元 |
| 預測值 | 157億美元 |
| 複合年成長率 | 6.2% |
陸基地震服務預計將佔據產業主導地位,預計到2034年其收入將達到95億美元。由於成本效益高,並透過先進的3D和4D成像技術提高了精度,這些探勘在上游探勘中仍然至關重要。陸地採集技術的持續創新使得在不同地形上進行詳細的地下評估變得更加容易,從而顯著提高了探勘成果。
2024年,石油和天然氣產業佔據了54%的主導佔有率,這得益於旨在降低探勘風險和改善資源定位的人工智慧地震分析工作流程的不斷成長。對策略性礦產的需求推動了採礦業對地震服務的應用,而離岸風電和地熱項目也越來越依賴地震成像進行環境影響評估和場地可行性研究,凸顯了地震工具在各個行業中日益廣泛的應用。
2024年,美國地震服務市場規模達29億美元,預計2034年將達53億美元。頁岩盆地和墨西哥灣等近海區域的探勘和生產持續推動著地震服務市場的需求。服務供應商正在整合機器學習、即時成像和先進的資料處理技術,以提高生產力並滿足日益嚴格的監管標準,尤其是針對再生能源專案的監管標準。
哈里伯頓、Paradigm Group BV、CGG、TGS、Gardline Limited、SLB、Fugro、Getech Group plc、PGS、Spectrum Geophysics、SAExploration、Ramboll Group A/S、NUVIA Dynamics Inc.、Weatherford、中海油田服務股份有限公司、EGS Geo (Interphynational、Dynamics Inc.、Weatherford、中海油田服務股份有限公司、EGS (International他們的策略包括投資即時地震資料分析、拓展海上探勘能力、與能源供應商組成合資企業、利用人工智慧簡化資料工作流程,以及透過永續、低影響的地震探勘技術瞄準再生能源領域。
目錄
第1章:方法論與範圍
第2章:執行摘要
第3章:行業洞察
- 產業生態系統分析
- 川普政府關稅分析
- 對貿易的影響
- 貿易量中斷
- 報復措施
- 對產業的影響
- 供給側影響(原料)
- 主要材料價格波動
- 供應鏈重組
- 生產成本影響
- 需求面影響(售價)
- 價格傳導至終端市場
- 市佔率動態
- 消費者反應模式
- 供給側影響(原料)
- 受影響的主要公司
- 策略產業反應
- 供應鏈重組
- 定價和產品策略
- 政策參與
- 展望與未來考慮
- 對貿易的影響
- 監管格局
- 產業衝擊力
- 成長動力
- 產業陷阱與挑戰
- 成長潛力分析
- 波特的分析
- PESTEL分析
第4章:競爭格局
- 戰略儀表板
- 創新與永續發展格局
第5章:市場規模及預測:依調查類型,2021 - 2034 年
- 主要趨勢
- 陸基
- 以海洋為基礎
第6章:市場規模及預測:依最終用途,2021 - 2034
- 主要趨勢
- 石油和天然氣
- 礦業
- 其他
第7章:市場規模及預測:依地區,2021 - 2034
- 主要趨勢
- 北美洲
- 美國
- 加拿大
- 歐洲
- 英國
- 德國
- 法國
- 挪威
- 俄羅斯
- 亞太地區
- 中國
- 日本
- 印度
- 澳洲
- 中東和非洲
- 阿拉伯聯合大公國
- 沙烏地阿拉伯
- 伊拉克
- 伊朗
- 南非
- 拉丁美洲
- 巴西
- 阿根廷
第8章:公司簡介
- Abitibi Geophysics
- China Oilfield Services Limited
- CGG
- Dawson Geophysical Company
- EGS (International) Ltd
- Fugro
- Getech Group plc
- Gardline Limited
- Halliburton
- NUVIA Dynamics Inc.
- PGS
- Paradigm Group BV
- Ramboll Group A/S
- SLB
- SAExploration
- Spectrum Geophysics
- TGS
- Weatherford
The Global Seismic Services Market was valued at USD 8.6 billion in 2024 and is estimated to grow at a CAGR of 6.2% to reach USD 15.7 billion by 2034, driven by major shifts in global energy exploration techniques, growing reliance on high-resolution subsurface imaging, and the rapid adoption of next-gen geophysical technologies. As the world moves toward more data-driven exploration, seismic services are evolving into a critical pillar of energy development strategies. Operators today demand faster, more accurate insights into subsurface structures, pushing seismic providers to deliver integrated, digital-first solutions. With the energy sector undergoing a major transition-balancing fossil fuels with renewables-the role of seismic technologies is expanding beyond oil and gas, penetrating sectors like offshore wind, geothermal, and mining. A rising emphasis on sustainable exploration, fueled by regulatory mandates and environmental assessments, is reshaping investment flows into seismic innovation. Companies are not only adopting advanced imaging techniques like 3D and 4D seismic but also infusing machine learning and AI into data processing to streamline operations, cut costs, and improve decision-making speed. As global energy demands grow more complex, the seismic services market is positioned as a crucial enabler of smarter, cleaner, and more efficient resource exploration.
Uncertainty in oil prices and shifting geopolitical scenarios continue to impact exploration budgets and seismic service volumes. Collaboration between service firms and energy producers remains vital to drive innovation and expand capabilities. Tariffs on critical seismic equipment and materials are increasing operational costs and could slow global cooperation, restricting access to cutting-edge technologies. Nevertheless, companies are finding ways to adapt through local sourcing strategies and digital innovation.
| Market Scope | |
|---|---|
| Start Year | 2024 |
| Forecast Year | 2025-2034 |
| Start Value | $8.6 Billion |
| Forecast Value | $15.7 Billion |
| CAGR | 6.2% |
Land-based seismic services are expected to dominate the industry, with projected revenues reaching USD 9.5 billion by 2034. These surveys remain essential in upstream exploration due to their cost-effectiveness and improved accuracy through advanced 3D and 4D imaging. Ongoing innovation in land acquisition technologies is making it easier to conduct detailed subsurface assessments across diverse terrains, significantly enhancing exploration outcomes.
In 2024, the oil and gas sector held a commanding 54% share, driven by rising workflow on AI-driven seismic analysis aimed at reducing exploration risks and improving resource targeting. The need for strategic minerals has fueled the adoption of seismic services in mining, while offshore wind and geothermal projects are increasingly relying on seismic imaging for environmental impact assessments and site viability studies, highlighting the broadening relevance of seismic tools across industries.
The U.S. Seismic Services Market generated USD 2.9 billion in 2024 and is projected to reach USD 5.3 billion by 2034. Exploration and production in shale basins and offshore areas such as the Gulf of Mexico continue to fuel demand. Providers are integrating machine learning, real-time imaging, and advanced data processing technologies to boost productivity and meet tightening regulatory standards, especially for renewable projects.
Leading players such as Halliburton, Paradigm Group B.V., CGG, TGS, Gardline Limited, SLB, Fugro, Getech Group plc, PGS, Spectrum Geophysics, SAExploration, Ramboll Group A/S, NUVIA Dynamics Inc., Weatherford, China Oilfield Services Limited, EGS (International) Ltd, Dawson Geophysical Company, and Abitibi Geophysics are actively consolidating their market presence. Their strategies include investing in real-time seismic data analytics, expanding offshore capabilities, forming joint ventures with energy providers, leveraging AI to streamline data workflows, and targeting the renewable sector through sustainable, low-impact seismic exploration techniques.
Table of Contents
Chapter 1 Methodology & Scope
- 1.1 Market definitions
- 1.2 Base estimates & calculations
- 1.3 Forecast calculation
- 1.4 Data sources
- 1.4.1 Primary
- 1.4.2 Secondary
- 1.4.2.1 Paid
- 1.4.2.2 Public
Chapter 2 Executive Summary
- 2.1 Industry synopsis, 2021 - 2034
Chapter 3 Industry Insights
- 3.1 Industry ecosystem analysis
- 3.2 Trump administration tariff analysis
- 3.2.1 Impact on trade
- 3.2.1.1 Trade volume disruptions
- 3.2.1.2 Retaliatory measures
- 3.2.2 Impact on the industry
- 3.2.2.1 Supply-side impact (raw materials)
- 3.2.2.1.1 Price volatility in key materials
- 3.2.2.1.2 Supply chain restructuring
- 3.2.2.1.3 Production cost implications
- 3.2.2.2 Demand-side impact (selling price)
- 3.2.2.2.1 Price transmission to end markets
- 3.2.2.2.2 Market share dynamics
- 3.2.2.2.3 Consumer response patterns
- 3.2.2.1 Supply-side impact (raw materials)
- 3.2.3 Key companies impacted
- 3.2.4 Strategic industry responses
- 3.2.4.1 Supply chain reconfiguration
- 3.2.4.2 Pricing and product strategies
- 3.2.4.3 Policy engagement
- 3.2.5 Outlook and future considerations
- 3.2.1 Impact on trade
- 3.3 Regulatory landscape
- 3.4 Industry impact forces
- 3.4.1 Growth drivers
- 3.4.2 Industry pitfalls & challenges
- 3.5 Growth potential analysis
- 3.6 Porter's analysis
- 3.6.1 Bargaining power of suppliers
- 3.6.2 Bargaining power of buyers
- 3.6.3 Threat of new entrants
- 3.6.4 Threat of substitutes
- 3.7 PESTEL analysis
Chapter 4 Competitive landscape, 2024
- 4.1 Strategic dashboard
- 4.2 Innovation & sustainability landscape
Chapter 5 Market Size and Forecast, By Survey Type, 2021 - 2034 (USD Million)
- 5.1 Key trends
- 5.2 Land based
- 5.3 Marine based
Chapter 6 Market Size and Forecast, By End Use, 2021 - 2034 (USD Million)
- 6.1 Key trends
- 6.2 Oil & gas
- 6.3 Mining
- 6.4 Others
Chapter 7 Market Size and Forecast, By Region, 2021 - 2034 (USD Million)
- 7.1 Key trends
- 7.2 North America
- 7.2.1 U.S.
- 7.2.2 Canada
- 7.3 Europe
- 7.3.1 UK
- 7.3.2 Germany
- 7.3.3 France
- 7.3.4 Norway
- 7.3.5 Russia
- 7.4 Asia Pacific
- 7.4.1 China
- 7.4.2 Japan
- 7.4.3 India
- 7.4.4 Australia
- 7.5 Middle East & Africa
- 7.5.1 UAE
- 7.5.2 Saudi Arabia
- 7.5.3 Iraq
- 7.5.4 Iran
- 7.5.5 South Africa
- 7.6 Latin America
- 7.6.1 Brazil
- 7.6.2 Argentina
Chapter 8 Company Profiles
- 8.1 Abitibi Geophysics
- 8.2 China Oilfield Services Limited
- 8.3 CGG
- 8.4 Dawson Geophysical Company
- 8.5 EGS (International) Ltd
- 8.6 Fugro
- 8.7 Getech Group plc
- 8.8 Gardline Limited
- 8.9 Halliburton
- 8.10 NUVIA Dynamics Inc.
- 8.11 PGS
- 8.12 Paradigm Group B.V.
- 8.13 Ramboll Group A/S
- 8.14 SLB
- 8.15 SAExploration
- 8.16 Spectrum Geophysics
- 8.17 TGS
- 8.18 Weatherford
 2026年全球太空葬服務市場報告
 海底水下掩埋服務市場:按服務類型、掩埋方法、水深、計劃類型、設備類型和最終用戶分類,全球預測,2026-2032年
 地震觀測服務市場規模、佔有率、趨勢和預測:按類型、技術、部署地點、應用和地區分類,2026-2034 年
 地震服務市場-全球產業規模、佔有率、趨勢、機會及預測(依服務、技術、部署地點、應用、地區及競爭格局分類,2021-2031年)全球海洋地震探勘設備市場(按設備類型、探勘類型、技術和應用分類)預測(2026-2032年)沿海樁基服務市場(按樁型、服務類型、計劃規模和應用分類)-全球預測,2026-2032年海底打樁服務市場按設備類型、服務類型、安裝方法、應用和最終用戶分類,全球預測(2026-2032)海洋地震探勘設備市場:按設備類型、技術、模式、探勘類型、深度、應用和最終用戶分類的全球預測(2026-2032年)
 全球地震勘探服務市場:市場規模、佔有率、成長率、產業分析、依類型、應用和地區劃分的考量因素以及未來預測(2026-2034)
 地震探勘服務市場規模、佔有率和成長分析(按類型、地點、應用和地區分類)—產業預測(2026-2033 年)