


 |
市場調查報告書
商品編碼
1741018
往復式發電引擎市場機會、成長動力、產業趨勢分析及 2025 - 2034 年預測Reciprocating Power Generating Engine Market Opportunity, Growth Drivers, Industry Trend Analysis, and Forecast 2025 - 2034 |
||||||
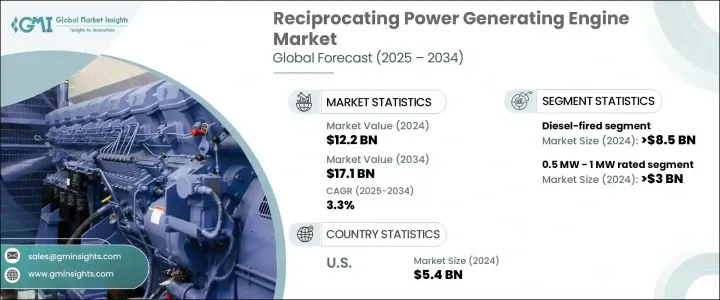
2024年,全球往復式發電引擎市場規模達122億美元,預計到2034年將以3.3%的複合年成長率成長,達到171億美元。這一成長趨勢受到各種應用領域日益成長的需求的影響,包括備用能源系統、電網平衡功能、工業營運和分散式發電。往復式引擎效率更高、啟動速度更快、操作靈活,這使得它們在人口稠密地區和偏遠地區越來越受歡迎,因為在這些地區,穩定可靠的電力供應至關重要。
市場擴張也與微電網部署和農村電氣化建設的持續推進息息相關,尤其是在工業區。這些引擎透過提供可擴展且靈活的解決方案,在滿足偏遠地區和離網社區的電力需求方面發揮著至關重要的作用。隨著新興經濟體和已開發經濟體基礎建設的持續推進,人們明顯轉向適應性強的技術,這些技術不僅能減少環境影響,還能滿足現代能源系統的技術和經濟要求。往復式引擎憑藉其模組化設計優勢和與不同負載條件的兼容性脫穎而出,這有助於在穩態和波動的電力需求情境下最大限度地提高性能。
| 市場範圍 | |
|---|---|
| 起始年份 | 2024 |
| 預測年份 | 2025-2034 |
| 起始值 | 122億美元 |
| 預測值 | 171億美元 |
| 複合年成長率 | 3.3% |
向更清潔能源替代品的轉變進一步加速了燃氣引擎系統的普及。根據燃料分類,市場細分為柴油、燃氣、雙燃料和其他類型。其中,燃氣往復式引擎市場預計到2034年將以超過4%的成長率擴張。這一成長主要源自於全球對減少碳足跡和擺脫對傳統化石燃料依賴的重視。燃氣引擎具有更佳的排放性能和更高的能源效率,這與日益嚴格的永續能源生產監管要求一致。它們能夠與再生能源系統無縫整合,這也提升了其在混合能源模式中的吸引力。
就額定功率而言,該行業細分為幾類:0.5 MW - 1 MW、1 MW 以上 - 2 MW、2 MW 以上 - 3.5 MW、3.5 MW 以上 - 5 MW、5 MW 以上 - 7.5 MW 以及 7.5 MW 以上。其中,額定功率在 1 MW 以上至 2 MW 之間的引擎在 2024 年佔據市場主導地位,佔總市場佔有率的 35.3% 以上。這一特定的容量範圍在緊湊設計和高輸出之間取得了平衡,使其成為中型工業工廠、商業設施和分散式發電營運的最佳選擇。這些引擎能夠在峰值和基載場景下運行,從而提高了它們在多個應用領域的利用率,並持續推動市場發展。
美國在全球市場格局中持續扮演著舉足輕重的角色。 2022年,美國往復式引擎產業的估值為50億美元,2023年將增加至52億美元,2024年將達54億美元。能源需求的不斷成長、能源韌性基礎設施的投資以及日益增多的天氣相關干擾事件(這些事件需要穩健且無功的電力解決方案)推動了這一成長。此外,備用能源和分散式能源的廣泛部署也鼓勵使用能夠快速應對能源短缺和電網不穩定的高效引擎系統。
市場動態也受到不斷變化的競爭格局的影響。該領域五大領先公司合計佔據全球約45%的市場。隨著製造商專注於提高燃料靈活性、增強引擎耐用性以及擴大售後服務網路,競爭也日益激烈。支援柴油、天然氣和雙燃料的引擎設計因其能夠適應不同的燃料供應條件和營運要求而備受關注。此外,隨著企業越來越重視生命週期性能和維護效率,提供全面服務包和整合數位監控解決方案的製造商將有望抓住更大的市場機會。
目錄
第1章:方法論與範圍
第2章:執行摘要
第3章:行業洞察
- 產業生態系統分析
- 川普政府關稅分析
- 對貿易的影響
- 貿易量中斷
- 報復措施
- 對產業的影響
- 供應方影響(原料)
- 主要材料價格波動
- 供應鏈重組
- 生產成本影響
- 需求面影響(售價)
- 價格傳導至終端市場
- 市佔率動態
- 消費者反應模式
- 供應方影響(原料)
- 受影響的主要公司
- 策略產業反應
- 供應鏈重組
- 定價和產品策略
- 政策參與
- 展望與未來考慮
- 對貿易的影響
- 監管格局
- 產業衝擊力
- 成長動力
- 產業陷阱與挑戰
- 成長潛力分析
- 波特的分析
- PESTEL分析
第4章:競爭格局
- 介紹
- 戰略儀表板
- 策略舉措
- 公司市佔率分析
- 競爭基準測試
- 創新與永續發展格局
第5章:市場規模及預測:依燃料類型,2021 - 2034
- 主要趨勢
- 瓦斯
- 0.5 兆瓦 - 1 兆瓦
- > 1 兆瓦 - 2 兆瓦
- > 2 兆瓦 - 3.5 兆瓦
- > 3.5 兆瓦 - 5 兆瓦
- > 5 兆瓦 - 7.5 兆瓦
- > 7.5 兆瓦
- 柴油引擎
- 0.5 兆瓦 - 1 兆瓦
- > 1 兆瓦 - 2 兆瓦
- > 2 兆瓦 - 3.5 兆瓦
- > 3.5 兆瓦 - 5 兆瓦
- > 5 兆瓦 - 7.5 兆瓦
- > 7.5 兆瓦
- 雙燃料
- 0.5 兆瓦 - 1 兆瓦
- > 1 兆瓦 - 2 兆瓦
- > 2 兆瓦 - 3.5 兆瓦
- > 3.5 兆瓦 - 5 兆瓦
- > 5 兆瓦 - 7.5 兆瓦
- > 7.5 兆瓦
- 其他
- 0.5 兆瓦 - 1 兆瓦
- > 1 兆瓦 - 2 兆瓦
- > 2 兆瓦 - 3.5 兆瓦
- > 3.5 兆瓦 - 5 兆瓦
- > 5 兆瓦 - 7.5 兆瓦
- > 7.5 兆瓦
第6章:市場規模及預測:依額定功率,2021 - 2034
- 主要趨勢
- 0.5 兆瓦 - 1 兆瓦
- > 1 兆瓦 - 2 兆瓦
- > 2 兆瓦 - 3.5 兆瓦
- > 3.5 兆瓦 - 5 兆瓦
- > 5 兆瓦 - 7.5 兆瓦
- > 7.5 兆瓦
第7章:市場規模及預測:依應用,2021 - 2034
- 主要趨勢
- 工業的
- 熱電聯產
- 能源與公用事業
- 垃圾掩埋場和沼氣
- 石油和天然氣
- 其他
第8章:市場規模及預測:依最終用途,2021 - 2034
- 主要趨勢
- 備份
- 0.5 兆瓦 - 1 兆瓦
- > 1 兆瓦 - 2 兆瓦
- > 2 兆瓦 - 3.5 兆瓦
- > 3.5 兆瓦 - 5 兆瓦
- > 5 兆瓦 - 7.5 兆瓦
- > 7.5 兆瓦
- 主電源
- 0.5 兆瓦 - 1 兆瓦
- > 1 兆瓦 - 2 兆瓦
- > 2 兆瓦 - 3.5 兆瓦
- > 3.5 兆瓦 - 5 兆瓦
- > 5 兆瓦 - 7.5 兆瓦
- > 7.5 兆瓦
第9章:市場規模及預測:按地區,2021 - 2034
- 主要趨勢
- 北美洲
- 美國
- 加拿大
- 墨西哥
- 歐洲
- 英國
- 法國
- 德國
- 俄羅斯
- 義大利
- 西班牙
- 荷蘭
- 丹麥
- 挪威
- 亞太地區
- 中國
- 印度
- 日本
- 韓國
- 澳洲
- 泰國
- 新加坡
- 印尼
- 馬來西亞
- 中東和非洲
- 阿拉伯聯合大公國
- 沙烏地阿拉伯
- 卡達
- 阿曼
- 科威特
- 伊朗
- 埃及
- 土耳其
- 約旦
- 南非
- 拉丁美洲
- 巴西
- 阿根廷
- 智利
- 秘魯
第10章:公司簡介
- Ashok Leyland
- Briggs & Stratton
- Caterpillar
- Cummins
- Deere & Company
- Deutz AG
- Enerflex
- Escorts Limited
- GE Vernova
- Guascor Energy
- Kawasaki Heavy Industries
- Kirloskar Oil Engines
- Kohler Engines
- MAN Energy Solutions
- Mitsubishi Heavy Industries
- Rolls-Royce
- Scania
- TRITON DURO
- Wartsilä
- YANMAR HOLDINGS
The Global Reciprocating Power Generating Engine Market was valued at USD 12.2 billion in 2024 and is estimated to grow at a CAGR of 3.3% to reach USD 17.1 billion by 2034. This upward trajectory is being shaped by growing demands across a wide range of applications, including backup energy systems, grid balancing functions, industrial operations, and decentralized power generation. The enhanced efficiency, rapid start-up capabilities, and operational versatility of reciprocating engines are making them an increasingly favored option in both densely populated areas and more isolated regions where consistent and reliable power access is critical.
The market's expansion is also linked to the rising deployment of microgrids and rural electrification efforts, especially in industrial zones. These engines are proving vital in meeting the power requirements of remote installations and off-grid communities by offering scalable and flexible solutions. As infrastructure development continues in emerging and developed economies alike, there is a marked shift toward adaptable technologies that not only reduce environmental impact but also meet the technical and economic requirements of modern energy systems. Reciprocating engines stand out by offering modular design benefits and compatibility with varying load conditions, which helps maximize performance in both steady-state and fluctuating power demand scenarios.
| Market Scope | |
|---|---|
| Start Year | 2024 |
| Forecast Year | 2025-2034 |
| Start Value | $12.2 Billion |
| Forecast Value | $17.1 Billion |
| CAGR | 3.3% |
The move toward cleaner power alternatives is further accelerating the adoption of gas-powered engine systems. Based on fuel classification, the market is segmented into diesel-fired, gas-fired, dual-fuel, and other variants. Among these, the gas-fired reciprocating engine segment is projected to expand at a growth rate of over 4% through 2034. This surge is driven largely by the global emphasis on reducing carbon footprints and transitioning away from traditional fossil fuel dependency. Gas-fueled engines offer improved emissions performance and greater energy efficiency, which aligns with the increasing regulatory push for sustainable energy production. Their ability to integrate seamlessly with renewable energy systems also boosts their appeal in hybrid energy models.
In terms of power rating, the industry is broken down into several categories: 0.5 MW - 1 MW, over 1 MW - 2 MW, over 2 MW - 3.5 MW, over 3.5 MW - 5 MW, over 5 MW - 7.5 MW, and above 7.5 MW. Among these, engines rated between over 1 MW and 2 MW dominated the market in 2024, accounting for more than 35.3% of the total share. This specific capacity range strikes a balance between compact design and high output, making it an optimal choice for mid-size industrial plants, commercial facilities, and decentralized generation operations. The ability of these engines to serve in both peaking and base-load scenarios enhances their utilization across several application areas, promoting continued market traction.
The United States continues to play a pivotal role in the global market landscape. The country's reciprocating engine sector was valued at USD 5 billion in 2022, increasing to USD 5.2 billion in 2023 and reaching USD 5.4 billion in 2024. The expansion is being supported by rising energy demands, investments in energy resilience infrastructure, and the growing occurrence of weather-related disruptions that require robust and reactive power solutions. Additionally, the broad deployment of standby and distributed energy resources is encouraging the use of high-efficiency engine systems that can quickly respond to energy shortfalls and grid instability.
Market dynamics are also influenced by an evolving competitive landscape. The five leading companies in the space collectively control about 45% of the global market share. Competition is intensifying as manufacturers focus on improving fuel flexibility, enhancing engine durability, and expanding aftermarket service networks. Engine designs that support diesel, gas, and dual-fuel capabilities are gaining attention due to their adaptability to varying fuel supply conditions and operational requirements. Furthermore, as businesses place more emphasis on lifecycle performance and maintenance efficiency, manufacturers that offer comprehensive service packages and integrated digital monitoring solutions are poised to capture greater market opportunities.
Table of Contents
Chapter 1 Methodology & Scope
- 1.1 Research design
- 1.2 Market estimates & forecast parameters
- 1.3 Forecast calculation
- 1.4 Data sources
- 1.4.1 Primary
- 1.4.2 Secondary
- 1.4.2.1 Paid
- 1.4.2.2 Public
- 1.5 Market definitions
Chapter 2 Executive Summary
- 2.1 Industry synopsis, 2021 - 2034
Chapter 3 Industry Insights
- 3.1 Industry ecosystem analysis
- 3.2 Trump administration tariffs analysis
- 3.2.1 Impact on trade
- 3.2.1.1 Trade volume disruptions
- 3.2.1.2 Retaliatory measures
- 3.2.2 Impact on the industry
- 3.2.2.1 Supply-side impact (raw materials)
- 3.2.2.1.1 Price volatility in key materials
- 3.2.2.1.2 Supply chain restructuring
- 3.2.2.1.3 Production cost implications
- 3.2.2.2 Demand-side impact (selling price)
- 3.2.2.2.1 Price transmission to end markets
- 3.2.2.2.2 Market share dynamics
- 3.2.2.2.3 Consumer response patterns
- 3.2.2.1 Supply-side impact (raw materials)
- 3.2.3 Key companies impacted
- 3.2.4 Strategic industry responses
- 3.2.4.1 Supply chain reconfiguration
- 3.2.4.2 Pricing and product strategies
- 3.2.4.3 Policy engagement
- 3.2.5 Outlook and future considerations
- 3.2.1 Impact on trade
- 3.3 Regulatory landscape
- 3.4 Industry impact forces
- 3.4.1 Growth drivers
- 3.4.2 Industry pitfalls & challenges
- 3.5 Growth potential analysis
- 3.6 Porter's analysis
- 3.6.1 Bargaining power of suppliers
- 3.6.2 Bargaining power of buyers
- 3.6.3 Threat of new entrants
- 3.6.4 Threat of substitutes
- 3.7 PESTEL analysis
Chapter 4 Competitive Landscape, 2025
- 4.1 Introduction
- 4.2 Strategic dashboard
- 4.3 Strategic initiatives
- 4.4 Company market share analysis, 2024
- 4.5 Competitive benchmarking
- 4.6 Innovation & sustainability landscape
Chapter 5 Market Size and Forecast, By Fuel Type, 2021 - 2034 (USD Million & Units)
- 5.1 Key trends
- 5.2 Gas-fired
- 5.2.1 0.5 MW - 1 MW
- 5.2.2 > 1 MW - 2 MW
- 5.2.3 > 2 MW - 3.5 MW
- 5.2.4 > 3.5 MW - 5 MW
- 5.2.5 > 5 MW - 7.5 MW
- 5.2.6 > 7.5 MW
- 5.3 Diesel-fired
- 5.3.1 0.5 MW - 1 MW
- 5.3.2 > 1 MW - 2 MW
- 5.3.3 > 2 MW - 3.5 MW
- 5.3.4 > 3.5 MW - 5 MW
- 5.3.5 > 5 MW - 7.5 MW
- 5.3.6 > 7.5 MW
- 5.4 Dual fuel
- 5.4.1 0.5 MW - 1 MW
- 5.4.2 > 1 MW - 2 MW
- 5.4.3 > 2 MW - 3.5 MW
- 5.4.4 > 3.5 MW - 5 MW
- 5.4.5 > 5 MW - 7.5 MW
- 5.4.6 > 7.5 MW
- 5.5 Others
- 5.5.1 0.5 MW - 1 MW
- 5.5.2 > 1 MW - 2 MW
- 5.5.3 > 2 MW - 3.5 MW
- 5.5.4 > 3.5 MW - 5 MW
- 5.5.5 > 5 MW - 7.5 MW
- 5.5.6 > 7.5 MW
Chapter 6 Market Size and Forecast, By Rated Power, 2021 - 2034 (USD Million & Units)
- 6.1 Key trends
- 6.2 0.5 MW - 1 MW
- 6.3 > 1 MW - 2 MW
- 6.4 > 2 MW - 3.5 MW
- 6.5 > 3.5 MW - 5 MW
- 6.6 > 5 MW - 7.5 MW
- 6.7 > 7.5 MW
Chapter 7 Market Size and Forecast, By Application, 2021 - 2034 (USD Million & Units)
- 7.1 Key trends
- 7.2 Industrial
- 7.3 CHP
- 7.4 Energy & utility
- 7.5 Landfill & biogas
- 7.6 Oil & gas
- 7.7 Others
Chapter 8 Market Size and Forecast, By End Use, 2021 - 2034 (USD Million & Units)
- 8.1 Key trends
- 8.2 Backup
- 8.2.1 0.5 MW - 1 MW
- 8.2.2 > 1 MW - 2 MW
- 8.2.3 > 2 MW - 3.5 MW
- 8.2.4 > 3.5 MW - 5 MW
- 8.2.5 > 5 MW - 7.5 MW
- 8.2.6 > 7.5 MW
- 8.3 Prime power
- 8.3.1 0.5 MW - 1 MW
- 8.3.2 > 1 MW - 2 MW
- 8.3.3 > 2 MW - 3.5 MW
- 8.3.4 > 3.5 MW - 5 MW
- 8.3.5 > 5 MW - 7.5 MW
- 8.3.6 > 7.5 MW
Chapter 9 Market Size and Forecast, By Region, 2021 - 2034 (USD Million & Units)
- 9.1 Key trends
- 9.2 North America
- 9.2.1 U.S.
- 9.2.2 Canada
- 9.2.3 Mexico
- 9.3 Europe
- 9.3.1 UK
- 9.3.2 France
- 9.3.3 Germany
- 9.3.4 Russia
- 9.3.5 Italy
- 9.3.6 Spain
- 9.3.7 Netherlands
- 9.3.8 Denmark
- 9.3.9 Norway
- 9.4 Asia Pacific
- 9.4.1 China
- 9.4.2 India
- 9.4.3 Japan
- 9.4.4 South Korea
- 9.4.5 Australia
- 9.4.6 Thailand
- 9.4.7 Singapore
- 9.4.8 Indonesia
- 9.4.9 Malaysia
- 9.5 Middle East & Africa
- 9.5.1 UAE
- 9.5.2 Saudi Arabia
- 9.5.3 Qatar
- 9.5.4 Oman
- 9.5.5 Kuwait
- 9.5.6 Iran
- 9.5.7 Egypt
- 9.5.8 Turkey
- 9.5.9 Jordan
- 9.5.10 South Africa
- 9.6 Latin America
- 9.6.1 Brazil
- 9.6.2 Argentina
- 9.6.3 Chile
- 9.6.4 Peru
Chapter 10 Company Profiles
- 10.1 Ashok Leyland
- 10.2 Briggs & Stratton
- 10.3 Caterpillar
- 10.4 Cummins
- 10.5 Deere & Company
- 10.6 Deutz AG
- 10.7 Enerflex
- 10.8 Escorts Limited
- 10.9 GE Vernova
- 10.10 Guascor Energy
- 10.11 Kawasaki Heavy Industries
- 10.12 Kirloskar Oil Engines
- 10.13 Kohler Engines
- 10.14 MAN Energy Solutions
- 10.15 Mitsubishi Heavy Industries
- 10.16 Rolls-Royce
- 10.17 Scania
- 10.18 TRITON DURO
- 10.19 Wartsilä
- 10.20 YANMAR HOLDINGS
 柴油引擎:全球市場佔有率和排名、總銷售量和需求預測(2025-2031年)
 柴油引擎市場按應用、功率輸出、技術、冷卻方式、汽缸數和排放氣體標準分類-2025-2032年全球預測
 2025年全球柴油引擎市場報告2025年全球往復式發電引擎市場報告2025年原動機往復式發電機全球市場報告
 備用往復式發電引擎市場機會、成長動力、產業趨勢分析及 2025 - 2034 年預測
 全球柴油引擎市場:2031 年預測
 柴油引擎:市場佔有率分析、行業趨勢和統計、成長預測(2025-2030 年)
 2030 年柴油引擎市場預測:按燃料類型、引擎類型、零件、應用和地區進行的全球分析
 全球備用往復式發電機引擎市場