

 |
市場調查報告書
商品編碼
1740987
智慧家用飲料機市場機會、成長動力、產業趨勢分析及 2025 - 2034 年預測Smart Home-Based Beverage Machine Market Opportunity, Growth Drivers, Industry Trend Analysis, and Forecast 2025 - 2034 |
||||||
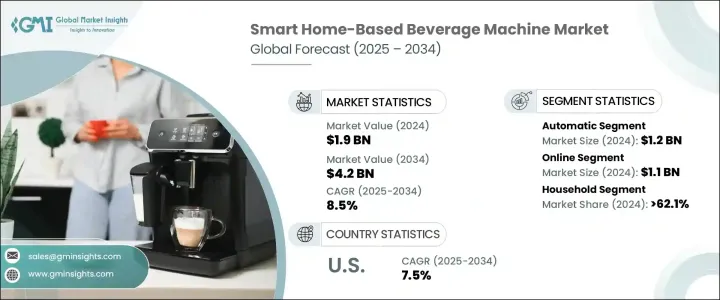
2024年,全球智慧家用飲料機市場規模達19億美元,預計到2034年將以8.5%的複合年成長率成長,達到42億美元。推動這一成長的主要因素是人們對日常生活便利性日益成長的需求。消費者越來越傾向於簡化日常任務的解決方案,而智慧飲料機正滿足這項需求。這些設備提供輕鬆便捷的飲料製作體驗,只需極少的用戶輸入。其直覺的操作確保即使技術知識有限的使用者也能輕鬆上手。使用者不再需要依賴手動準備步驟,只需幾個簡單的命令即可享受流暢的飲料製作體驗。
物聯網 (IoT) 技術的日益融合,在智慧飲料機領域的變革中發揮著至關重要的作用。物聯網功能使這些設備能夠與智慧型手機和其他智慧型裝置連接,讓使用者能夠在家中的任何地方遠端沖泡飲料。客製化功能也日益普及。使用者可依照自己的喜好調整沖泡濃度、溫度設定和食材比例,打造專屬飲品,提供傳統機器先前無法實現的個人化體驗。隨著生活方式日益數位化,此類功能正成為現代家庭的必備之選。
| 市場範圍 | |
|---|---|
| 起始年份 | 2024 |
| 預測年份 | 2025-2034 |
| 起始值 | 19億美元 |
| 預測值 | 42億美元 |
| 複合年成長率 | 8.5% |
就功能性而言,自動化細分市場處於領先地位。截至2024年,該細分市場的收入為12億美元,預計到2034年將以約9%的複合年成長率成長。自動化智慧飲料機的設計旨在最大限度地提高便利性,幾乎無需手動操作。使用者只需輸入配料偏好,機器就會處理其他所有事情。這些設備通常配備可編程功能,例如觸控螢幕、Wi-Fi連接和語音控制,完美契合當今快節奏消費者的需求。它們能夠提供一致的飲品效果,同時減少手動操作的需求,這是其日益普及的主要原因。
在分銷方面,線上銷售佔主導地位。 2024年,線上銷售規模約11億美元,預計到2034年將以近9%的複合年成長率成長。這項成長主要得益於電商平台的日益普及,消費者足不出戶即可輕鬆購物。買家被吸引到能夠在購買前比較產品、閱讀經過驗證的評論、獲取詳細的產品資訊以及觀看演示影片等功能。更優惠的價格、更廣泛的產品供應以及快速的配送選擇等額外優勢,使得線上通路對精通科技的購物者尤其具有吸引力。隨著數位購物的不斷發展,這種轉變預計將持續升溫。
從使用情況來看,家庭是智慧家庭飲料機的主要消費者。 2024年,家庭市場佔據了62.1%的市場佔有率,預計到2034年將以9%的複合年成長率成長。隨著可透過Wi-Fi或藍牙控制的智慧家電的普及和認知度的提升,推動了該領域的成長。這些機器允許用戶使用智慧型手機或語音助理輕鬆製作各種飲品,從咖啡、茶到冰沙。憑藉節能沖泡、可自訂的飲品設置以及與其他智慧家庭設備的無縫整合等功能,這些機器滿足了追求廚房創新和效率的屋主的需求。
北美市場蓬勃發展,尤其是在美國。美國以2024年4.8億美元的估值引領該地區市場,預計到2034年,複合年成長率將達到7.5%。該地區率先採用智慧技術,加之對便利性的強烈追求,正鼓勵消費者擁抱這些設備。許多消費者正在投資具有遠端控制、語音整合和其他智慧功能的飲料機。消費者對高階科技型廚房電器的興趣正在推動需求,並為持續成長奠定基礎。
智慧家庭飲料機產業的主要參與者包括 Behmor、Breville、Bevi、BSH、Coway、De'Longhi、Cafe Appliances、Hamilton Beach、Illy、Jura、Hurom、Kuvings、Nespresso、Lavazza 和 Smart Soda。許多公司正在對創新進行策略性投資,專注於整合永續材料和節能技術,以應對日益成長的環境問題。這種關注不僅增強了他們的競爭優勢,也符合現代消費者不斷變化的期望。
目錄
第1章:方法論與範圍
第2章:執行摘要
第3章:行業洞察
- 產業生態系統分析
- 川普政府關稅分析
- 對貿易的影響
- 貿易量中斷
- 報復措施
- 對產業的影響
- 供給側影響(原料)
- 主要材料價格波動
- 供應鏈重組
- 生產成本影響
- 需求面影響(售價)
- 價格傳導至終端市場
- 市佔率動態
- 消費者反應模式
- 受影響的主要公司
- 策略產業反應
- 供應鏈重組
- 定價和產品策略
- 政策參與
- 展望與未來考慮
- 對貿易的影響
- 供應商格局
- 定價分析
- 技術與創新格局
- 重要新聞和舉措
- 監管格局
- 製造商
- 經銷商
- 零售商
- 衝擊力
- 成長動力
- 消費者越來越注重便利性和效率
- 智慧家庭科技的擴展
- 專用電器日益普及
- 創新產品
- 產業陷阱與挑戰
- 消費者偏好的改變
- 市場飽和度高
- 成長動力
- 技術與創新格局
- 消費者購買行為分析
- 成長潛力分析
- 監管格局
- 定價分析
- 波特的分析
- PESTEL分析
第4章:競爭格局
- 介紹
- 公司市佔率分析
- 競爭定位矩陣
- 戰略展望矩陣
第5章:市場估計與預測:依產品類型,2021 - 2034 年
- 主要趨勢
- 咖啡機
- 榨汁機
- 淨水器/飲水機
- 蘇打水和碳酸飲料機
- 其他(茶機、雞尾酒機)
第6章:市場估計與預測:依連結性,2021 - 2034 年
- 主要趨勢
- 支援 Wi-Fi
- 支援藍牙
- 語音啟用
- 應用程式控制
第7章:市場估計與預測:依營運模式,2021 - 2034 年
- 主要趨勢
- 自動的
- 半自動
第8章:市場估計與預測:依價格區間,2021 年至 2034 年
- 主要趨勢
- 低的
- 中等的
- 高的
第9章:市場估計與預測:依最終用途,2021 - 2034 年
- 主要趨勢
- 家庭
- 商業的
- 小型辦公室
- 飯店
- 其他
第 10 章:市場估計與預測:按配銷通路,2021 年至 2034 年
- 主要趨勢
- 線上
- 電子商務網站
- 公司擁有的網站
- 離線
- 超市和大賣場
- 便利商店
- 專賣店
- 其他
第 11 章:市場估計與預測:按地區,2021 年至 2034 年
- 主要趨勢
- 北美洲
- 美國
- 加拿大
- 歐洲
- 德國
- 英國
- 法國
- 義大利
- 西班牙
- 亞太地區
- 中國
- 印度
- 日本
- 韓國
- 拉丁美洲
- 巴西
- 墨西哥
- MEA
- 沙烏地阿拉伯
- 阿拉伯聯合大公國
- 南非
第12章:公司簡介
- Behmor
- Bevi
- Breville
- BSH
- Cafe Appliances
- Coway
- De'Longhi
- Hamilton Beach
- Hurom
- Illy
- Jura
- Kuvings
- Lavazza
- Nespresso
- Smart Soda
The Global Smart Home-Based Beverage Machine Market was valued at USD 1.9 billion in 2024 and is estimated to grow at a CAGR of 8.5% to reach USD 4.2 billion by 2034. A major factor fueling this expansion is the increasing demand for convenience in everyday life. Consumers are gravitating toward solutions that simplify routine tasks, and smart beverage machines are meeting that need. These appliances offer a hassle-free beverage-making experience, requiring minimal user input. Their intuitive operation ensures ease of use, even for those with limited technical knowledge. Users no longer need to rely on manual preparation steps; instead, they enjoy seamless drink-making experiences with just a few simple commands.
The growing integration of Internet of Things (IoT) technology is playing a critical role in transforming the smart beverage machine space. IoT features are allowing these appliances to connect with smartphones and other smart devices, giving users the ability to start brewing remotely from anywhere in the house. Customization features have also become increasingly common. Users can tailor their beverages by adjusting brew strength, temperature settings, and ingredient ratios to their preferences, offering a personalized experience that wasn't previously possible with traditional machines. As lifestyles become more digitally integrated, such features are becoming must-haves in modern homes.
| Market Scope | |
|---|---|
| Start Year | 2024 |
| Forecast Year | 2025-2034 |
| Start Value | $1.9 Billion |
| Forecast Value | $4.2 Billion |
| CAGR | 8.5% |
In terms of functionality, the automatic segment leads the way. As of 2024, it accounted for USD 1.2 billion in revenue and is forecasted to expand at a CAGR of approximately 9% through 2034. Automatic smart beverage machines are designed for maximum convenience, operating with little to no manual effort. Users input their ingredient preferences, and the machine takes care of everything else. These devices typically come equipped with programmable features such as touchscreens, Wi-Fi connectivity, and voice-enabled controls, aligning perfectly with the needs of today's fast-paced consumers. Their ability to deliver consistent results while reducing the need for hands-on operation is a major contributor to their growing popularity.
On the distribution front, online sales are dominating. The online segment generated around USD 1.1 billion in 2024 and is expected to grow at a CAGR of nearly 9% until 2034. This rise is being driven by the increasing prevalence of eCommerce platforms, where consumers can shop with ease from the comfort of their homes. Buyers are drawn to the ability to compare products, read verified reviews, access detailed product information, and watch demonstration videos before making a purchase. The added benefits of better pricing, wider product availability, and quick delivery options make online channels particularly attractive to tech-savvy shoppers. This shift is expected to keep gaining momentum as digital shopping continues to evolve.
Based on usage, households are the primary consumers of smart home-based beverage machines. In 2024, the household segment held a significant 62.1% market share and is anticipated to grow at a CAGR of 9% through 2034. Increasing awareness and adoption of smart appliances that can be controlled through Wi-Fi or Bluetooth is driving growth in this segment. These machines allow users to prepare a variety of beverages-from coffee and tea to smoothies-with minimal effort using a smartphone or voice assistant. With features like energy-efficient brewing, customizable drink settings, and seamless integration with other smart home devices, these machines cater to homeowners seeking both innovation and efficiency in their kitchens.
In North America, the market is thriving, particularly in the United States. The US led the regional market with an estimated value of USD 480 million in 2024, and it is set to grow at a CAGR of 7.5% through 2034. The region's early adoption of smart technologies, combined with a strong preference for convenience, is encouraging consumers to embrace these devices. Many are investing in beverage machines that offer remote control capabilities, voice integration, and other smart features. Consumer interest in premium, tech-enabled kitchen appliances is fueling demand and setting the stage for continued growth.
Key players operating in the smart home beverage machine industry include Behmor, Breville, Bevi, BSH, Coway, De'Longhi, Cafe Appliances, Hamilton Beach, Illy, Jura, Hurom, Kuvings, Nespresso, Lavazza, and Smart Soda. Many of these companies are making strategic investments in innovation, focusing on integrating sustainable materials and energy-saving technologies in response to growing environmental concerns. This focus not only strengthens their competitive edge but also aligns with the shifting expectations of modern consumers.
Table of Contents
Chapter 1 Methodology & Scope
- 1.1 Research design
- 1.1.1 Research approach
- 1.1.2 Data collection methods
- 1.2 Base estimates and calculations
- 1.2.1 Base year calculation
- 1.2.2 Key trends for market estimates
- 1.3 Forecast model
- 1.4 Primary research & validation
- 1.4.1 Primary sources
- 1.4.2 Data mining sources
- 1.5 Market definitions
Chapter 2 Executive Summary
- 2.1 Industry 3600 synopsis, 2021 - 2034
Chapter 3 Industry Insights
- 3.1 Industry ecosystem analysis
- 3.2 Trump administration tariffs analysis
- 3.2.1 Impact on trade
- 3.2.1.1 Trade volume disruptions
- 3.2.1.2 Retaliatory measures
- 3.2.2 Impact on the industry
- 3.2.2.1 Supply-side impact (Raw materials)
- 3.2.2.2 Price volatility in key materials
- 3.2.2.3 Supply chain restructuring
- 3.2.2.4 Production cost implications
- 3.2.2.5 Demand-side impact (Selling price)
- 3.2.2.6 Price transmission to end markets
- 3.2.2.7 Market share dynamics
- 3.2.2.8 Consumer response patterns
- 3.2.3 Key companies impacted
- 3.2.4 Strategic industry responses
- 3.2.4.1 Supply chain reconfiguration
- 3.2.4.2 Pricing and product strategies
- 3.2.4.3 Policy engagement
- 3.2.5 Outlook and future considerations
- 3.2.1 Impact on trade
- 3.3 Supplier landscape
- 3.4 Pricing analysis
- 3.5 Technology & innovation landscape
- 3.6 Key news & initiatives
- 3.7 Regulatory landscape
- 3.8 Manufacturers
- 3.9 Distributors
- 3.10 Retailers
- 3.11 Impact forces
- 3.11.1 Growth drivers
- 3.11.1.1 Rising consumer focus on convenience and efficiency
- 3.11.1.2 Expansion of smart home technology
- 3.11.1.3 Growing popularity of specialty appliances
- 3.11.1.4 Innovative product offerings
- 3.11.2 Industry pitfalls & challenges
- 3.11.2.1 Changing consumer preferences
- 3.11.2.2 High market saturation
- 3.11.1 Growth drivers
- 3.12 Technology & innovation landscape
- 3.13 Consumer buying behavior analysis
- 3.14 Growth potential analysis
- 3.15 Regulatory landscape
- 3.16 Pricing analysis
- 3.17 Porter's analysis
- 3.18 PESTEL analysis
Chapter 4 Competitive Landscape, 2024
- 4.1 Introduction
- 4.2 Company market share analysis
- 4.3 Competitive positioning matrix
- 4.4 Strategic outlook matrix
Chapter 5 Market Estimates & Forecast, By Product Type, 2021 - 2034, (USD Billion) (thousand units)
- 5.1 Key trends
- 5.2 Coffee machines
- 5.3 Juice machines
- 5.4 Water purifiers/dispensers
- 5.5 Soda and carbonated beverage machines
- 5.6 Others (tea machines, cocktail machines)
Chapter 6 Market Estimates & Forecast, By Connectivity, 2021 - 2034, (USD Billion) (thousand units)
- 6.1 Key trends
- 6.2 Wi-fi-enabled
- 6.3 Bluetooth-enabled
- 6.4 Voice-activated
- 6.5 App-controlled
Chapter 7 Market Estimates & Forecast, By Operational Mode, 2021 - 2034, (USD Billion) (Thousand Units)
- 7.1 Key trends
- 7.2 Automatic
- 7.3 Semi-automatic
Chapter 8 Market Estimates & Forecast, By Price Range, 2021 - 2034, (USD Billion) (Thousand Units)
- 8.1 Key trends
- 8.2 Low
- 8.3 Medium
- 8.4 High
Chapter 9 Market Estimates & Forecast, By End Use, 2021 - 2034, (USD Billion) (Thousand Units)
- 9.1 Key trends
- 9.2 Households
- 9.3 Commercial
- 9.3.1 Small offices
- 9.3.2 Hotels
- 9.3.3 Others
Chapter 10 Market Estimates & Forecast, By Distribution Channel, 2021 - 2034, (USD Billion) (Thousand Units)
- 10.1 Key trends
- 10.2 Online
- 10.2.1 E-commerce website
- 10.2.2 Company owned website
- 10.3 Offline
- 10.3.1 Supermarkets & hypermarkets
- 10.3.2 Convenience stores
- 10.3.3 Specialty stores
- 10.3.4 Others
Chapter 11 Market Estimates & Forecast, By Region, 2021 - 2034, (USD Billion) (Thousand Units)
- 11.1 Key trends
- 11.2 North America
- 11.2.1 U.S.
- 11.2.2 Canada
- 11.3 Europe
- 11.3.1 Germany
- 11.3.2 UK
- 11.3.3 France
- 11.3.4 Italy
- 11.3.5 Spain
- 11.4 Asia Pacific
- 11.4.1 China
- 11.4.2 India
- 11.4.3 Japan
- 11.4.4 South Korea
- 11.5 Latin America
- 11.5.1 Brazil
- 11.5.2 Mexico
- 11.6 MEA
- 11.6.1 Saudi Arabia
- 11.6.2 UAE
- 11.6.3 South Africa
Chapter 12 Company Profiles
- 12.1 Behmor
- 12.2 Bevi
- 12.3 Breville
- 12.4 BSH
- 12.5 Cafe Appliances
- 12.6 Coway
- 12.7 De’Longhi
- 12.8 Hamilton Beach
- 12.9 Hurom
- 12.10 Illy
- 12.11 Jura
- 12.12 Kuvings
- 12.13 Lavazza
- 12.14 Nespresso
- 12.15 Smart Soda

