


 |
市場調查報告書
商品編碼
1740867
再生能源證書 (REC) 市場機會、成長動力、產業趨勢分析及 2025 - 2034 年預測Renewable Energy Certificate (REC) Market Opportunity, Growth Drivers, Industry Trend Analysis, and Forecast 2025 - 2034 |
||||||
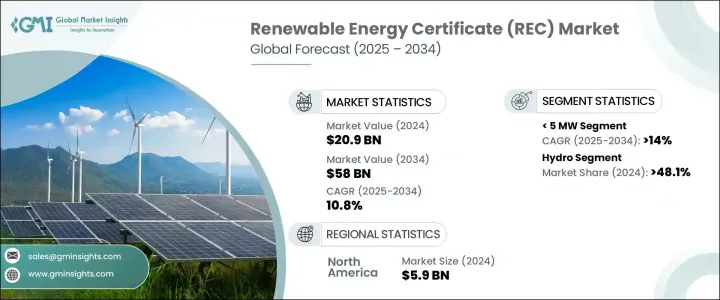
2024年,全球再生能源證書市場規模達209億美元,預計到2034年將以10.8%的複合年成長率成長,達到580億美元。這得益於全球對永續能源的需求不斷成長,以及企業和消費者環境責任意識的不斷增強。這一顯著的成長軌跡得益於技術創新、扶持性政策以及全球能源策略向清潔能源轉型等因素的共同推動。
先進技術的整合顯著改善了市場運作,尤其是在提高透明度和減少詐欺活動的可能性方面。區塊鏈在實現安全、可追溯的再生能源證書交易方面發揮關鍵作用,這對於維護證書的真實性和可信度至關重要。此外,國際認證協定等標準化架構有助於簡化不同地理市場之間再生能源證書的簽發和交易,使跨境貿易更加順暢、有效率。
| 市場範圍 | |
|---|---|
| 起始年份 | 2024 |
| 預測年份 | 2025-2034 |
| 起始值 | 209億美元 |
| 預測值 | 580億美元 |
| 複合年成長率 | 10.8% |
再生能源證書 (REC) 在許多國家持續受到歡迎,越來越多的企業和個人將其視為更廣泛的永續發展目標的一部分。這些證書是利用風能、太陽能、水力發電或生質能等再生能源生產一定量電力的官方證明。對於致力於實現碳中和目標的公司而言,REC 提供了一種實用且可驗證的途徑,無需直接生產再生能源即可支援再生能源。
就容量細分而言,市場分為5兆瓦以下、5兆瓦以上至15兆瓦、15兆瓦以上至30兆瓦以及30兆瓦以上。其中,5兆瓦市場預計將實現最快成長,預計到2034年的複合年成長率將超過14%。這一成長主要歸因於小型太陽能發電場的不斷增加,隨著全球技術成本下降和安裝效率提高,小型太陽能發電場正變得越來越普遍。
從能源來源角度來看,市場可分為生物能源、太陽能、風能、水力、廢棄物及其他能源類別。 2024年,水力發電佔據市場主導地位,佔再生能源證書(REC)交易總額的48.1%以上。其領先地位得益於政府的積極支持,這些支持透過激勵措施和政策框架鼓勵水力發電發展。水力發電的高效性和可靠性使其成為那些希望在不犧牲能源供應穩定性的情況下擴大再生能源產能的國家的理想選擇。
北美繼續在全球再生能源證書 (REC) 產業中扮演重要角色,其市場規模預計在 2022 年達到 50 億美元,2023 年達到 54 億美元,2024 年達到 59 億美元。該地區致力於向清潔能源轉型並實現雄心勃勃的碳減排目標,這使得再生能源證書 (REC) 成為其永續發展基礎設施不可或缺的一部分。合規要求、企業自願承諾以及先進的能源採購實踐正在推動北美對再生能源證書 (REC) 的需求不斷成長。
再生能源證書 (REC) 是企業和公用事業公司遵守環境法規和內部永續發展目標的關鍵機制。透過取得 REC,企業可以展示其對再生能源發電的支持,並在不改變其實際能源消耗結構的情況下為減少溫室氣體排放做出貢獻。這種靈活性使得 REC 對於尋求提升環境、社會和治理 (ESG) 形象的企業尤其具有吸引力。
市場領導地位集中在少數幾家公司手中,這些公司合計佔超過30%的市場。這些公司包括一些在數位平台、國際合作夥伴關係和綜合能源交易網路方面投入大量資金的主要參與者。策略合作關係、長期合約和持續的技術進步鞏固了他們的主導地位。其中許多公司還推出了創新工具和資料平台,旨在提高市場透明度並支援客戶的REC投資組合管理。
目錄
第1章:方法論與範圍
第2章:執行摘要
第3章:行業洞察
- 產業生態系統分析
- 川普政府關稅分析
- 對貿易的影響
- 貿易量中斷
- 報復措施
- 對產業的影響
- 供給側影響(原料)
- 主要材料價格波動
- 供應鏈重組
- 生產成本影響
- 需求面影響(售價)
- 價格傳導至終端市場
- 市佔率動態
- 消費者反應模式
- 供給側影響(原料)
- 受影響的主要公司
- 策略產業反應
- 供應鏈重組
- 定價和產品策略
- 政策參與
- 展望與未來考慮
- 對貿易的影響
- 監管格局
- 產業衝擊力
- 成長動力
- 產業陷阱與挑戰
- 成長潛力分析
- 波特的分析
- PESTEL分析
第4章:競爭格局
- 介紹
- 戰略儀表板
- 策略舉措
- 公司市佔率
- 競爭基準測試
- 創新與永續發展格局
第5章:市場規模及預測:依產能,2021 - 2034 年
- 主要趨勢
- < 5 兆瓦
- > 5 兆瓦 - 15 兆瓦
- > 15 兆瓦 - 30 兆瓦
- > 30 兆瓦
第6章:市場規模及預測:依類型,2021 - 2034
- 主要趨勢
- 自願
- 遵守
第7章:市場規模及預測:依來源,2021 - 2034
- 主要趨勢
- 生物能源
- 水力發電
- 太陽的
- 風
- 浪費
- 其他
第8章:市場規模及預測:按地區,2021 - 2034
- 主要趨勢
- 北美洲
- 歐洲
- 亞太地區
- 世界其他地區
第9章:公司簡介
- 3Degrees
- Ecohz
- Shell
- Statkraft
- Xpansiv
- ENGIE
- Enel Green Power
- STX Group
- TerraPass
- BEF
- Targray
- Ameresco
- Sterling Planet
- Constellation
The Global Renewable Energy Certificate Market was valued at USD 20.9 billion in 2024 and is estimated to grow at a CAGR of 10.8% to reach USD 58 billion by 2034, driven by growing global demand for sustainable energy and increasing awareness of environmental responsibility among corporations and consumers. This significant growth trajectory is fueled by a combination of technological innovations, supportive policies, and a shift in global energy strategies toward cleaner sources.
The integration of advanced technologies has notably improved market operations, particularly in enhancing transparency and reducing the chances of fraudulent activities. Blockchain is playing a key role by enabling secure, traceable REC transactions, which is critical for maintaining the authenticity and trustworthiness of certificates. Additionally, standardized frameworks such as international certification protocols have helped streamline the issuance and trading of RECs across different geographic markets, making cross-border trade smoother and more efficient.
| Market Scope | |
|---|---|
| Start Year | 2024 |
| Forecast Year | 2025-2034 |
| Start Value | $20.9 Billion |
| Forecast Value | $58 Billion |
| CAGR | 10.8% |
RECs continue to gain traction in numerous countries, with a growing number of businesses and individuals embracing them as part of broader sustainability goals. These certificates serve as official proof of the generation of a specific amount of electricity from renewable sources such as wind, solar, hydro, or biomass. For companies aiming to meet carbon neutrality goals, RECs provide a practical and verifiable path to support renewable energy without the need to generate it directly.
In terms of capacity segmentation, the market is categorized into installations of 5 MW, greater than 5 MW up to 15 MW, over 15 MW up to 30 MW, and those exceeding 30 MW. Among these, the 5 MW segment is expected to witness the fastest growth, with a projected CAGR of more than 14% through 2034. This growth is largely attributed to the increasing deployment of small-scale solar farms, which are becoming more common as technological costs decline and installation efficiency improves globally.
From a source perspective, the market is classified into categories such as bioenergy, solar, wind, hydro, waste, and others. Hydropower led the market in 2024, accounting for over 48.1% of total REC transactions. Its leading position is driven by favorable governmental support, which encourages hydro adoption through incentives and policy frameworks. Hydro energy's high efficiency and reliability make it an appealing option for nations looking to expand renewable capacity without sacrificing consistency in energy supply.
North America continues to be a significant player in the global REC industry, with the market valued at USD 5 billion in 2022, USD 5.4 billion in 2023, and USD 5.9 billion in 2024. The region's focus on transitioning toward clean energy and meeting ambitious carbon reduction targets has made RECs an integral part of its sustainability infrastructure. Increasing demand for RECs in North America is being shaped by compliance mandates, voluntary corporate commitments, and progressive energy procurement practices.
RECs serve as a critical mechanism for businesses and utilities to align with environmental mandates and internal sustainability goals. By acquiring RECs, organizations demonstrate their support for renewable power generation and contribute to reducing greenhouse gas emissions without altering their physical energy consumption setup. This flexibility has made RECs particularly attractive to enterprises seeking to enhance their environmental, social, and governance (ESG) profiles.
Market leadership is concentrated among a handful of firms that collectively hold over 30% of the market share. These include major players who have made substantial investments in digital platforms, international partnerships, and integrated energy trading networks. Their dominance is reinforced by strategic relationships, long-term contracts, and ongoing technological advancements. Many of these companies have also introduced innovative tools and data platforms aimed at increasing market transparency and supporting REC portfolio management for their clients.
Table of Contents
Chapter 1 Methodology & Scope
- 1.1 Market scope & definitions
- 1.2 Market estimates & forecast parameters
- 1.3 Forecast calculation
- 1.4 Data sources
- 1.4.1 Primary
- 1.4.2 Secondary
- 1.4.2.1 Paid
- 1.4.2.2 Public
Chapter 2 Executive Summary
- 2.1 Industry synopsis, 2021 - 2034
Chapter 3 Industry Insights
- 3.1 Industry ecosystem analysis
- 3.2 Trump administration tariffs analysis
- 3.2.1 Impact on trade
- 3.2.1.1 Trade volume disruptions
- 3.2.1.2 Retaliatory measures
- 3.2.2 Impact on the industry
- 3.2.2.1 Supply-side impact (raw materials)
- 3.2.2.1.1 Price volatility in key materials
- 3.2.2.1.2 Supply chain restructuring
- 3.2.2.1.3 Production cost implications
- 3.2.2.2 Demand-side impact (selling price)
- 3.2.2.2.1 Price transmission to end markets
- 3.2.2.2.2 Market share dynamics
- 3.2.2.2.3 Consumer response patterns
- 3.2.2.1 Supply-side impact (raw materials)
- 3.2.3 Key companies impacted
- 3.2.4 Strategic industry responses
- 3.2.4.1.1 Supply chain reconfiguration
- 3.2.4.1.2 Pricing and product strategies
- 3.2.4.1.3 Policy engagement
- 3.2.5 Outlook and future considerations
- 3.2.1 Impact on trade
- 3.3 Regulatory landscape
- 3.4 Industry impact forces
- 3.4.1 Growth drivers
- 3.4.2 Industry pitfalls & challenges
- 3.5 Growth potential analysis
- 3.6 Porter's analysis
- 3.6.1 Bargaining power of suppliers
- 3.6.2 Bargaining power of buyers
- 3.6.3 Threat of new entrants
- 3.6.4 Threat of substitutes
- 3.7 PESTEL analysis
Chapter 4 Competitive Landscape, 2024
- 4.1 Introduction
- 4.2 Strategic dashboard
- 4.3 Strategic initiative
- 4.4 Company market share
- 4.5 Competitive benchmarking
- 4.6 Innovation & sustainability landscape
Chapter 5 Market Size and Forecast, By Capacity, 2021 - 2034 (USD Billion)
- 5.1 Key trends
- 5.2 < 5 MW
- 5.3 > 5 MW - 15 MW
- 5.4 > 15 MW - 30 MW
- 5.5 > 30 MW
Chapter 6 Market Size and Forecast, By Type, 2021 - 2034 (USD Billion)
- 6.1 Key trends
- 6.2 Voluntary
- 6.3 Compliance
Chapter 7 Market Size and Forecast, By Source, 2021 - 2034 (USD Billion)
- 7.1 Key trends
- 7.2 Bioenergy
- 7.3 Hydro
- 7.4 Solar
- 7.5 Wind
- 7.6 Waste
- 7.7 Others
Chapter 8 Market Size and Forecast, By Region, 2021 - 2034 (USD Billion)
- 8.1 Key trends
- 8.2 North America
- 8.3 Europe
- 8.4 Asia Pacific
- 8.5 Rest of world
Chapter 9 Company Profiles
- 9.1 3Degrees
- 9.2 Ecohz
- 9.3 Shell
- 9.4 Statkraft
- 9.5 Xpansiv
- 9.6 ENGIE
- 9.7 Enel Green Power
- 9.8 STX Group
- 9.9 TerraPass
- 9.10 BEF
- 9.11 Targray
- 9.12 Ameresco
- 9.13 Sterling Planet
- 9.14 Constellation
 2026-2030年全球能源屬性證書(EAC)交易平台市場
 2026年全球可再生能源認證(REC)市場報告
 可再生能源證書市場預測至2032年:按類型、能源來源、發電工程容量、最終用戶和地區分類的全球分析
 全球可再生能源證書市場
 全球可再生能源證書 (REC) 市場(按容量、能源類型、最終用途和地區分類)- 2030 年預測
 美國的再生能源證書市場評估:各類能源,各容量,各最終用途,各地區,機會,預測,2018年~2032年全球再生能源證書(REC)市場評估:依能源類型、容量、最終用途、地區、機會和預測(2018-2032年)REC(可再生能源證書)的全球市場、到 2033 年的機會和策略