


 |
市場調查報告書
商品編碼
1740846
永續製造設備市場機會、成長動力、產業趨勢分析及 2025 - 2034 年預測Sustainable Manufacturing Equipment Market Opportunity, Growth Drivers, Industry Trend Analysis, and Forecast 2025 - 2034 |
||||||
2024 年全球永續製造設備市場規模達 2,443 億美元,預計到 2034 年將以 2.3% 的複合年成長率成長至 3,060 億美元。日益成長的環境問題和企業減少碳排放的承諾不斷增加,促使製造商採用環保生產技術。企業正在積極轉向永續設備,以符合氣候目標並提高長期獲利能力。這一趨勢背後的主要驅動力是向循環生產系統的過渡,該系統強調有效利用資源和減少廢物產生。為了實現這一目標,製造商正在徹底改革產品設計策略,優先考慮耐用性、易拆卸性和可回收性——這需要專門的設備來支援這些轉變。這種轉變不僅是為了減少對環境的影響;它還透過重複使用和回收材料創造了新的收入來源,同時降低了原料成本。因此,整合永續製造實踐已成為一項策略性舉措,而非一項監管義務。
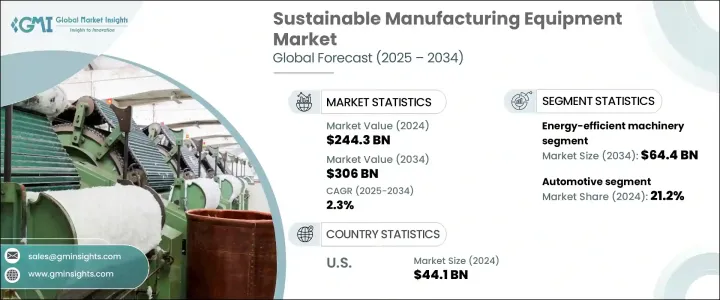
世界各國政府正透過優惠立法、稅收抵免和資助計畫支持這項轉變。這些舉措旨在透過降低採用新技術的財務障礙來加速向清潔製造的轉型。在這種不斷變化的情況下,投資永續設備的公司更有能力遵守新興法規並抓住新的市場機會。隨著企業尋求既能滿足效率標準又能提升營運績效的技術,設備製造商的需求也不斷成長。人們對環保解決方案日益成長的興趣正在培育一種競爭激烈、創新驅動的市場氛圍。
| 市場範圍 | |
|---|---|
| 起始年份 | 2024 |
| 預測年份 | 2025-2034 |
| 起始值 | 2443億美元 |
| 預測值 | 3060億美元 |
| 複合年成長率 | 2.3% |
在各類設備中,節能機械以2024年572億美元的營收領跑市場,預計2034年將成長至644億美元。節能系統在各行各業的廣泛應用,加上其降低營運成本的能力,使其成為整個市場中最突出的類別。希望降低能耗和營運效率的企業正在投資升級設備,以大幅節省水電費。由於這些投資對能源費用和生產力有直接影響,通常被視為低風險、高回報的決策。此外,許多此類系統符合財務支援條件,這使得初始採用成本更易於管理,並吸引更廣泛的企業。
永續製造設備市場按終端用戶產業細分,2024年,汽車產業成為最大貢獻者,收入達519億美元,約佔總市場佔有率的21.2%。汽車產業注重清潔生產流程和節能減排,使其成為採用永續設備的領導者。該行業面臨著減少排放和精簡供應鏈的巨大壓力,這促使其大力投資於支持更負責任製造實踐的技術。透過實施節能系統和減排工具,汽車製造商正在努力實現永續發展目標,並在不斷變化的市場中保持競爭力。
在區域分析中,美國在2024年佔據了永續製造設備市場的441億美元,預計2025年至2034年的複合年成長率將達到1.6%。美國強大的工業生態系統及其對綠色技術創新的投入,使其成為該領域的關鍵參與者。在監管壓力和企業責任框架的推動下,美國製造商在採用永續生產工具方面處於領先地位。政府主導的措施和激勵計劃進一步鼓勵企業向更清潔的技術轉型。這些努力得到了美國境內密集的設備供應商和技術公司網路的支持,從而能夠更快地整合尖端解決方案。
永續製造設備領域的主要公司包括ABB有限公司、3D系統公司、阿特拉斯·科普柯公司、艾默生電氣公司、博世力士樂公司、發那科公司、霍尼韋爾國際公司、通用電氣公司、三菱電機公司、施耐德電氣公司、羅克韋爾自動化公司、西門子股份公司、威立雅環境公司、利樂國際公司和安川電機公司、利樂國際公司和安川電機公司。這些公司正在積極投資研發並擴展其產品線,以滿足對永續高效製造解決方案日益成長的需求。
目錄
第1章:方法論與範圍
第2章:執行摘要
第3章:行業洞察
- 產業生態系統分析
- 影響價值鏈的因素
- 利潤率分析
- 中斷
- 未來展望
- 製造商
- 經銷商
- 川普政府關稅分析
- 對貿易的影響
- 貿易量中斷
- 報復措施
- 對產業的影響
- 供給側影響(原料)
- 主要材料價格波動
- 供應鏈重組
- 生產成本影響
- 需求面影響(售價)
- 價格傳導至終端市場
- 市佔率動態
- 消費者反應模式
- 供給側影響(原料)
- 受影響的主要公司
- 策略產業回應
- 供應鏈重構
- 定價和產品策略
- 政策參與
- 展望與未來考慮
- 對貿易的影響
- 供應商格局
- 技術概述
- 重要新聞和舉措
- 監管格局
- 衝擊力
- 成長動力
- 企業對淨零排放的承諾
- 採用循環經濟原則
- 政府法規和激勵措施
- 產業陷阱與挑戰
- 初始投資成本高
- 監理合規的複雜性
- 成長動力
- 成長潛力分析
- 波特的分析
- PESTEL分析
第4章:競爭格局
- 介紹
- 公司市佔率分析
- 競爭定位矩陣
- 戰略展望矩陣
第5章:市場估計與預測:依設備類型,2021 - 2034 年
- 主要趨勢
- 節能機械
- 廢棄物管理設備
- 水和廢水處理設備
- 碳排放控制系統
- 再生能源整合設備
- 智慧製造及監控設備
- 永續包裝設備
- 積層製造設備
- 其他(材料回收系統等)
第6章:市場估計與預測:按最終用途產業,2021 - 2034 年
- 主要趨勢
- 汽車
- 電子和半導體
- 食品和飲料
- 化學製造
- 製藥
- 金屬和採礦
- 消費品
- 其他(紡織製造等)
第7章:市場估計與預測:依最終用途,2021 - 2034 年
- 主要趨勢
- 大型企業
- 中小企業(SMEs)
- 政府及研究機構
- 永續製造新創企業
第8章:市場估計與預測:按配銷通路,2021 - 2034 年
- 主要趨勢
- 直接的
- 間接
第9章:市場估計與預測:按地區,2021 - 2034 年
- 主要趨勢
- 北美洲
- 美國
- 加拿大
- 歐洲
- 德國
- 英國
- 法國
- 義大利
- 西班牙
- 亞太地區
- 中國
- 印度
- 日本
- 韓國
- 澳洲
- 拉丁美洲
- 巴西
- 墨西哥
- 阿根廷
- MEA
- 阿拉伯聯合大公國
- 沙烏地阿拉伯
- 南非
第10章:公司簡介
- 3D Systems Corporation
- ABB Ltd.
- Atlas Copco AB
- Bosch Rexroth AG
- Emerson Electric Co.
- FANUC Corporation
- General Electric (GE) Company
- Honeywell International Inc.
- Mitsubishi Electric Corporation
- Rockwell Automation, Inc.
- Schneider Electric SE
- Siemens AG
- Tetra Pak International SA
- Veolia Environment SA
- Yaskawa Electric Corporation
The Global Sustainable Manufacturing Equipment Market was valued at USD 244.3 billion in 2024 and is estimated to grow at a CAGR of 2.3% to reach USD 306 billion by 2034. Growing environmental concerns and increasing corporate commitments to reduce carbon emissions are pushing manufacturers to adopt eco-friendly production technologies. Companies are actively shifting toward sustainable equipment to align with climate targets and improve long-term profitability. A major driver behind this trend is the transition to circular production systems, which emphasize efficient resource use and reduced waste generation. To achieve this, manufacturers are overhauling product design strategies to prioritize longevity, ease of disassembly, and recyclability-requiring specialized equipment to support such changes. This transformation is not just about reducing environmental impact; it also creates new avenues for revenue through reuse and recycled materials while cutting down on raw material expenses. As a result, integrating sustainable manufacturing practices has become a strategic move rather than a regulatory obligation.
Governments around the world are supporting this shift through favorable legislation, tax credits, and funding programs. These initiatives are designed to accelerate the transition to cleaner manufacturing by reducing the financial barriers to adopting new technologies. In this evolving landscape, companies that invest in sustainable equipment are better positioned to stay compliant with emerging regulations and tap into new market opportunities. Equipment manufacturers are also experiencing heightened demand, as businesses seek technologies that can meet efficiency standards while driving operational performance. This growing interest in environmentally sound solutions is fostering a competitive and innovation-driven market atmosphere.
| Market Scope | |
|---|---|
| Start Year | 2024 |
| Forecast Year | 2025-2034 |
| Start Value | $244.3 Billion |
| Forecast Value | $306 Billion |
| CAGR | 2.3% |
Among various equipment types, energy-efficient machinery led the market with a revenue of USD 57.2 billion in 2024 and is anticipated to grow to USD 64.4 billion by 2034. The widespread use of energy-efficient systems across multiple industries, combined with their ability to lower operating costs, makes this category the most prominent in the overall market. Businesses looking to reduce power consumption and operational inefficiencies are investing in upgraded machines that deliver measurable savings on utilities. These investments are typically seen as low-risk, high-reward decisions due to their direct impact on energy bills and productivity. Moreover, many of these systems qualify for financial support, making the initial cost of adoption more manageable and attractive to a wider range of companies.
The sustainable manufacturing equipment market is segmented by end-user industry, and in 2024, the automotive sector emerged as the largest contributor with USD 51.9 billion in revenue, capturing approximately 21.2% of the total market share. The automotive industry's focus on clean production processes and energy conservation has made it a frontrunner in adopting sustainable equipment. The sector faces considerable pressure to reduce emissions and streamline its supply chains, prompting heavy investment in technologies that support more responsible manufacturing practices. By implementing energy-saving systems and emission-reduction tools, automakers are striving to meet sustainability goals and maintain competitiveness in an evolving marketplace.
In regional analysis, the United States accounted for USD 44.1 billion of the sustainable manufacturing equipment market in 2024 and is expected to register a CAGR of 1.6% from 2025 to 2034. The country's strong industrial ecosystem and commitment to innovation in green technology position it as a key player in this space. American manufacturers are leading the way in adopting sustainable production tools, driven by both regulatory pressure and corporate responsibility frameworks. The availability of government-led initiatives and incentive programs has further encouraged companies to transition toward cleaner technologies. These efforts are supported by a dense network of equipment providers and technology firms operating within the country, allowing faster integration of cutting-edge solutions.
Key companies in the sustainable manufacturing equipment space include ABB Ltd., 3D Systems Corporation, Atlas Copco AB, Emerson Electric Co., Bosch Rexroth AG, FANUC Corporation, Honeywell International Inc., General Electric (GE) Company, Mitsubishi Electric Corporation, Schneider Electric SE, Rockwell Automation, Inc., Siemens AG, Veolia Environment S.A., Tetra Pak International S.A., and Yaskawa Electric Corporation. These players are actively investing in R&D and expanding their offerings to meet the growing demand for sustainable and efficient manufacturing solutions.
Table of Contents
Chapter 1 Methodology & Scope
- 1.1 Market scope & definition
- 1.2 Base estimates & calculations
- 1.3 Forecast parameters
- 1.4 Data sources
- 1.4.1 Primary
- 1.4.2 Secondary
- 1.4.2.1 Paid sources
- 1.4.2.2 Public sources
Chapter 2 Executive Summary
- 2.1 Industry 3600 synopsis, 2021 - 2034
Chapter 3 Industry Insights
- 3.1 Industry ecosystem analysis
- 3.1.1 Factor affecting the value chain
- 3.1.2 Profit margin analysis
- 3.1.3 Disruptions
- 3.1.4 Future outlook
- 3.1.5 Manufacturers
- 3.1.6 Distributors
- 3.2 Trump Administration Tariffs Analysis
- 3.2.1 Impact on Trade
- 3.2.1.1 Trade Volume Disruptions
- 3.2.1.2 Retaliatory Measures
- 3.2.2 Impact on the Industry
- 3.2.2.1 Supply-Side Impact (Raw Materials)
- 3.2.2.1.1 Price Volatility in Key Materials
- 3.2.2.1.2 Supply Chain Restructuring
- 3.2.2.1.3 Production Cost Implications
- 3.2.2.2 Demand-Side Impact (Selling Price)
- 3.2.2.2.1 Price Transmission to End Markets
- 3.2.2.2.2 Market Share Dynamics
- 3.2.2.2.3 Consumer Response Patterns
- 3.2.2.1 Supply-Side Impact (Raw Materials)
- 3.2.3 Key Companies Impacted
- 3.2.4 Strategic Industry Responses
- 3.2.4.1 Supply Chain Reconfiguration
- 3.2.4.2 Pricing and Product Strategies
- 3.2.4.3 Policy Engagement
- 3.2.5 Outlook and Future Considerations
- 3.2.1 Impact on Trade
- 3.3 Supplier landscape
- 3.4 Technological overview
- 3.5 Key news & initiatives
- 3.6 Regulatory landscape
- 3.7 Impact forces
- 3.7.1 Growth drivers
- 3.7.1.1 Corporate Commitments to Net-Zero Emissions
- 3.7.1.2 Adoption of Circular Economy Principles
- 3.7.1.3 Government Regulations and Incentives
- 3.7.2 Industry pitfalls & challenges
- 3.7.2.1 High Initial Investment Costs
- 3.7.2.2 Complexity of Regulatory Compliance
- 3.7.1 Growth drivers
- 3.8 Growth potential analysis
- 3.9 Porter's analysis
- 3.10 PESTEL analysis
Chapter 4 Competitive Landscape, 2024
- 4.1 Introduction
- 4.2 Company market share analysis
- 4.3 Competitive positioning matrix
- 4.4 Strategic outlook matrix
Chapter 5 Market Estimates & Forecast, By Equipment Type, 2021 - 2034 (USD Billion) (Thousand Units)
- 5.1 Key Trends
- 5.2 Energy-efficient Machinery
- 5.3 Waste Management Equipment
- 5.4 Water & Wastewater Treatment Equipment
- 5.5 Carbon Emission Control Systems
- 5.6 Renewable Energy Integration Equipment
- 5.7 Smart Manufacturing & Monitoring Equipment
- 5.8 Sustainable Packaging Equipment
- 5.9 Additive Manufacturing Equipment
- 5.10 Others (Material Recovery Systems, etc.)
Chapter 6 Market Estimates & Forecast, By End Use Industry, 2021 - 2034 (USD Billion) (Thousand Units)
- 6.1 Key trends
- 6.2 Automotive
- 6.3 Electronics and Semiconductor
- 6.4 Food and Beverage
- 6.5 Chemical Manufacturing
- 6.6 Pharmaceuticals
- 6.7 Metals and Mining
- 6.8 Consumer Goods
- 6.9 Others (Textile Manufacturing, etc.)
Chapter 7 Market Estimates & Forecast, By End Use, 2021 - 2034, (USD Billion) (Thousand Units)
- 7.1 Key trends
- 7.2 Large Enterprises
- 7.3 Small & Medium Enterprises (SMEs)
- 7.4 Government & Research Institutes
- 7.5 Sustainable Manufacturing Startups
Chapter 8 Market Estimates & Forecast, By Distribution Channel, 2021 - 2034, (USD Billion) (Thousand Units)
- 8.1 Key trends
- 8.2 Direct
- 8.3 Indirect
Chapter 9 Market Estimates & Forecast, By Region, 2021 - 2034, (USD Billion) (Thousand Units)
- 9.1 Key trends
- 9.2 North America
- 9.2.1 U.S.
- 9.2.2 Canada
- 9.3 Europe
- 9.3.1 Germany
- 9.3.2 U.K.
- 9.3.3 France
- 9.3.4 Italy
- 9.3.5 Spain
- 9.4 Asia Pacific
- 9.4.1 China
- 9.4.2 India
- 9.4.3 Japan
- 9.4.4 South Korea
- 9.4.5 Australia
- 9.5 Latin America
- 9.5.1 Brazil
- 9.5.2 Mexico
- 9.5.3 Argentina
- 9.6 MEA
- 9.6.1 UAE
- 9.6.2 Saudi Arabia
- 9.6.3 South Africa
Chapter 10 Company Profiles (Business Overview, Financial Data, Product Landscape, Strategic Outlook, SWOT Analysis)
- 10.1 3D Systems Corporation
- 10.2 ABB Ltd.
- 10.3 Atlas Copco AB
- 10.4 Bosch Rexroth AG
- 10.5 Emerson Electric Co.
- 10.6 FANUC Corporation
- 10.7 General Electric (GE) Company
- 10.8 Honeywell International Inc.
- 10.9 Mitsubishi Electric Corporation
- 10.10 Rockwell Automation, Inc.
- 10.11 Schneider Electric SE
- 10.12 Siemens AG
- 10.13 Tetra Pak International S.A.
- 10.14 Veolia Environment S.A.
- 10.15 Yaskawa Electric Corporation
 永續製造市場分析及預測(至2034年):類型、產品、服務、技術、組件、應用、材料類型、流程、最終用戶、解決方案
 永續製造市場:按材料、最終用途、製程、技術、設備類型、服務類型和應用分類-2025-2032年全球預測混凝土管材和砌塊製造市場:依產品類型、應用、最終用戶、製造流程和尺寸範圍分類-2025年至2032年全球預測
 2025年永續製造全球市場報告
 工業與製造業調查:機器人技術(2024財年下半年/2025財年上半年)
 全球精密金屬車床加工市場全球永續製造市場
 按行業、技術和地區分類的全球製造業市場
 金屬精密車削產品製造:市場佔有率分析、產業趨勢與統計、成長預測(2025-2030 年)
 製造業研究回顧:2024 年