


 |
市場調查報告書
商品編碼
1740814
壽司級海鮮市場機會、成長動力、產業趨勢分析及 2025 - 2034 年預測Sushi Grade Seafood Market Opportunity, Growth Drivers, Industry Trend Analysis, and Forecast 2025 - 2034 |
||||||
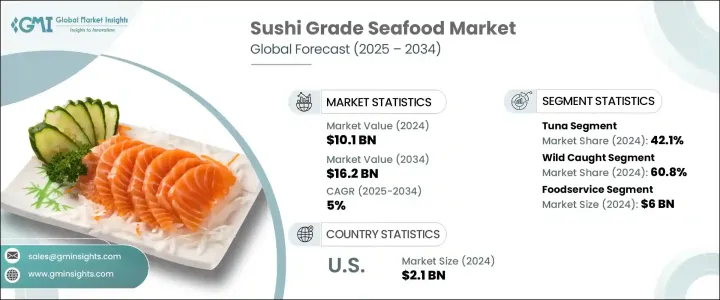
2024年,全球壽司級海鮮市場規模達101億美元,預計2034年將以5%的複合年成長率成長至162億美元。這一強勁的成長勢頭反映出全球對優質海鮮的需求日益成長,尤其是在壽司日益受到不同人群和地區的青睞的背景下。人們對日本料理的興趣日益濃厚,加之人們的健康意識不斷增強以及對高階餐飲體驗的追求,推動了壽司級海鮮需求的大幅成長。這些產品不僅是一種烹飪潮流,更是注重健康的消費者尋求營養豐富、清潔標籤蛋白質的生活方式選擇。壽司級海鮮符合嚴格的品質、安全和新鮮度標準,使其既適合生食,又不會損害健康。嚴格的冷鏈物流和溫度控制消除了寄生蟲和病原體的風險,確保海鮮從捕撈到餐桌的整個過程中始終保持安全新鮮。
全球市場正在經歷消費習慣和購買管道的轉變。隨著消費者對壽司和生鮮海鮮烹飪知識的日益豐富,許多人開始自信地在家中烹飪。零售商和線上海鮮平台正抓住這一趨勢,提供符合專業標準的精選壽司級魚類。從高級餐廳到家庭廚房,壽司級海鮮如今已成為現代消費者飲食中不可或缺的一部分,尤其是在追求高蛋白、低脂肪和營養豐富的消費者群體中。社群媒體和數位飲食文化進一步刺激了這一需求,壽司在美食部落格、網紅內容和健康生活方式趨勢中佔據顯著位置。家庭餐盒和訂閱式海鮮配送服務的普及也擴大了市場,讓消費者足不出戶即可享用餐廳品質的壽司。
| 市場範圍 | |
|---|---|
| 起始年份 | 2024 |
| 預測年份 | 2025-2034 |
| 起始值 | 101億美元 |
| 預測值 | 162億美元 |
| 複合年成長率 | 5% |
在美國,壽司級海鮮仍然是一個突出的類別,2024 年市場規模達 21 億美元,預計到 2034 年複合年成長率將穩定在 5%。美國市場受益於強大的外食文化,但隨著消費者越來越習慣在家製作壽司,壽司零售額也正在增加。沿海城市繼續引領消費,但由於更完善的物流和覆蓋全國的分銷網路,壽司的受歡迎程度正在向內陸地區擴展。線上海鮮零售商和特色食品雜貨商是這項變革的關鍵參與者,他們提供新鮮、高品質、完全可追溯且經過認證的海鮮,吸引了注重環保和健康的消費者。
亞洲作為壽司生產大國和主要消費市場,依然佔據主導地位,其主導力量是擁有豐富烹飪傳統的國家。然而,歐洲正在迅速趕上,越來越多的壽司餐廳和高級超市向更廣泛的消費者群體推出壽司級產品。在收入成長和飲食偏好變化的推動下,英國、德國和法國等國家在這一領域實現了兩位數的成長。
依產品類型分類,市場可分為鮪魚、蝦、鮭魚等。鮪魚佔最大的市場佔有率,2024 年為 42.1%。鮪魚以其絲滑的口感、濃郁的風味和高階的定位而聞名,仍然是壽司愛好者的首選,尤其是在高級餐廳。藍鰭鮪魚等高脂肪品種佔據了頂級壽司菜單的主導地位,而對永續和符合道德標準的採購產品日益成長的需求,正推動生產商轉向經過認證的、具有環保意識的採購方式。
在採購方式方面,野生捕撈海鮮佔據市場主導地位,佔60.8%,這得益於消費者對優質口味和更高營養價值的認知。然而,隨著全球監管趨嚴和自然資源面臨壓力,人工養殖逐漸興起,以滿足持續的品質和供應需求。水產養殖系統日益先進,能夠提供符合安全標準、可追溯性和永續性目標的高品質鮪魚、鮭魚和蝦子。
Tassal Group、Grupo Nueva Pescanova、Cermaq、Proximar Seafood 和 Bakkafrost 等產業領導者正在採取策略性舉措,鞏固自身地位。這些公司正大力投資永續水產養殖技術,拓展數位銷售平台,並開發環保、可追溯的供應鏈。許多公司也正在尋求產品認證,並與高階零售和酒店品牌建立策略合作夥伴關係,以擴大市場佔有率並觸及新的消費群體。
目錄
第1章:方法論與範圍
第2章:執行摘要
第3章:行業洞察
- 產業生態系統分析
- 影響價值鏈的因素
- 利潤率分析
- 中斷
- 未來展望
- 製造商
- 經銷商
- 川普政府關稅
- 對貿易的影響
- 貿易量中斷
- 報復措施
- 對產業的影響
- 供應方影響(原料)
- 主要材料價格波動
- 供應鏈重組
- 生產成本影響
- 需求面影響(售價)
- 價格傳導至終端市場
- 市佔率動態
- 消費者反應模式
- 供應方影響(原料)
- 受影響的主要公司
- 策略產業反應
- 供應鏈重組
- 定價和產品策略
- 政策參與
- 展望與未來考慮
- 對貿易的影響
- 貿易統計(HS編碼)
- 2021-2024年主要出口國
- 2021-2024年主要進口國
註:以上貿易統計僅針對重點國家。
- 供應商格局
- 利潤率分析
- 重要新聞和舉措
- 監管格局
- 衝擊力
- 成長動力
- 全球對壽司的熱愛刺激了對優質海鮮的需求。
- 壽司級海鮮符合健康和低脂飲食。
- 電子商務和 DIY 套件讓每個人都能享用壽司。
- 產業陷阱與挑戰
- 嚴格的品質控制增加了操作的複雜性。
- 環境限制和採購問題對供應鏈帶來壓力。
- 成長動力
- 成長潛力分析
- 波特的分析
- PESTEL分析
第4章:競爭格局
- 介紹
- 公司市佔率分析
- 競爭定位矩陣
- 戰略展望矩陣
第5章:市場規模及預測:依類型,2021 年至 2034 年
- 主要趨勢
- 鮪魚
- 鮭魚
- 蝦
- 其他(章魚、魷魚等)
第6章:市場規模及預測:依採購,2021 年至 2034 年
- 主要趨勢
- 野生捕獲
- 養殖
- 其他
第7章:市場規模及預測:依配銷通路,2021 年至 2034 年
- 主要趨勢
- 餐飲服務
- 零售
- 直銷
第8章:市場估計與預測:按地區,2021 年至 2034 年
- 主要趨勢
- 北美洲
- 美國
- 加拿大
- 歐洲
- 德國
- 英國
- 法國
- 西班牙
- 義大利
- 荷蘭
- 亞太地區
- 中國
- 印度
- 日本
- 澳洲
- 韓國
- 拉丁美洲
- 巴西
- 墨西哥
- 阿根廷
- 中東和非洲
- 沙烏地阿拉伯
- 南非
- 阿拉伯聯合大公國
第9章:公司簡介
- Bakkafrost
- Blue Ocean Mariculture
- Cermaq
- Faroe Islands Salmon Producers
- Grupo Nueva Pescanova
- Ming Hong International
- Mt. Cook Alpine Salmon
- Proximar Seafood
- Seatopia
- Tassal Group
The Global Sushi Grade Seafood Market was valued at USD 10.1 billion in 2024 and is projected to grow at a CAGR of 5% to reach USD 16.2 billion by 2034. This impressive growth trajectory reflects the rising global appetite for premium, high-quality seafood, particularly as sushi continues to gain popularity across diverse demographics and regions. The growing interest in Japanese cuisine, combined with increasing health consciousness and a desire for upscale dining experiences, is driving a significant surge in demand for sushi-grade seafood. These products are not just a culinary trend-they are a lifestyle choice for health-focused consumers seeking nutritious, clean-label proteins. Sushi-grade seafood is held to strict quality, safety, and freshness standards, making it suitable for raw consumption without compromising health. Strict cold chain logistics and temperature controls eliminate risks from parasites and pathogens, ensuring the seafood remains safe and fresh from sea to table.
The global market is experiencing a shift in both consumption habits and purchasing channels. As consumers become more knowledgeable about sushi and raw seafood preparation, many are turning to home preparation with confidence. Retailers and online seafood platforms are capitalizing on this trend, offering curated selections of sushi-grade fish that meet professional standards. From fine dining to home kitchens, sushi-grade seafood is now a staple in the modern consumer's diet, especially among those seeking high-protein, low-fat, and nutrient-rich food options. Social media and digital food culture have further fueled the demand, with sushi appearing prominently in food blogs, influencer content, and healthy lifestyle trends. The accessibility of home meal kits and subscription-based seafood delivery services has also expanded the market, allowing consumers to enjoy restaurant-quality sushi from the comfort of home.
| Market Scope | |
|---|---|
| Start Year | 2024 |
| Forecast Year | 2025-2034 |
| Start Value | $10.1 Billion |
| Forecast Value | $16.2 Billion |
| CAGR | 5% |
In the United States, sushi-grade seafood remains a standout category, generating USD 2.1 billion in 2024 with a steady 5% CAGR projected through 2034. The US market benefits from a strong dining-out culture, but retail sales are gaining momentum as consumers become more comfortable preparing sushi at home. Coastal cities continue to lead in consumption, but sushi's popularity is expanding into inland regions thanks to better logistics and nationwide distribution networks. Online seafood retailers and specialty grocers are key players in this evolution, offering fresh, high-quality seafood with full traceability and certification, appealing to environmentally and health-conscious buyers.
Asia maintains its dominance as a production powerhouse and major consumer market, led by countries with rich culinary traditions. However, Europe is quickly catching up, with an increasing number of sushi restaurants and high-end supermarkets introducing sushi-grade offerings to a broader consumer base. Countries like the UK, Germany, and France are seeing double-digit growth in this segment, driven by rising incomes and changing food preferences.
By product type, the market is segmented into tuna, shrimp, salmon, and others. Tuna holds the largest market share at 42.1% in 2024. Known for its velvety texture, rich flavor, and premium positioning, tuna remains the preferred choice for sushi lovers, especially in fine dining establishments. High-fat varieties like bluefin tuna dominate top-tier sushi menus, while the growing demand for sustainable and ethically sourced options is pushing producers toward certified, eco-conscious sourcing practices.
When it comes to sourcing methods, wild-caught seafood leads the market with a 60.8% share, driven by consumer perceptions of superior taste and higher nutritional value. However, as global regulations tighten and natural resources face strain, farm-raised options are stepping in to meet consistent quality and supply demands. Aquaculture systems are becoming more advanced, offering high-quality tuna, salmon, and shrimp that align with safety standards, traceability, and sustainability goals.
Industry leaders such as Tassal Group, Grupo Nueva Pescanova, Cermaq, Proximar Seafood, and Bakkafrost are taking strategic steps to solidify their positions. These companies are heavily investing in sustainable aquaculture technologies, expanding digital sales platforms, and developing eco-friendly, traceable supply chains. Many are also pursuing product certifications and forming strategic partnerships with premium retail and hospitality brands to broaden their market presence and reach new consumer segments.
Table of Contents
Chapter 1 Methodology & Scope
- 1.1 Market scope & definition
- 1.2 Base estimates & calculations
- 1.3 Forecast calculation
- 1.4 Data sources
- 1.4.1 Primary
- 1.4.2 Secondary
- 1.4.2.1 Paid sources
- 1.4.2.2 Public sources
- 1.5 Primary research and validation
- 1.5.1 Primary sources
- 1.5.2 Data mining sources
Chapter 2 Executive Summary
- 2.1 Industry synopsis, 2021-2034
Chapter 3 Industry Insights
- 3.1 Industry ecosystem analysis
- 3.1.1 Factor affecting the value chain
- 3.1.2 Profit margin analysis
- 3.1.3 Disruptions
- 3.1.4 Future outlook
- 3.1.5 Manufacturers
- 3.1.6 Distributors
- 3.2 Trump administration tariffs
- 3.2.1 Impact on trade
- 3.2.1.1 Trade volume disruptions
- 3.2.1.2 Retaliatory measures
- 3.2.2 Impact on the industry
- 3.2.2.1 Supply-side impact (raw materials)
- 3.2.2.1.1 Price volatility in key materials
- 3.2.2.1.2 Supply chain restructuring
- 3.2.2.1.3 Production cost implications
- 3.2.2.2 Demand-side impact (selling price)
- 3.2.2.2.1 Price transmission to end markets
- 3.2.2.2.2 Market share dynamics
- 3.2.2.2.3 Consumer response patterns
- 3.2.2.1 Supply-side impact (raw materials)
- 3.2.3 Key companies impacted
- 3.2.4 Strategic industry responses
- 3.2.4.1 Supply chain reconfiguration
- 3.2.4.2 Pricing and product strategies
- 3.2.4.3 Policy engagement
- 3.2.5 Outlook and future considerations
- 3.2.1 Impact on trade
- 3.3 Trade statistics (HS Code)
- 3.3.1 Major exporting countries, 2021-2024 (Kilo Tons)
- 3.3.2 Major importing countries, 2021-2024 (Kilo Tons)
Note: the above trade statistics will be provided for key countries only.
- 3.4 Supplier landscape
- 3.5 Profit margin analysis
- 3.6 Key news & initiatives
- 3.7 Regulatory landscape
- 3.8 Impact forces
- 3.8.1 Growth drivers
- 3.8.1.1 Global appetite for sushi fuels demand for premium seafood.
- 3.8.1.2 Sushi grade seafood aligns with wellness and low-fat diets.
- 3.8.1.3 E-commerce and DIY kits make sushi accessible to all.
- 3.8.2 Industry pitfalls & challenges
- 3.8.2.1 Stringent quality controls drive up operational complexity.
- 3.8.2.2 Environmental limits and sourcing issues strain supply chains.
- 3.8.1 Growth drivers
- 3.9 Growth potential analysis
- 3.10 Porter's analysis
- 3.11 PESTEL analysis
Chapter 4 Competitive Landscape, 2024
- 4.1 Introduction
- 4.2 Company market share analysis
- 4.3 Competitive positioning matrix
- 4.4 Strategic outlook matrix
Chapter 5 Market Size and Forecast, By Type, 2021 – 2034 (USD Billion, Kilo Tons)
- 5.1 Key trends
- 5.2 Tuna
- 5.3 Salmon
- 5.4 Shrimp
- 5.5 Others (octopus, squid, etc.)
Chapter 6 Market Size and Forecast, By Sourcing, 2021 – 2034 (USD Billion, Kilo Tons)
- 6.1 Key trends
- 6.2 Wild caught
- 6.3 Farmed
- 6.4 Others
Chapter 7 Market Size and Forecast, By Distribution Channel, 2021 – 2034 (USD Billion, Kilo Tons)
- 7.1 Key trends
- 7.2 Foodservice
- 7.3 Retail
- 7.4 Direct sales
Chapter 8 Market Estimates and Forecast, By Region, 2021 – 2034 (USD Billion) (Kilo Tons)
- 8.1 Key trends
- 8.2 North America
- 8.2.1 U.S.
- 8.2.2 Canada
- 8.3 Europe
- 8.3.1 Germany
- 8.3.2 UK
- 8.3.3 France
- 8.3.4 Spain
- 8.3.5 Italy
- 8.3.6 Netherlands
- 8.4 Asia Pacific
- 8.4.1 China
- 8.4.2 India
- 8.4.3 Japan
- 8.4.4 Australia
- 8.4.5 South Korea
- 8.5 Latin America
- 8.5.1 Brazil
- 8.5.2 Mexico
- 8.5.3 Argentina
- 8.6 Middle East and Africa
- 8.6.1 Saudi Arabia
- 8.6.2 South Africa
- 8.6.3 UAE
Chapter 9 Company Profiles
- 9.1 Bakkafrost
- 9.2 Blue Ocean Mariculture
- 9.3 Cermaq
- 9.4 Faroe Islands Salmon Producers
- 9.5 Grupo Nueva Pescanova
- 9.6 Ming Hong International
- 9.7 Mt. Cook Alpine Salmon
- 9.8 Proximar Seafood
- 9.9 Seatopia
- 9.10 Tassal Group