


 |
市場調查報告書
商品編碼
1740778
太陽能光電製造設備市場機會、成長動力、產業趨勢分析及2025-2034年預測Solar PV Manufacturing Equipment Market Opportunity, Growth Drivers, Industry Trend Analysis, and Forecast 2025 - 2034 |
||||||
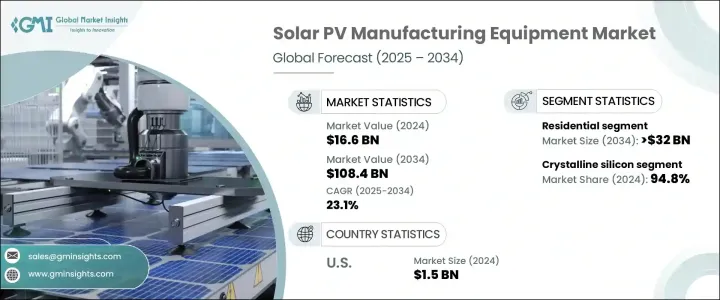
2024年,全球太陽能光電製造設備市場規模達1,66億美元,預計2034年將以23.1%的複合年成長率成長,達到1,084億美元。推動這一成長的因素包括:對能源獨立的日益關注,以及對可靠且具有韌性的太陽能組件國產化需求的日益成長。地緣政治不確定性的加劇,加劇了各國實現製造業務本地化的迫切性,尤其是在晶圓、電池和組件等關鍵上游組件方面。這種向國內生產的轉變正在增強工業活力,並鼓勵對太陽能光電基礎設施和設備的大規模投資。
先進電池技術的日益普及正在進一步重塑太陽能光電製造設備市場的格局。製造商正大力投資最先進的生產線,以應對高效能電池類型和組件設計的創新。這些改進不僅提高了能源產量,也有助於最佳化生產成本。設備開發商擴大將自動化、人工智慧工具和機器學習整合到他們的系統中,從而顯著提高了製造精度和可擴展性。這一趨勢降低了新企業的進入門檻,並為現有企業提供了拓展業務的機會。
| 市場範圍 | |
|---|---|
| 起始年份 | 2024 |
| 預測年份 | 2025-2034 |
| 起始值 | 166億美元 |
| 預測值 | 1084億美元 |
| 複合年成長率 | 23.1% |
隨著各國加強實現脫碳目標並因應電力消耗成長,多個產業對太陽能設備的需求日益成長。工業規模的機械製造比以往任何時候都更加重要,以滿足住宅、商業和公用事業領域日益成長的太陽能部署需求。上游環節,包括多晶矽、矽錠、矽晶圓、太陽能電池和成品組件的生產,持續面臨巨大的需求,推動了設備市場的擴張。
貿易政策也顯著影響市場動態。對外國太陽能光電產品的貿易限制正促使全球製造商實現供應鏈多元化,並將產能遷移至其他製造業友善的地區。雖然這種轉變有助於新興工業中心的發展,並減少對傳統供應來源的依賴,但預計在轉型期間會導致設備價格短期上漲,並影響專案進度。
根據應用領域,市場可分為住宅、商業和公用事業領域。預計到2034年,住宅領域的市場規模將超過320億美元,這得益於能源成本上漲、屋主對永續發展意識的提升以及有利的監管激勵措施。諸如智慧功能和電池儲能系統整合等技術進步,使住宅太陽能裝置更具吸引力。消費者也尋求更大的能源自主權,他們對電網中斷期間備用解決方案的興趣日益濃厚,這也推動了該行業的蓬勃發展。
從技術面來看,太陽能光電製造設備市場分為薄膜矽和晶體矽兩類。晶體矽技術目前佔據市場主導地位,截至2024年,其市佔率高達94.8%。其主導地位歸功於其更高的能量轉換率、豐富的材料供應以及持續的技術改進。在眾多應用中,單晶矽仍然是首選,因為它能夠在有限的空間中提供更高的輸出功率,使其成為住宅屋頂以及高密度商業或公用事業設施的理想選擇。
從區域來看,北美市場成長顯著,2024年北美市場佔全球市場佔有率的9.6%以上,預計到2034年這一數字還將上升。光是美國一國,2022年的市場價值就達到10億美元,2023年將增加至12億美元,2024年將增加至15億美元。扶持性政策措施在推動這一成長方面發揮著至關重要的作用。旨在支持國內製造業的綜合立法方案,包括稅收抵免和生產激勵措施,正在降低資本成本,並吸引太陽能供應鏈上的新投資。
隨著全球供應鏈脆弱性不斷顯現,國內製造業生態系統正受到優先重視,導致垂直整合營運的投資激增。企業擴大將整個生產流程(從原料到最終產品組裝)納入內部,以確保更好地控制成本、品質和交付週期。與區域企業的策略合作夥伴關係也日益頻繁,這為企業提供了獲得本地專業知識的機會,並有助於更快地滲透市場。這些合作正在促進技術轉讓,並加速下一代太陽能技術的商業化。
目錄
第1章:方法論與範圍
第2章:執行摘要
第3章:行業洞察
- 產業生態系統
- 川普政府關稅分析
- 對貿易的影響
- 貿易量中斷
- 報復措施
- 對產業的影響
- 供給側影響(原料)
- 主要材料價格波動
- 供應鏈重組
- 生產成本影響
- 需求面影響(售價)
- 價格傳導至終端市場
- 市佔率動態
- 消費者反應模式
- 供給側影響(原料)
- 受影響的主要公司
- 策略產業反應
- 供應鏈重組
- 定價和產品策略
- 政策參與
- 展望與未來考慮
- 對貿易的影響
- 監管格局
- 產業衝擊力
- 成長動力
- 產業陷阱與挑戰
- 成長潛力分析
- 波特的分析
- PESTEL分析
第4章:競爭格局
- 介紹
- 公司市佔率
- 戰略儀表板
- 公司標竿分析
- 創新與技術格局
第5章:市場規模及預測:依製造設備,2021 年至 2034 年
- 主要趨勢
- 矽設備
- 鑄錠設備
- 晶圓設備
- 細胞設備
- 模組設備
第6章:市場規模及預測:依技術分類,2021 年至 2034 年
- 主要趨勢
- 晶體矽
- 薄膜
第7章:市場規模及預測:依應用,2021 年至 2034 年
- 主要趨勢
- 住宅
- 商業的
- 公用事業
第8章:市場規模及預測:按地區,2021 年至 2034 年
- 主要趨勢
- 北美洲
- 美國
- 加拿大
- 歐洲
- 德國
- 英國
- 法國
- 西班牙
- 義大利
- 亞太地區
- 中國
- 印度
- 日本
- 澳洲
- 韓國
- 中東和非洲
- 沙烏地阿拉伯
- 阿拉伯聯合大公國
- 卡達
- 南非
- 拉丁美洲
- 巴西
- 阿根廷
- 智利
- 墨西哥
第9章:公司簡介
- Adani Solar
- Emmvee
- First Solar
- Goldi Solar
- Grew Solar
- JA Solar
- LDK Solar
- Premier Energies
- RenewSys
- Servotech Renewable Power System
- Tata Power Solar
- Tongwei Solar
- Trina Solar
- Vikram Solar
- Waaree Energies
The Global Solar PV Manufacturing Equipment Market was valued at USD 16.6 billion in 2024 and is estimated to grow at a CAGR of 23.1% to reach USD 108.4 billion by 2034. This expansion is driven by the increasing focus on energy independence and the growing need for reliable and resilient domestic production of solar components. Rising geopolitical uncertainties have intensified the urgency for countries to localize manufacturing operations, especially for critical upstream components such as wafers, cells, and modules. This shift toward domestic production is enhancing industrial activity and encouraging major investments in solar PV infrastructure and equipment.
Growing adoption of advanced cell technologies is further reshaping the landscape of the solar PV manufacturing equipment market. Manufacturers are heavily investing in state-of-the-art production lines capable of handling innovations in high-efficiency cell types and module designs. These enhancements not only improve energy yields but also help optimize production costs. Equipment developers are increasingly integrating automation, AI tools, and machine learning into their systems, which is significantly improving manufacturing precision and scalability. This trend is lowering entry barriers for new players and providing opportunities for existing companies to expand operations.
| Market Scope | |
|---|---|
| Start Year | 2024 |
| Forecast Year | 2025-2034 |
| Start Value | $16.6 Billion |
| Forecast Value | $108.4 Billion |
| CAGR | 23.1% |
As countries ramp up efforts to meet decarbonization goals and tackle rising electricity consumption, demand for solar equipment is intensifying across multiple sectors. Industrial-scale machinery fabrication is becoming more vital than ever to meet the rising need for solar deployment across residential, commercial, and utility applications. The upstream segment, which includes the production of polysilicon, ingots, wafers, solar cells, and finished modules, continues to experience substantial demand, fueling the expansion of the equipment market.
Trade policies are also shaping the market dynamics significantly. Trade restrictions on foreign solar PV products are prompting global manufacturers to diversify their supply chains and relocate production capacities to alternative manufacturing-friendly regions. While this shift supports the development of emerging industrial hubs and reduces dependency on traditional supply sources, it is expected to cause a short-term increase in equipment prices and affect project timelines during the transition.
By application, the market is categorized into residential, commercial, and utility segments. The residential segment is expected to surpass USD 32 billion by 2034, bolstered by rising energy costs, increased homeowner awareness of sustainability, and favorable regulatory incentives. Technological advancements, such as the integration of smart features and battery storage in home systems, are making residential solar installations more appealing. Consumers are also seeking greater energy autonomy, and their growing interest in backup solutions during grid outages is contributing to the sector's momentum.
In terms of technology, the solar PV manufacturing equipment market is segmented into thin film and crystalline silicon categories. Crystalline silicon technology currently dominates the market with a 94.8% share as of 2024. Its dominance is attributed to its higher energy conversion rates, abundant material availability, and ongoing technological enhancements. Among the various applications, monocrystalline silicon remains the preferred choice due to its ability to deliver greater output in limited space, making it ideal for both residential rooftops and high-density commercial or utility installations.
Regionally, the market is witnessing notable growth in North America, which accounted for over 9.6% of the global market share in 2024-a figure expected to increase by 2034. The United States alone recorded a market value of USD 1 billion in 2022, rising to USD 1.2 billion in 2023 and USD 1.5 billion in 2024. Supportive policy measures are playing a crucial role in driving this growth. Comprehensive legislative packages aimed at bolstering domestic manufacturing, including tax credits and production incentives, are reducing capital costs and attracting new investments across the solar supply chain.
As global supply chain vulnerabilities continue to surface, domestic manufacturing ecosystems are being prioritized, leading to a surge in investment in vertically integrated operations. Companies are increasingly bringing in-house the entire production process-from raw materials to final product assembly-to ensure better control over costs, quality, and lead times. Strategic partnerships with regional firms are also becoming more frequent, providing access to local expertise and facilitating faster market penetration. These collaborations are fostering technology transfer and speeding up the commercialization of next-generation solar technologies.
Table of Contents
Chapter 1 Methodology & Scope
- 1.1 Research design
- 1.2 Base estimates & calculations
- 1.3 Forecast model
- 1.4 Primary research & validation
- 1.4.1 Primary sources
- 1.4.2 Data mining sources
- 1.5 Market definitions
Chapter 2 Executive Summary
- 2.1 Industry synopsis, 2021 – 2034
Chapter 3 Industry Insights
- 3.1 Industry ecosystem
- 3.2 Trump administration tariff analysis
- 3.2.1 Impact on trade
- 3.2.1.1 Trade volume disruptions
- 3.2.1.2 Retaliatory measures
- 3.2.2 Impact on the industry
- 3.2.2.1 Supply-side impact (raw materials)
- 3.2.2.1.1 Price volatility in key materials
- 3.2.2.1.2 Supply chain restructuring
- 3.2.2.1.3 Production cost implications
- 3.2.2.2 Demand-side impact (selling price)
- 3.2.2.2.1 Price transmission to end markets
- 3.2.2.2.2 Market share dynamics
- 3.2.2.2.3 Consumer response patterns
- 3.2.2.1 Supply-side impact (raw materials)
- 3.2.3 Key companies impacted
- 3.2.4 Strategic industry responses
- 3.2.4.1 Supply chain reconfiguration
- 3.2.4.2 Pricing and product strategies
- 3.2.4.3 Policy engagement
- 3.2.5 Outlook and future considerations
- 3.2.1 Impact on trade
- 3.3 Regulatory landscape
- 3.4 Industry impact forces
- 3.4.1 Growth drivers
- 3.4.2 Industry pitfalls & challenges
- 3.5 Growth potential analysis
- 3.6 Porter's analysis
- 3.6.1 Bargaining power of suppliers
- 3.6.2 Bargaining power of buyers
- 3.6.3 Threat of new entrants
- 3.6.4 Threat of substitutes
- 3.7 PESTEL analysis
Chapter 4 Competitive landscape, 2024
- 4.1 Introduction
- 4.2 Company market share
- 4.3 Strategic dashboard
- 4.4 Company benchmarking
- 4.5 Innovation & technology landscape
Chapter 5 Market Size and Forecast, By Manufacturing Equipment, 2021 – 2034 (USD Billion)
- 5.1 Key trends
- 5.2 Silicon equipment
- 5.3 Ingots equipment
- 5.4 Wafer equipment
- 5.5 Cells equipment
- 5.6 Module equipment
Chapter 6 Market Size and Forecast, By Technology, 2021 – 2034 (USD Billion)
- 6.1 Key trends
- 6.2 Crystalline silicon
- 6.3 Thin film
Chapter 7 Market Size and Forecast, By Application, 2021 – 2034 (USD Billion)
- 7.1 Key trends
- 7.2 Residential
- 7.3 Commercial
- 7.4 Utility
Chapter 8 Market Size and Forecast, By Region, 2021 – 2034 (USD Billion)
- 8.1 Key trends
- 8.2 North America
- 8.2.1 U.S.
- 8.2.2 Canada
- 8.3 Europe
- 8.3.1 Germany
- 8.3.2 UK
- 8.3.3 France
- 8.3.4 Spain
- 8.3.5 Italy
- 8.4 Asia Pacific
- 8.4.1 China
- 8.4.2 India
- 8.4.3 Japan
- 8.4.4 Australia
- 8.4.5 South Korea
- 8.5 Middle East & Africa
- 8.5.1 Saudi Arabia
- 8.5.2 UAE
- 8.5.3 Qatar
- 8.5.4 South Africa
- 8.6 Latin America
- 8.6.1 Brazil
- 8.6.2 Argentina
- 8.6.3 Chile
- 8.6.4 Mexico
Chapter 9 Company Profiles
- 9.1 Adani Solar
- 9.2 Emmvee
- 9.3 First Solar
- 9.4 Goldi Solar
- 9.5 Grew Solar
- 9.6 JA Solar
- 9.7 LDK Solar
- 9.8 Premier Energies
- 9.9 RenewSys
- 9.10 Servotech Renewable Power System
- 9.11 Tata Power Solar
- 9.12 Tongwei Solar
- 9.13 Trina Solar
- 9.14 Vikram Solar
- 9.15 Waaree Energies
 太陽能設備的全球市場(2025年):產品,終端用戶競爭:分析,預測,機會
 中國公用事業規模太陽能發電市場展望(2025 年)
 2025年巴爾幹半島太陽能市場展望
 全球太陽能供應鏈季度簡報:2025年第三季度
 太陽能光電模組:全球市場佔有率和排名、總銷售量和需求預測(2025-2031 年)
 太陽能光電模組市場機會、成長促進因素、產業趨勢分析及預測(2025-2034年)
 中東歐的太陽能光伏發電市場,2025年
 光電平衡系統市場按類型、組件類型、系統配置和最終用戶分類-全球預測,2025-2032年太陽能微生物生產市場:按應用、微生物類型和技術分類-2025年至2032年全球預測太陽能系統市場(按產品類型、系統規模、安裝類型和最終用途應用)—2025-2032 年全球預測