

 |
市場調查報告書
商品編碼
1721528
電容器組市場機會、成長動力、產業趨勢分析及 2025 - 2034 年預測Capacitor Bank Market Opportunity, Growth Drivers, Industry Trend Analysis, and Forecast 2025 - 2034 |
||||||
2024 年全球電容器組市場價值為 31 億美元,預計到 2034 年將以 4% 的複合年成長率成長,達到 46 億美元。這一成長源於已開發和發展中能源密集型經濟體繼續優先考慮能源效率和電網可靠性。隨著全球電力需求以前所未有的速度成長,各行各業和政府都開始將電容器組視為穩定電壓等級、提高功率因數和減少能量損失的重要組成部分。電力基礎設施的現代化,特別是在快速城市化地區的電力基礎設施的現代化,為這些系統的部署創造了繁榮的前景。市場參與者正在透過推出符合下一代電網要求的緊湊、智慧和數位化電容器組來滿足這一需求。風能和太陽能等再生能源擴大融入電網,也增加了對無功功率支援的需求,使得電容器組成為實現能源轉型目標的關鍵推動因素。為了實現永續發展目標,政策制定者正在推動以最高效率運作的低損耗電力系統。這些趨勢得到了全球範圍內專注於長期電網升級和彈性增強專案的公私合作夥伴關係的進一步支持。
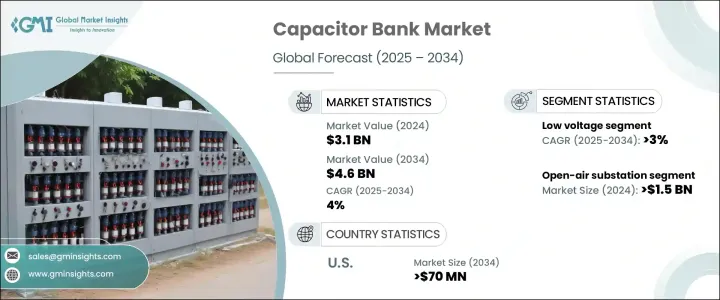
以電壓計算,到 2034 年,低壓部分將以 3% 的複合年成長率穩定成長。這一成長是由基礎設施有限的低度開發地區不斷成長的能源需求和已開發經濟體不斷的網路改進所推動的。隨著住宅、商業和輕工業用戶尋求更好的電力品質和系統穩定性,低壓電容器組越來越受到關注。它們設計緊湊、易於整合且成本高效,非常適合基礎設施快速擴張的地區。這些裝置提供了適應不斷變化的負載需求所需的靈活性,同時確保了節能和設備壽命。
| 市場範圍 | |
|---|---|
| 起始年份 | 2024 |
| 預測年份 | 2025-2034 |
| 起始值 | 31億美元 |
| 預測值 | 46億美元 |
| 複合年成長率 | 4% |
從配置方面來看,露天變電站部分在2024年創造了15億美元的收入。該部分的成長得益於對大型輸電項目和智慧電網技術的持續投資。公用事業公司更喜歡這些系統,因為它們能夠穩定整個擴展配電網路的電壓,特別是在高負載情況下。製造業、再生能源和電信等產業越來越依賴這些配置來確保不間斷的電力傳輸和可擴展的基礎設施解決方案。
2024 年美國電容器組市場規模為 5.578 億美元,預計到 2034 年將達到 7 億美元。電動車的日益普及和資料中心的大規模擴張正在推動對增強無功補償的需求。憑藉先進的電網結構和對低排放系統的強力監管推動,美國在高性能電容器組的部署方面繼續保持領先地位。
全球電容器組市場的主要參與者包括 ZEZ SILKO、CIRCUTOR、SHARDA Electronics、LAXMI ELECTRONICS、ABB、施耐德電機、通用電氣、西門子、LIFASA、日立能源、ARTECHE、Powerside、Aener Energia、Eaton 和 Enerlux Power。公司正大力投資研發,以推出智慧、高效、具有遠端監控功能的電容器組。與公用事業和政府實體的策略合作夥伴關係正在幫助這些公司提供針對特定區域的解決方案,並透過有針對性的收購挖掘新的市場機會。
目錄
第1章:方法論與範圍
第2章:執行摘要
第3章:行業洞察
- 產業生態系統分析
- 監管格局
- 產業衝擊力
- 成長動力
- 產業陷阱與挑戰
- 成長潛力分析
- 波特的分析
- 供應商的議價能力
- 買家的議價能力
- 新進入者的威脅
- 替代品的威脅
- PESTEL分析
第4章:競爭格局
- 介紹
- 戰略展望
- 創新與永續發展格局
第5章:市場規模及預測:按電壓,2021 - 2034
- 主要趨勢
- 低 [<10 kV]
- 中[10千伏-69千伏]
- 高[>69千伏]
第6章:市場規模及預測:依類型,2021 - 2034
- 主要趨勢
- 露天變電站
- 金屬封閉變電站
- 桿式安裝
- 其他
第7章:市場規模及預測:依應用,2021 - 2034
- 主要趨勢
- 功率因數校正
- 諧波濾波器
- 電壓調節
- 再生能源整合
- 工業應用
- 資料中心
- 其他
第8章:市場規模及預測:按地區,2021 - 2034
- 主要趨勢
- 北美洲
- 美國
- 加拿大
- 墨西哥
- 歐洲
- 德國
- 法國
- 西班牙
- 義大利
- 英國
- 荷蘭
- 俄羅斯
- 瑞典
- 亞太地區
- 中國
- 印度
- 日本
- 韓國
- 印尼
- 紐西蘭
- 馬來西亞
- 泰國
- 新加坡
- 澳洲
- 中東和非洲
- 沙烏地阿拉伯
- 阿拉伯聯合大公國
- 卡達
- 阿曼
- 南非
- 拉丁美洲
- 巴西
- 智利
- 阿根廷
第9章:公司簡介
- ABB
- Aener Energia
- ARTECHE
- LAXMI ELECTRONICS
- CIRCUTOR
- Eaton
- Enerlux Power
- General Electric
- Hitachi Energy
- SHARDA Electronics
- Powerside
- Schneider Electric
- LIFASA
- Siemens
- ZEZ SILKO
The Global Capacitor Bank Market was valued at USD 3.1 billion in 2024 and is estimated to grow at a CAGR of 4% to reach USD 4.6 billion by 2034. This growth comes as energy-intensive economies, both developed and developing, continue to prioritize energy efficiency and grid reliability. With the global demand for electricity rising at an unprecedented rate, industries and governments are turning to capacitor banks as essential components to stabilize voltage levels, improve power factor, and reduce energy losses. The modernization of power infrastructure, especially in fast-urbanizing regions, has created a thriving landscape for the deployment of these systems. Market players are responding to this demand by introducing compact, smart, and digitally enabled capacitor banks that align with next-gen grid requirements. The rising integration of renewable energy sources like wind and solar into the grid is also increasing the need for reactive power support, making capacitor banks a key enabler for energy transition goals. In line with sustainability objectives, policymakers are pushing for low-loss power systems that operate with maximum efficiency. These trends are further backed by public-private partnerships focused on long-term grid upgrades and resilience enhancement projects worldwide.
By voltage, the low voltage segment is set to grow steadily at a CAGR of 3% through 2034. This growth is being driven by mounting energy demands in underdeveloped regions with limited infrastructure and continuous network improvements across developed economies. As residential, commercial, and light industrial users seek better power quality and system stability, low-voltage capacitor banks are gaining traction. Their compact design, ease of integration, and cost efficiency make them ideal for areas undergoing rapid infrastructure expansion. These units offer the flexibility needed to accommodate shifting load demands while ensuring energy savings and equipment longevity.
| Market Scope | |
|---|---|
| Start Year | 2024 |
| Forecast Year | 2025-2034 |
| Start Value | $3.1 Billion |
| Forecast Value | $4.6 Billion |
| CAGR | 4% |
In terms of configuration, the open-air substation segment generated USD 1.5 billion in 2024. The segment's growth is supported by sustained investments in large-scale power transmission projects and smart grid technologies. Utilities prefer these systems due to their ability to stabilize voltage across extended distribution networks, particularly in high-load scenarios. Industries such as manufacturing, renewables, and telecommunications are increasingly relying on these configurations to ensure uninterrupted power delivery and scalable infrastructure solutions.
The United States Capacitor Bank Market generated USD 557.8 million in 2024 and is projected to reach USD 700 million by 2034. The growing adoption of electric vehicles and large-scale expansion of data centers are fueling the need for enhanced reactive power compensation. With an advanced grid structure and strong regulatory push for low-emission systems, the U.S. continues to lead in deploying high-performance capacitor banks.
Key players in the Global Capacitor Bank Market include ZEZ SILKO, CIRCUTOR, SHARDA Electronics, LAXMI ELECTRONICS, ABB, Schneider Electric, General Electric, Siemens, LIFASA, Hitachi Energy, ARTECHE, Powerside, Aener Energia, Eaton, and Enerlux Power. Companies are investing heavily in R&D to launch smart, efficient, and remote-monitoring enabled capacitor banks. Strategic partnerships with utilities and government entities are helping these firms offer region-specific solutions and tap into new market opportunities through targeted acquisitions.
Table of Contents
Chapter 1 Methodology & Scope
- 1.1 Research design
- 1.2 Market estimates & forecast parameters
- 1.3 Forecast calculation
- 1.4 Data sources
- 1.4.1 Primary
- 1.4.2 Secondary
- 1.4.2.1 Paid
- 1.4.2.2 Public
- 1.5 Market definitions
Chapter 2 Executive Summary
- 2.1 Industry synopsis, 2021 - 2034
Chapter 3 Industry Insights
- 3.1 Industry ecosystem analysis
- 3.2 Regulatory landscape
- 3.3 Industry impact forces
- 3.3.1 Growth drivers
- 3.3.2 Industry pitfalls & challenges
- 3.4 Growth potential analysis
- 3.5 Porter's analysis
- 3.5.1 Bargaining power of suppliers
- 3.5.2 Bargaining power of buyers
- 3.5.3 Threat of new entrants
- 3.5.4 Threat of substitutes
- 3.6 PESTEL analysis
Chapter 4 Competitive Landscape, 2025
- 4.1 Introduction
- 4.2 Strategic outlook
- 4.3 Innovation & sustainability landscape
Chapter 5 Market Size and Forecast, By Voltage, 2021 - 2034 (USD Million & '000 Units)
- 5.1 Key trends
- 5.2 Low [<10 kV]
- 5.3 Medium [10 kV - 69 kV]
- 5.4 High [>69 kV]
Chapter 6 Market Size and Forecast, By Type, 2021 - 2034 (USD Million & '000 Units)
- 6.1 Key trends
- 6.2 Open air substation
- 6.3 Metal enclosed substation
- 6.4 Pole mounted
- 6.5 Others
Chapter 7 Market Size and Forecast, By Application, 2021 - 2034 (USD Million & '000 Units)
- 7.1 Key trends
- 7.2 Power factor correction
- 7.3 Harmonic filter
- 7.4 Voltage regulation
- 7.5 Renewable integration
- 7.6 Industrial application
- 7.7 Data centers
- 7.8 Others
Chapter 8 Market Size and Forecast, By Region, 2021 - 2034 (USD Million & '000 Units)
- 8.1 Key trends
- 8.2 North America
- 8.2.1 U.S.
- 8.2.2 Canada
- 8.2.3 Mexico
- 8.3 Europe
- 8.3.1 Germany
- 8.3.2 France
- 8.3.3 Spain
- 8.3.4 Italy
- 8.3.5 UK
- 8.3.6 Netherlands
- 8.3.7 Russia
- 8.3.8 Sweden
- 8.4 Asia Pacific
- 8.4.1 China
- 8.4.2 India
- 8.4.3 Japan
- 8.4.4 South Korea
- 8.4.5 Indonesia
- 8.4.6 New Zealand
- 8.4.7 Malaysia
- 8.4.8 Thailand
- 8.4.9 Singapore
- 8.4.10 Australia
- 8.5 Middle East & Africa
- 8.5.1 Saudi Arabia
- 8.5.2 UAE
- 8.5.3 Qatar
- 8.5.4 Oman
- 8.5.5 South Africa
- 8.6 Latin America
- 8.6.1 Brazil
- 8.6.2 Chile
- 8.6.3 Argentina
Chapter 9 Company Profiles
- 9.1 ABB
- 9.2 Aener Energia
- 9.3 ARTECHE
- 9.4 LAXMI ELECTRONICS
- 9.5 CIRCUTOR
- 9.6 Eaton
- 9.7 Enerlux Power
- 9.8 General Electric
- 9.9 Hitachi Energy
- 9.10 SHARDA Electronics
- 9.11 Powerside
- 9.12 Schneider Electric
- 9.13 LIFASA
- 9.14 Siemens
- 9.15 ZEZ SILKO
 全球電容器組市場規模、佔有率、趨勢和成長分析報告(2026-2034年)
 全球電容器組市場報告(2026 年)
 電容器組市場 - 全球產業規模、佔有率、趨勢、機會及預測(按電壓、類型、安裝方式、應用、地區和競爭格局分類,2021-2031年)
 全球電容器組市場:市場規模、佔有率、趨勢分析(按電壓、應用和地區)、展望和預測(2025-2032 年)
 全球中壓電容器組市場中壓電容器組市場 - 全球產業規模、佔有率、趨勢、機會和預測,按階段、按類型、按應用、按冷卻方法、按地區、按競爭進行細分,2020-2030 年全球低壓電容器組市場全球電容器組市場
 低壓電容器組市場機會、成長動力、產業趨勢分析及 2025 - 2034 年預測
 2032 年電容器組市場預測:按類型、電壓、安裝、連接類型、應用、最終用戶和地區進行的全球分析