


 |
市場調查報告書
商品編碼
1716725
電動葫蘆市場機會、成長動力、產業趨勢分析及2025-2034年預測Electric Hoist Market Opportunity, Growth Drivers, Industry Trend Analysis, and Forecast 2025 - 2034 |
||||||
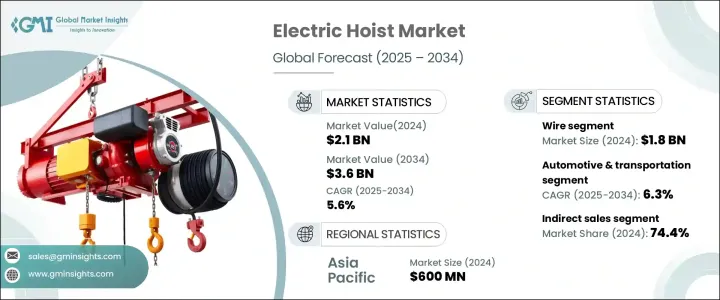
2024 年全球電動葫蘆市場價值為 21 億美元,預計 2025 年至 2034 年的複合年成長率為 5.6%。智慧和物聯網電動葫蘆的日益普及正在透過整合即時監控、預測性維護和自動化系統徹底改變物料搬運。這些先進的起重機配備了物聯網感測器、人工智慧工具和無線控制,使產業能夠遠端監控性能、最佳化工作流程並防止設備故障。與需要定期檢查和定期維護的傳統起重機不同,智慧起重機依靠即時資料來檢測磨損的早期跡象,從而最大限度地減少停機時間並降低營運成本。它們還透過降低過載、過熱和機械故障等風險來提高工作場所的安全性。感測器監測負載能力、振動和系統性能,當檢測到異常時停止操作,確保更高的效率和工人安全。
遠端監控和控制系統進一步加強了對智慧起重機的需求,使管理人員能夠從任何位置追蹤起吊裝置性能、負載狀況和能耗。這些系統對於在大型設施或遠端站點操作多台升降機的行業特別有益。智慧升降機收集的資料有助於提高效能、減少能源使用和自動執行關鍵任務,使其成為現代工業環境中不可或缺的一部分。
| 市場範圍 | |
|---|---|
| 起始年份 | 2024 |
| 預測年份 | 2025-2034 |
| 起始值 | 21億美元 |
| 預測值 | 36億美元 |
| 複合年成長率 | 5.6% |
電動起吊裝置市場按類型分為鍊式葫蘆和鋼索葫蘆。鋼絲繩葫蘆在 2024 年創造了 18 億美元的收入,預計在預測期內的複合年成長率為 5.6%。鋼絲繩葫蘆因其強度、耐用性和承受重載的能力而佔據市場主導地位,適用於汽車、建築、造船、航太和重型機械行業的應用。它們比鍊式起重機具有更高的速度和效率,可以快速移動材料並最大限度地減少生產停機時間。在需要極少維護和較長使用壽命的環境中,包括高溫、高塵和腐蝕性環境,鋼絲繩葫蘆是首選。它們能夠提供平穩、安靜的運行,從而提高工作場所的安全性和效率。
就終端使用產業而言,電動起吊裝置市場面向航太、汽車和運輸、建築、能源、海洋和航運、物流、物料搬運、石油和天然氣以及農業等領域。汽車和運輸領域在 2024 年佔據了超過 12% 的市場佔有率,預計到 2034 年將以 6.3% 的複合年成長率成長。電動葫蘆需求的不斷成長源於汽車製造、維護和物流領域對自動化、物料搬運和重型起重的需求日益成長。工業 4.0 技術正在推動整合物聯網的電動葫蘆的應用,這對於處理輕型電動車零件和先進製造工廠的裝配線自動化至關重要。
電動起吊裝置市場的通路分為直接銷售和間接銷售。 2024 年間接銷售佔據主導地位,佔 74.4% 的佔有率,這是因為製造商利用廣泛的分銷商、經銷商和第三方供應商網路來接觸更廣泛的客戶群,而無需建立昂貴的銷售系統。間接通路可協助製造商滲透到發展中市場,這些市場的當地經銷商擁有強大的客戶關係和區域專業知識。經銷商提供的融資和租賃選擇也使中小企業能夠使用電動葫蘆,以支持市場擴張。
2024 年,亞太地區引領全球電動起吊裝置市場,佔約 30.9% 的市場佔有率,創造約 6 億美元的收入。該地區的主導地位是由主要國家在製造業、基礎設施和建築業的大量投資所推動的,從而導致對物料搬運設備的需求增加。低成本勞動力和原料的供應使該地區成為電動起吊裝置生產和出口中心。該地區自動化程度的不斷提高和電子商務的興起進一步推動了對電動葫蘆的需求,鞏固了亞太地區在全球市場的領導地位。
目錄
第1章:方法論與範圍
第2章:執行摘要
第3章:行業洞察
- 產業生態系統分析
- 供應商概況
- 定價分析
- 技術與創新格局
- 重要新聞和舉措
- 監管格局
- 製造商
- 經銷商
- 零售商
- 對部隊的影響
- 成長動力
- 工業自動化日益興起
- 基礎建設不斷推進
- 注重安全性和人體工學
- 產業陷阱與挑戰
- 激烈的價格競爭
- 嚴格的安全規定
- 成長動力
- 成長潛力分析
- 消費者購買行為
- 波特的分析
- PESTEL分析
第4章:競爭格局
- 介紹
- 公司市佔率分析
- 競爭定位矩陣
- 戰略展望矩陣
第5章:市場估計與預測:按類型,2021 - 2034 年(十億美元)
- 主要趨勢
- 鏈
- 金屬絲
第6章:市場估計與預測:按產能(噸),2021-2034 年(十億美元)
- 主要趨勢
- 0.25-5.0
- 5.1-10
- 10.1-15
- 15.1-20
- 20.1-32
第7章:市場估計與預測:按最終用途產業,2021 - 2034 年(十億美元)
- 主要趨勢
- 航太
- 汽車與運輸
- 建造
- 能源
- 海運和航運
- 運輸與物流
- 物料處理
- 石油和天然氣
- 農業和林業
- 其他
第8章:市場估計與預測:按應用,2021 - 2034 年(十億美元)
- 主要趨勢
- 商業復甦
- 起重機
- 固定的
- 移動的
- 工作船
- 公用事業
- 其他
第9章:市場估計與預測:按配銷通路,2021 - 2034 年(十億美元)
- 主要趨勢
- 直接的
- 間接
第10章:市場估計與預測:按地區,2021 - 2034 年(十億美元)
- 主要趨勢
- 北美洲
- 美國
- 加拿大
- 歐洲
- 英國
- 德國
- 法國
- 義大利
- 西班牙
- 俄羅斯
- 亞太地區
- 中國
- 印度
- 日本
- 澳洲
- 韓國
- 拉丁美洲
- 巴西
- 墨西哥
- 阿根廷
- MEA
- 阿拉伯聯合大公國
- 南非
- 沙烏地阿拉伯
第 11 章:公司簡介
- ABUS Cranes
- Columbus McKinnon
- Crosby Group
- Demag Cranes and Components
- Hitachi Industrial Equipment Systems
- IMER International
- Ingersoll Rand
- JASO Industrial Cranes
- KITO
- Konecranes
- Kran Direkt
- Street Crane
- Tianjin Kunda Hoisting Equipment
- Verlinde
- Yale
The Global Electric Hoist Market was valued at USD 2.1 billion in 2024 and is projected to expand at a CAGR of 5.6% from 2025 to 2034. The increasing adoption of intelligent and IoT-enabled electric hoists is revolutionizing material handling by integrating real-time monitoring, predictive maintenance, and automated systems. These advanced hoists come equipped with IoT sensors, AI-powered tools, and wireless controls that allow industries to remotely monitor performance, optimize work processes, and prevent equipment failures. Unlike traditional hoists that require periodic inspections and scheduled maintenance, smart hoists rely on real-time data to detect early signs of wear, minimizing downtime and reducing operational costs. They also enhance workplace safety by mitigating risks such as overload, overheating, and machinery breakdowns. Sensors monitor load capacity, vibrations, and system performance to halt operations when anomalies are detected, ensuring higher efficiency and worker safety.
Remote monitoring and control systems further strengthen the demand for smart hoists by enabling managers to track hoist performance, load conditions, and energy consumption from any location. These systems are particularly beneficial for industries that operate multiple hoists across large facilities or remote sites. The data collected from smart hoists aids in improving performance, reducing energy usage, and automating critical tasks, making them indispensable in modern industrial settings.
| Market Scope | |
|---|---|
| Start Year | 2024 |
| Forecast Year | 2025-2034 |
| Start Value | $2.1 Billion |
| Forecast Value | $3.6 Billion |
| CAGR | 5.6% |
The electric hoist market is segmented by type into chain and wire hoists. Wire hoists generated USD 1.8 billion in revenue in 2024 and are expected to grow at a CAGR of 5.6% over the forecast period. Wire rope hoists dominate the market due to their strength, durability, and ability to handle heavy loads, making them suitable for applications in automotive, construction, shipbuilding, aerospace, and heavy machinery industries. They offer greater speed and efficiency than chain hoists, allowing materials to be moved quickly and minimizing production downtime. Wire rope hoists are preferred in environments that require minimal maintenance and longer operational life, including high-temperature, high-dust, and corrosive settings. Their ability to provide smooth, quiet operation enhances workplace safety and efficiency.
In terms of end-use industries, the electric hoist market caters to sectors such as aerospace, automotive and transportation, construction, energy, marine and shipping, logistics, material handling, oil and gas, and agriculture. The automotive and transportation segment accounted for over 12% of the market in 2024 and is projected to grow at a CAGR of 6.3% until 2034. The increasing demand for electric hoists stems from the growing need for automation, material handling, and heavy lifting in automotive manufacturing, maintenance, and logistics. Industry 4.0 technologies are driving the adoption of electric hoists with IoT integration, which is vital for handling lightweight EV components and automating assembly lines in advanced manufacturing facilities.
Distribution channels in the electric hoist market are categorized as direct and indirect sales. Indirect sales dominated in 2024, accounting for a 74.4% share, due to the extensive network of distributors, dealers, and third-party suppliers that manufacturers utilize to reach a broader customer base without building costly sales systems. Indirect channels help manufacturers penetrate developing markets where local distributors have strong customer relationships and regional expertise. Financing and leasing options provided by dealers also make electric hoists accessible to SME , supporting market expansion.
Asia Pacific led the global electric hoist market in 2024, holding around 30.9% of the market share and generating approximately USD 600 million in revenue. The region's dominance is driven by significant investments in manufacturing, infrastructure, and construction across key countries, leading to higher demand for material handling equipment. The availability of low-cost labor and raw materials contributes to the region's position as a hub for electric hoist production and export. The increasing adoption of automation and the rise of e-commerce in the region is further driving the need for electric hoists, solidifying Asia Pacific's leadership in the global market.
Table of Contents
Chapter 1 Methodology & Scope
- 1.1 Research design
- 1.1.1 Research approach
- 1.1.2 Data collection methods
- 1.2 Base estimates and calculations
- 1.2.1 Base year calculation
- 1.2.2 Key trends for market estimates
- 1.3 Forecast model
- 1.4 Primary research & validation
- 1.4.1 Primary sources
- 1.4.2 Data mining sources
- 1.5 Market definitions
Chapter 2 Executive Summary
- 2.1 Industry synopsis, 2021 - 2034
Chapter 3 Industry Insights
- 3.1 Industry ecosystem analysis
- 3.2 Supplier Landscape
- 3.3 Pricing analysis
- 3.4 Technology & innovation landscape
- 3.5 Key news & initiatives
- 3.6 Regulatory landscape
- 3.7 Manufacturers
- 3.8 Distributors
- 3.9 Retailers
- 3.10 Impact on forces
- 3.10.1 Growth drivers
- 3.10.1.1 Rising industrial automation
- 3.10.1.2 Growing infrastructure development
- 3.10.1.3 Focus on safety and ergonomics
- 3.10.2 Industry pitfalls & challenges
- 3.10.2.1 Intense price competition
- 3.10.2.2 Stringent safety regulations
- 3.10.1 Growth drivers
- 3.11 Growth potential analysis
- 3.12 Consumer buying behavior
- 3.13 Porter's analysis
- 3.14 PESTEL analysis
Chapter 4 Competitive Landscape, 2024
- 4.1 Introduction
- 4.2 Company market share analysis
- 4.3 Competitive positioning matrix
- 4.4 Strategic outlook matrix
Chapter 5 Market Estimates & Forecast, By Type, 2021 - 2034 ($Bn) (Thousand Units)
- 5.1 Key trends
- 5.2 Chain
- 5.3 Wire
Chapter 6 Market Estimates & Forecast, By Capacity (Tons), 2021 - 2034 ($Bn) (Thousand Units)
- 6.1 Key trends
- 6.2 0.25-5.0
- 6.3 5.1-10
- 6.4 10.1-15
- 6.5 15.1-20
- 6.6 20.1-32
Chapter 7 Market Estimates & Forecast, By End Use Industry, 2021 - 2034 ($Bn) (Thousand Units)
- 7.1 Key trends
- 7.2 Aerospace
- 7.3 Automotive & transportation
- 7.4 Construction
- 7.5 Energy
- 7.6 Marine & shipping
- 7.7 Transportation & logistics
- 7.8 Material handling
- 7.9 Oil & gas
- 7.10 Agricultural & forestry
- 7.11 Others
Chapter 8 Market Estimates & Forecast, By Application, 2021 - 2034 ($Bn) (Thousand Units)
- 8.1 Key trends
- 8.2 Commercial recovery
- 8.3 Cranes
- 8.3.1 Fixed
- 8.3.2 Mobile
- 8.4 Workboat
- 8.5 Utility
- 8.6 Others
Chapter 9 Market Estimates & Forecast, By Distribution Channel, 2021 - 2034 ($Bn) (Thousand Units)
- 9.1 Key trends
- 9.2 Direct
- 9.3 Indirect
Chapter 10 Market Estimates & Forecast, By Region, 2021 - 2034 ($Bn) (Thousand Units)
- 10.1 Key trends
- 10.2 North America
- 10.2.1 U.S.
- 10.2.2 Canada
- 10.3 Europe
- 10.3.1 UK
- 10.3.2 Germany
- 10.3.3 France
- 10.3.4 Italy
- 10.3.5 Spain
- 10.3.6 Russia
- 10.4 Asia Pacific
- 10.4.1 China
- 10.4.2 India
- 10.4.3 Japan
- 10.4.4 Australia
- 10.4.5 South Korea
- 10.5 Latin America
- 10.5.1 Brazil
- 10.5.2 Mexico
- 10.5.3 Argentina
- 10.6 MEA
- 10.6.1 UAE
- 10.6.2 South Africa
- 10.6.3 Saudi Arabia
Chapter 11 Company Profiles
- 11.1 ABUS Cranes
- 11.2 Columbus McKinnon
- 11.3 Crosby Group
- 11.4 Demag Cranes and Components
- 11.5 Hitachi Industrial Equipment Systems
- 11.6 IMER International
- 11.7 Ingersoll Rand
- 11.8 JASO Industrial Cranes
- 11.9 KITO
- 11.10 Konecranes
- 11.11 Kran Direkt
- 11.12 Street Crane
- 11.13 Tianjin Kunda Hoisting Equipment
- 11.14 Verlinde
- 11.15 Yale
 礦用提升鋼索市場:依材料、結構、芯線、塗層、直徑及潤滑方式分類的全球預測,2026-2032年
 2026年全球起吊裝置市場報告
 起重機和起吊裝置市場 - 全球產業規模、佔有率、趨勢、機會、預測:按類型、應用、地區和競爭格局分類,2021-2031年全球螺旋起吊裝置市場(按產品類型、起重能力、安裝類型、終端用戶產業和分銷管道分類)預測(2026-2032年)
 電動鋼繩起吊裝置市場-2026-2031年預測2025年全球人員與物料電梯市場報告
 礦山提升系統市場規模、佔有率和趨勢分析報告:按產品、應用、採礦類型、動力來源、地區和細分市場預測(2025-2033 年)起重機和起吊裝置市場:按安裝類型、起吊裝置類型、操作模式、起重機類型、起重機能力範圍和最終用戶分類-2025-2032年全球預測
 全球電動起吊裝置市場
 全球起重機和起吊裝置市場(按類型、營運、起重能力、產業和地區分類)-預測至2030年