


 |
市場調查報告書
商品編碼
1716667
氣體淨化器市場機會、成長動力、產業趨勢分析及 2025 - 2034 年預測Gas Purifiers Market Opportunity, Growth Drivers, Industry Trend Analysis, and Forecast 2025 - 2034 |
||||||
2024 年全球氣體淨化器市場估值達 20.1 億美元,預計 2025 年至 2034 年期間的複合年成長率為 5.8%。對先進氣體淨化解決方案的需求不斷成長,源於日益成長的環境問題以及針對空氣品質和減排的更嚴格的全球法規。隨著世界各地的監管機構實施更嚴格的標準來控制污染物和減少溫室氣體,各行各業擴大採用氣體淨化器來遵守這些不斷變化的法規。隨著企業專注於滿足監管基準和加強永續發展努力,對可靠的氣體淨化系統的需求正在迅速成長。這一趨勢得到了減少工業排放和確保各個製造過程中空氣更安全、更清潔的迫切要求的支持。此外,工業化程度的提高以及人們對環境保護意識的增強,也推動了對高效能氣體淨化器的需求。該公司正在優先考慮先進的淨化技術,以配合全球減少環境影響的努力,從而加速該市場的成長軌跡。
氣體淨化器市場分為使用點氣體淨化器和大宗氣體淨化器,其中使用點系統因其精確性和可靠性而獲得了顯著的吸引力。 2024 年,使用點部分的市場規模達到 14 億美元,預計到 2034 年將超過 25 億美元,這得益於應用現場對局部氣體淨化的需求不斷成長。這些系統旨在即時輸送高純度氣體,提供增強的性能和一致的輸出品質。對確保無污染操作的解決方案的需求不斷成長,極大地促進了關鍵行業對使用點淨化器的採用。它們能夠在不影響氣體品質的情況下進行現場淨化,使其成為精度至關重要的操作的首選。
| 市場範圍 | |
|---|---|
| 起始年份 | 2024 |
| 預測年份 | 2025-2034 |
| 起始值 | 20.1億美元 |
| 預測值 | 35億美元 |
| 複合年成長率 | 5.8% |
根據應用,市場分為單一氣體淨化器和多種氣體去除系統,其中後者佔相當大的佔有率。多種氣體去除系統在 2024 年創造了 13.1 億美元的收入,並在 2025 年至 2034 年期間佔據了 65.3% 的市場佔有率。這一領域的快速成長是由對能夠同時消除各種氣體雜質的綜合系統日益成長的需求所推動的。這些整合淨化解決方案使產業能夠透過單一設定處理多種污染物,從而簡化流程並保持高營運效率。它們的多功能性和滿足廣泛淨化需求的能力是推動市場擴張的關鍵因素。
光是美國氣體淨化器市場在 2024 年的價值就達到 4.654 億美元,預計到 2034 年將以 6.5% 的複合年成長率成長,這得益於對提高營運性能和滿足嚴格環境要求的高效系統的需求。
目錄
第1章:方法論與範圍
第2章:執行摘要
第3章:行業洞察
- 產業生態系統分析
- 影響價值鏈的因素
- 利潤率分析
- 中斷
- 未來展望
- 製造商
- 經銷商
- 衝擊力
- 成長動力
- 嚴格的環境法規和政策
- 擴大最終用途產業
- 產業陷阱與挑戰
- 高昂的資本和營運成本
- 成長動力
- 技術與創新格局
- 成長潛力分析
- 監管格局
- 定價分析
- 波特的分析
- PESTEL分析
第4章:競爭格局
- 介紹
- 公司市佔率分析
- 競爭定位矩陣
- 戰略展望矩陣
第5章:市場估計與預測:按類型,2021 年至 2034 年
- 主要趨勢
- 使用點
- 大宗氣體淨化器/場地/設施
第6章:市場估計與預測:依操作壓力,2021 年至 2034 年
- 主要趨勢
- 低於100Psi
- 100Psi至200 Psi
- 200 磅/平方英吋 400 磅/平方英寸
- 高於400Psi
第7章:市場估計與預測:按應用,2021 年至 2034 年
- 主要趨勢
- 單一氣體淨化器
- 多重氣體去除
第 8 章:市場估計與預測:按最終用途產業,2021 年至 2034 年
- 主要趨勢
- 半導體
- 化學和石化行業
- 醫療保健產業
- 金屬和採礦業
- 食品和飲料業
- 其他(太陽能和能源等)
第9章:市場估計與預測:按配銷通路,2021 年至 2034 年
- 主要趨勢
- 直接的
- 間接
第10章:市場估計與預測:按地區,2021 年至 2034 年
- 主要趨勢
- 北美洲
- 美國
- 加拿大
- 歐洲
- 德國
- 英國
- 法國
- 義大利
- 西班牙
- 亞太地區
- 中國
- 印度
- 日本
- 韓國
- 澳洲
- 拉丁美洲
- 巴西
- 墨西哥
- MEA
- 阿拉伯聯合大公國
- 沙烏地阿拉伯
- 南非
第 11 章:公司簡介
- Air Water Mechatronics Inc.
- Applied Energy Systems, Inc.
- Entegris, Inc.
- Linde Plc
- Markes International Ltd
- Matheson Tri-Gas, Inc.
- MBRAUN
- Merck KGaA
- Mott
- NuPure Corporation
- Pall Corporation
- Parker Hannifin Corp
- SAES Getters SpA
- Thermo Fisher Scientific Inc.
- VICI Metronics
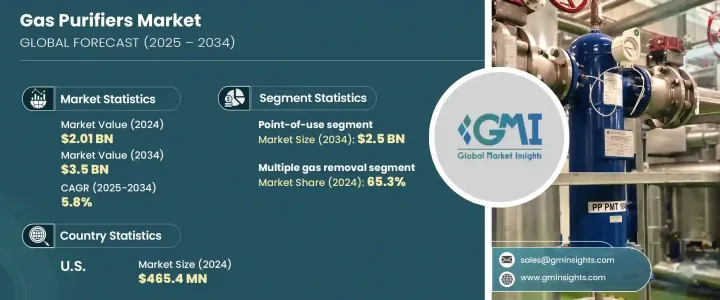
The Global Gas Purifiers Market reached a valuation of USD 2.01 billion in 2024 and is anticipated to expand at a CAGR of 5.8% from 2025 to 2034. The rising demand for advanced gas purification solutions stems from growing environmental concerns and stricter global regulations targeting air quality and emission reductions. With regulatory bodies worldwide enforcing tougher standards to control pollutants and reduce greenhouse gases, industries are increasingly adopting gas purifiers to comply with these evolving mandates. As businesses focus on meeting regulatory benchmarks and enhancing sustainability efforts, the need for reliable gas purification systems is growing rapidly. This trend is supported by the urgent requirement to reduce industrial emissions and ensure safer, cleaner air across various manufacturing processes. Furthermore, increasing industrialization, along with heightened awareness about environmental protection, is fueling the demand for efficient gas purifiers. Companies are prioritizing advanced purification technologies to align with global efforts aimed at reducing environmental impact, thus accelerating the growth trajectory of this market.
The gas purifiers market is segmented into point-of-use and bulk gas purifiers, with point-of-use systems gaining significant traction due to their precision and reliability. In 2024, the point-of-use segment reached USD 1.4 billion and is projected to surpass USD 2.5 billion by 2034, supported by a growing need for localized gas purification at the site of application. These systems are engineered to deliver high-purity gases in real time, offering enhanced performance and consistent output quality. The rising demand for solutions that ensure contamination-free operations is significantly boosting the adoption of point-of-use purifiers in critical industries. Their ability to deliver on-site purification without compromising on gas quality makes them a preferred choice for operations where precision is crucial.
| Market Scope | |
|---|---|
| Start Year | 2024 |
| Forecast Year | 2025-2034 |
| Start Value | $2.01 Billion |
| Forecast Value | $3.5 Billion |
| CAGR | 5.8% |
On the basis of application, the market is divided into single gas purifiers and multiple gas removal systems, with the latter accounting for a considerable share. Multiple gas removal systems generated USD 1.31 billion in 2024 and represented 65.3% of the market share between 2025 and 2034. The rapid growth of this segment is driven by the increasing need for comprehensive systems capable of eliminating various gas impurities simultaneously. These integrated purification solutions enable industries to streamline processes and maintain high operational efficiency by handling multiple contaminants in a single setup. Their versatility and ability to address a broad range of purification needs are key factors fueling market expansion.
The U.S. gas purifiers market alone was valued at USD 465.4 million in 2024 and is expected to grow at a CAGR of 6.5% through 2034, propelled by the demand for efficient systems that enhance operational performance and meet stringent environmental requirements.
Table of Contents
Chapter 1 Methodology & Scope
- 1.1 Market scope & definition
- 1.2 Base estimates & calculations
- 1.3 Forecast parameters
- 1.4 Data sources
- 1.4.1 Primary
- 1.4.2 Secondary
- 1.4.2.1 Paid sources
- 1.4.2.2 Public sources
Chapter 2 Executive Summary
- 2.1 Industry 3600 synopsis, 2021 - 2034
Chapter 3 Industry Insights
- 3.1 Industry ecosystem analysis
- 3.1.1 Factor affecting the value chain
- 3.1.2 Profit margin analysis
- 3.1.3 Disruptions
- 3.1.4 Future outlook
- 3.1.5 Manufacturers
- 3.1.6 Distributors
- 3.2 Impact forces
- 3.2.1 Growth drivers
- 3.2.1.1 Stringent Environmental Regulations and Policies
- 3.2.1.2 Expanding End Use Industries
- 3.2.2 Industry pitfalls & challenges
- 3.2.2.1 High Capital and Operational Costs
- 3.2.1 Growth drivers
- 3.3 Technology & innovation landscape
- 3.4 Growth potential analysis
- 3.5 Regulatory landscape
- 3.6 Pricing analysis
- 3.7 Porter’s analysis
- 3.8 PESTEL analysis
Chapter 4 Competitive Landscape, 2024
- 4.1 Introduction
- 4.2 Company market share analysis
- 4.3 Competitive positioning matrix
- 4.4 Strategic outlook matrix
Chapter 5 Market Estimates & Forecast, By Type, 2021 – 2034 (USD Million) (Thousand Units)
- 5.1 Key Trends
- 5.2 Point-of-use
- 5.3 Bulk gas purifier/site/facility
Chapter 6 Market Estimates & Forecast, By Operating Pressure, 2021 – 2034 (USD Million) (Thousand Units)
- 6.1 Key trends
- 6.2 Below 100Psi
- 6.3 100Psi to 200 Psi
- 6.4 200Psi 400 Psi
- 6.5 Above 400Psi
Chapter 7 Market Estimates & Forecast, By Application, 2021 – 2034, (USD Million) (Thousand Units)
- 7.1 Key trends
- 7.2 Single gas purifier
- 7.3 Multiple gas removal
Chapter 8 Market Estimates & Forecast, By End Use Industry, 2021 – 2034, (USD Million) (Thousand Units)
- 8.1 Key trends
- 8.2 Semiconductor
- 8.3 Chemicals & petrochemicals industry
- 8.4 Healthcare industry
- 8.5 Metals & mining industry
- 8.6 Food & beverages industry
- 8.7 Others (solar and energy etc.)
Chapter 9 Market Estimates & Forecast, By Distribution Channel, 2021 – 2034, (USD Million) (Thousand Units)
- 9.1 Key trends
- 9.2 Direct
- 9.3 Indirect
Chapter 10 Market Estimates & Forecast, By Region, 2021 – 2034, (USD Million) (Thousand Units)
- 10.1 Key trends
- 10.2 North America
- 10.2.1 U.S.
- 10.2.2 Canada
- 10.3 Europe
- 10.3.1 Germany
- 10.3.2 U.K.
- 10.3.3 France
- 10.3.4 Italy
- 10.3.5 Spain
- 10.4 Asia Pacific
- 10.4.1 China
- 10.4.2 India
- 10.4.3 Japan
- 10.4.4 South Korea
- 10.4.5 Australia
- 10.5 Latin America
- 10.5.1 Brazil
- 10.5.2 Mexico
- 10.6 MEA
- 10.6.1 UAE
- 10.6.2 Saudi Arabia
- 10.6.3 South Africa
Chapter 11 Company Profiles (Business Overview, Financial Data, Product Landscape, Strategic Outlook, SWOT Analysis)
- 11.1 Air Water Mechatronics Inc.
- 11.2 Applied Energy Systems, Inc.
- 11.3 Entegris, Inc.
- 11.4 Linde Plc
- 11.5 Markes International Ltd
- 11.6 Matheson Tri-Gas, Inc.
- 11.7 MBRAUN
- 11.8 Merck KGaA
- 11.9 Mott
- 11.10 NuPure Corporation
- 11.11 Pall Corporation
- 11.12 Parker Hannifin Corp
- 11.13 SAES Getters S.p.A.
- 11.14 Thermo Fisher Scientific Inc.
- 11.15 VICI Metronics
