


 |
市場調查報告書
商品編碼
1716598
非酒精飲料包裝市場機會、成長動力、產業趨勢分析及 2025 - 2034 年預測Non-alcoholic Beverage Packaging Market Opportunity, Growth Drivers, Industry Trend Analysis, and Forecast 2025 - 2034 |
||||||
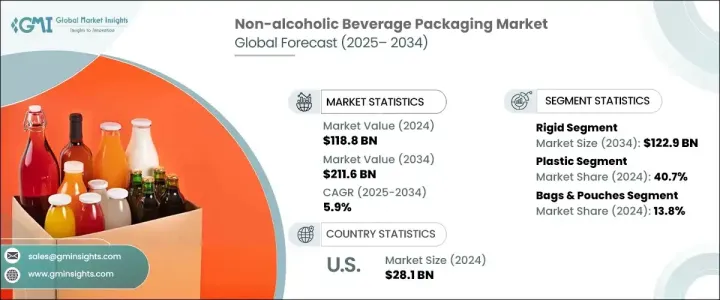
2024 年全球非酒精飲料包裝市場規模達到 1,188 億美元,預計 2025 年至 2034 年期間的複合年成長率為 5.9%。隨著消費者偏好轉向更健康的飲料選擇,對創新和永續包裝解決方案的需求正在上升。各大品牌正積極應對低糖飲料、真果汁飲料和功能性飲料日益成長的受歡迎程度,採用能夠保持新鮮度、確保營養完整性並符合嚴格監管要求的包裝。隨著企業致力於提高便利性,同時盡量減少對環境的影響,環保材料和定量包裝形式的趨勢進一步推動了市場的發展。
隨著注重健康的消費者推動對功能性飲料的需求,品牌擴大利用包裝作為增強產品吸引力和永續性的策略工具。能量飲料、調味水和低熱量食品的日益流行,使得包裝不僅需要保持產品的完整性,還需要滿足不斷變化的消費者期望。隨著飲料公司尋求在便利性和環境責任之間取得平衡,輕質、可回收材料、可生物分解的選擇和永續包裝創新正在迅速獲得關注。
| 市場範圍 | |
|---|---|
| 起始年份 | 2024 |
| 預測年份 | 2025-2034 |
| 起始值 | 1188億美元 |
| 預測值 | 2116億美元 |
| 複合年成長率 | 5.9% |
市場分為硬質包裝和軟包裝類型,預計到 2034 年硬質包裝的產值將達到 1,229 億美元。硬質包裝因其耐用性、卓越的產品保護和多功能性仍然是首選,使其成為優質和功能性飲料的理想解決方案。隨著對高品質飲料的需求不斷成長,製造商正在採用鋁和玻璃等永續材料來滿足具有環保意識的消費者的需求。這一趨勢在高階果汁和功能性飲料領域尤其明顯,品牌強調包裝的美觀、可回收性和產品差異化。
2024 年,塑膠包裝佔據非酒精飲料包裝市場的 40.7%,因其價格實惠和適應性而保持主導地位。然而,圍繞不可生物分解塑膠廢物日益成長的環境問題促使製造商轉向永續的替代品。隨著各公司投資可再填充和可重複使用的塑膠瓶計劃,再生 PET (rPET) 和生物塑膠的採用勢頭日益強勁。這些努力符合全球永續發展目標,同時確保為尋求便攜和隨時飲料選擇的消費者提供持續的便利。
2024 年,北美在非酒精飲料包裝市場佔有 27.1% 的佔有率,鞏固了其作為關鍵區域參與者的地位。該地區的市場擴張是由消費者對永續包裝的強勁需求以及對迎合快節奏生活方式的單份和攜帶式形式的偏好所推動的。環保材料、智慧包裝技術和功能性飲料包裝解決方案的不斷創新進一步加強了北美在塑造全球產業趨勢中的作用。
目錄
第1章:方法論與範圍
第2章:執行摘要
第3章:行業洞察
- 產業生態系統分析
- 產業衝擊力
- 成長動力
- 軟性飲料銷量增加
- 轉向隨時隨地的消費習慣
- 對健康飲料的需求不斷成長
- 罐裝非酒精飲料的激增
- 成人軟性飲料日益流行
- 產業陷阱與挑戰
- 原物料價格波動和嚴格的環境法規
- 塑膠的環境影響
- 成長動力
- 成長潛力分析
- 監管格局
- 技術格局
- 未來市場趨勢
- 差距分析
- 波特的分析
- PESTEL分析
第4章:競爭格局
- 介紹
- 公司市佔率分析
- 主要市場參與者的競爭分析
- 競爭定位矩陣
- 策略儀表板
第5章:市場估計與預測:按類型,2021 - 2034 年
- 主要趨勢
- 死板的
- 靈活的
第6章:市場估計與預測:按材料,2021 - 2034 年
- 主要趨勢
- 塑膠
- 寵物
- 聚丙烯
- 高密度聚乙烯
- 低密度聚乙烯
- 其他
- 金屬
- 玻璃
- 紙和紙板
- 其他
第7章:市場估計與預測:按產品,2021 - 2034 年
- 主要趨勢
- 包包和小袋
- 瓶子和罐子
- 罐頭
- 桶和鼓
- 盒子和紙箱
- 其他
第8章:市場估計與預測:按應用,2021 - 2034 年
- 主要趨勢
- 碳酸軟性飲料
- 果汁
- 即飲茶和咖啡
- 功能性飲料
- 乳製品
- 其他
第9章:市場估計與預測:按地區,2021 - 2034 年
- 主要趨勢
- 北美洲
- 美國
- 加拿大
- 歐洲
- 德國
- 英國
- 法國
- 西班牙
- 義大利
- 荷蘭
- 亞太地區
- 中國
- 印度
- 日本
- 澳洲
- 韓國
- 拉丁美洲
- 巴西
- 墨西哥
- 阿根廷
- 中東和非洲
- 沙烏地阿拉伯
- 南非
- 阿拉伯聯合大公國
第10章:公司簡介
- Anchor Glass Container
- Airlite Plastics
- Ardagh Group
- Ball Corporation
- Can Corporation of America
- Can Pack Group
- CL Smith
- Crown Holdings
- Envases Group
- International Paper
- Mondi
- OI Glass
- Pactiv Evergreen
- Silgan Containers
- Smurfit Kappa
- Stora Enso
- Tetra Pak
- Verallia
- WestRock
The Global Non-Alcoholic Beverage Packaging Market reached USD 118.8 billion in 2024 and is projected to grow at a CAGR of 5.9% between 2025 and 2034. As consumer preferences shift toward healthier beverage choices, the demand for innovative and sustainable packaging solutions is on the rise. Brands are actively responding to the growing popularity of low-sugar drinks, real juice beverages, and functional drinks by adopting packaging that preserves freshness, ensures nutritional integrity, and meets stringent regulatory requirements. The trend toward eco-friendly materials and portion-controlled packaging formats further fuels the market, as companies aim to enhance convenience while minimizing environmental impact.
With health-conscious consumers driving the demand for functional beverages, brands are increasingly leveraging packaging as a strategic tool to enhance product appeal and sustainability. The rising popularity of energy drinks, flavored water, and low-calorie options has created a need for packaging that not only maintains product integrity but also aligns with evolving consumer expectations. Lightweight, recyclable materials, biodegradable options, and sustainable packaging innovations are rapidly gaining traction as beverage companies seek to balance convenience with environmental responsibility.
| Market Scope | |
|---|---|
| Start Year | 2024 |
| Forecast Year | 2025-2034 |
| Start Value | $118.8 Billion |
| Forecast Value | $211.6 Billion |
| CAGR | 5.9% |
The market is segmented into rigid and flexible packaging types, with rigid packaging projected to generate USD 122.9 billion by 2034. Rigid packaging remains a preferred choice due to its durability, superior product protection, and versatility, making it an ideal solution for premium and functional beverages. As demand for high-quality beverages continues to rise, manufacturers are embracing sustainable materials like aluminum and glass to cater to eco-conscious consumers. This trend is particularly evident in the premium juice and functional beverage segment, where brands emphasize packaging aesthetics, recyclability, and product differentiation.
The plastic segment accounted for 40.7% of the non-alcoholic beverage packaging market in 2024, maintaining its dominance due to affordability and adaptability. However, growing environmental concerns surrounding non-biodegradable plastic waste are prompting manufacturers to transition toward sustainable alternatives. The adoption of recycled PET (rPET) and bioplastics is gaining momentum, with companies investing in refillable and reusable plastic bottle initiatives. These efforts align with global sustainability targets while ensuring continued convenience for consumers who seek portable and on-the-go beverage options.
North America held a 27.1% share in the non-alcoholic beverage packaging market in 2024, reinforcing its position as a key regional player. The market expansion in this region is driven by strong consumer demand for sustainable packaging, coupled with a preference for single-serve and on-the-go formats that cater to fast-paced lifestyles. Continuous innovation in eco-friendly materials, smart packaging technologies, and functional beverage packaging solutions further strengthens North America's role in shaping global industry trends.
Table of Contents
Chapter 1 Methodology and Scope
- 1.1 Market scope and definitions
- 1.2 Research design
- 1.2.1 Research approach
- 1.2.2 Data collection methods
- 1.3 Base estimates and calculations
- 1.3.1 Base year calculation
- 1.3.2 Key trends for market estimation
- 1.4 Forecast model
- 1.5 Primary research and validation
- 1.5.1 Primary sources
- 1.5.2 Data mining sources
Chapter 2 Executive Summary
- 2.1 Industry 3600 synopsis
Chapter 3 Industry Insights
- 3.1 Industry ecosystem analysis
- 3.2 Industry impact forces
- 3.2.1 Growth drivers
- 3.2.1.1 Increasing sales of soft drinks
- 3.2.1.2 Shift towards on-the-go consumption habits
- 3.2.1.3 Rising demand for healthier beverages
- 3.2.1.4 Proliferation of non-alcoholic beverages in cans
- 3.2.1.5 Rising popularity of adult soft drinks
- 3.2.2 Industry pitfalls and challenges
- 3.2.2.1 Volatile raw material prices and stringent environmental regulations
- 3.2.2.2 Environmental effects of plastic
- 3.2.1 Growth drivers
- 3.3 Growth potential analysis
- 3.4 Regulatory landscape
- 3.5 Technology landscape
- 3.6 Future market trends
- 3.7 Gap analysis
- 3.8 Porter's analysis
- 3.9 PESTEL analysis
Chapter 4 Competitive Landscape, 2024
- 4.1 Introduction
- 4.2 Company market share analysis
- 4.3 Competitive analysis of major market players
- 4.4 Competitive positioning matrix
- 4.5 Strategy dashboard
Chapter 5 Market Estimates and Forecast, By Type, 2021 - 2034 (USD Bn & Kilo Tons)
- 5.1 Key trends
- 5.2 Rigid
- 5.3 Flexible
Chapter 6 Market Estimates and Forecast, By Material, 2021 - 2034 (USD Bn & Kilo Tons)
- 6.1 Key trends
- 6.2 Plastic
- 6.2.1 PET
- 6.2.2 PP
- 6.2.3 HDPE
- 6.2.4 LDPE
- 6.2.5 Others
- 6.3 Metal
- 6.4 Glass
- 6.5 Paper & paperboard
- 6.6 Others
Chapter 7 Market Estimates and Forecast, By Product, 2021 - 2034 (USD Bn & Kilo Tons)
- 7.1 Key trends
- 7.2 Bags & pouch
- 7.3 Bottles & jars
- 7.4 Cans
- 7.5 Barrels & drums
- 7.6 Boxes & cartons
- 7.7 Others
Chapter 8 Market Estimates and Forecast, By Application, 2021 - 2034 (USD Bn & Kilo Tons)
- 8.1 Key trends
- 8.2 Carbonated soft drinks
- 8.3 Juices
- 8.4 Ready-to-drink tea & coffee
- 8.5 Functional drinks
- 8.6 Dairy products
- 8.7 Others
Chapter 9 Market Estimates and Forecast, By Region, 2021 - 2034 (USD Bn & Kilo Tons)
- 9.1 Key trends
- 9.2 North America
- 9.2.1 U.S.
- 9.2.2 Canada
- 9.3 Europe
- 9.3.1 Germany
- 9.3.2 UK
- 9.3.3 France
- 9.3.4 Spain
- 9.3.5 Italy
- 9.3.6 Netherlands
- 9.4 Asia Pacific
- 9.4.1 China
- 9.4.2 India
- 9.4.3 Japan
- 9.4.4 Australia
- 9.4.5 South Korea
- 9.5 Latin America
- 9.5.1 Brazil
- 9.5.2 Mexico
- 9.5.3 Argentina
- 9.6 Middle East and Africa
- 9.6.1 Saudi Arabia
- 9.6.2 South Africa
- 9.6.3 UAE
Chapter 10 Company Profiles
- 10.1 Anchor Glass Container
- 10.2 Airlite Plastics
- 10.3 Ardagh Group
- 10.4 Ball Corporation
- 10.5 Can Corporation of America
- 10.6 Can Pack Group
- 10.7 C.L. Smith
- 10.8 Crown Holdings
- 10.9 Envases Group
- 10.10 International Paper
- 10.11 Mondi
- 10.12 O-I Glass
- 10.13 Pactiv Evergreen
- 10.14 Silgan Containers
- 10.15 Smurfit Kappa
- 10.16 Stora Enso
- 10.17 Tetra Pak
- 10.18 Verallia
- 10.19 WestRock
 飲料包裝市場:2026-2032年全球市場預測(依飲料類型、材料類型、包裝形式、營運模式及通路分類)
 2026年全球飲料包裝市場報告
 全球飲料包裝市場:市場規模與預測(2034 年)
 飲料包裝市場商機、成長要素、產業趨勢分析及2026-2035年預測。
 日本包裝飲料市場規模、佔有率、趨勢和預測:按類型、包裝類型、通路和地區分類,2026-2034年熱灌裝包裝全球市場報告(2026年)日本飲料包裝市場報告:按材料、產品、應用和地區分類(2026-2034年)
 飲料包裝創新市場預測至2032年:按材料、包裝類型、創新類型、飲料類別、技術、最終用戶和地區分類的全球分析飲料容器回收市場機會、成長促進因素、產業趨勢分析及預測(2025-2034年)2032 年塑膠中性水市場預測:按產品類型、包裝類型、塑膠中性機制、價格分佈範圍、分銷管道、最終用戶和地區進行的全球分析