


 |
市場調查報告書
商品編碼
1716594
充氣城堡市場機會、成長動力、產業趨勢分析及 2025 - 2034 年預測Bounce House Market Opportunity, Growth Drivers, Industry Trend Analysis, and Forecast 2025 - 2034 |
||||||
2024 年全球充氣城堡市場規模達 42 億美元,預估 2025-2034 年期間複合年成長率為 4.1%。隨著全球對充氣娛樂解決方案的需求不斷成長,市場持續保持穩定成長。隨著越來越多的家庭為孩子尋求安全、有趣且價格合理的娛樂選擇,充氣城堡已成為首選,為各種場合提供充滿樂趣的體驗。充氣城堡的流行也與越來越多的遊樂園、家庭娛樂中心和室內遊樂場有關,這些遊樂園、家庭娛樂中心和室內遊樂場正在擴大其服務範圍,以吸引更年輕的觀眾。
這些充氣景點具有多種主題和設計,不僅限於商業場所 - 它們現在已成為生日派對、學校活動、公司家庭活動和社區節日的常見特色。充氣城堡色彩鮮豔、主題有趣、功能可客製化,深受注重安全和娛樂的兒童和家長的青睞。製造商也專注於推出將樂趣與安全相結合的創新設計,使用符合國際安全標準的高品質、耐用的材料。可支配收入的增加和對兒童娛樂活動的高度關注進一步推動了市場的成長,尤其是在戶外遊樂場所有限的城市地區。
| 市場範圍 | |
|---|---|
| 起始年份 | 2024 |
| 預測年份 | 2025-2034 |
| 起始值 | 42億美元 |
| 預測值 | 62億美元 |
| 複合年成長率 | 4.1% |
充氣城堡市場根據產品類型進行細分,包括帶有滑梯的充氣城堡、不帶滑梯的充氣城堡、障礙賽道、組合充氣城堡和其他充氣城堡。 2024 年,不含滑梯的充氣城堡的收入為 16 億美元,預計到 2034 年將達到 24 億美元。這些模型因其多功能性和廣泛的吸引力而越來越受歡迎。無滑梯的充氣城堡配有攀岩牆、互動障礙物和創意主題等功能,是生日派對、學校嘉年華和教堂聚會等各種活動的首選。它們外觀設計美觀且易於安裝,非常適合室內和室外使用,因此廣受歡迎。
根據年齡段,充氣城堡市場分為 4 歲以下、4-8 歲和 8 歲以上類別。 2024 年,4-8 歲年齡層佔據了 44% 的主導市場。該細分市場的充氣城堡旨在滿足兒童高能量遊戲需求,提供安全且令人興奮的環境,促進兒童積極玩耍。對於 4 歲以下的兒童,製造商專注於創造柔軟、低矮的結構,以促進運動技能發展和社交互動。對於年齡較大的孩子來說,帶有更多冒險元素(如障礙賽和具有挑戰性的攀爬)的充氣城堡可以滿足他們對刺激遊戲體驗的需求。
美國充氣城堡市場預計以每年 3.8% 的複合年成長率成長。作為充氣娛樂的主要市場,美國受益於強大的供應鏈和提供主題和客製化充氣城堡設計的眾多供應商。消費者在休閒和娛樂活動上的支出不斷增加,加上嚴格的安全法規和品質標準,繼續推動該國的市場成長。
目錄
第1章:方法論與範圍
第2章:執行摘要
第3章:行業洞察
- 產業生態系統分析
- 影響價值鏈的因素
- 利潤率分析
- 中斷
- 未來展望
- 製造商
- 經銷商
- 零售商
- 衝擊力
- 成長動力
- 增加可支配收入
- 租賃機構不斷成長
- 不斷成長的遊樂園
- 產業陷阱與挑戰
- 天氣敏感性
- 市場飽和
- 成長動力
- 消費者購買行為分析
- 人口趨勢
- 影響購買決策的因素
- 消費者產品採用
- 首選配銷通路
- 首選價格範圍
- 成長潛力分析
- 監管格局
- 定價分析
- 波特的分析
- PESTEL分析
第4章:競爭格局
- 介紹
- 公司市佔率分析
- 競爭定位矩陣
- 戰略展望矩陣
第5章:市場估計與預測:按類型,2021 年至 2034 年
- 主要趨勢
- 附幻燈片
- 無幻燈片
- 障礙賽
- 連擊
- 其他
第6章:市場估計與預測:依年齡層,2021-2034 年
- 主要趨勢
- 最多 4 年
- 4-8歲
- 8歲以上
第7章:市場估計與預測:依價格區間,2021-2034
- 主要趨勢
- 低(最高 500 美元)
- 中(500-1000美元)
- 高(超過 1000 美元)
第8章:市場估計與預測:依最終用途,2021-2034
- 主要趨勢
- 個人
- 商業的
第9章:市場估計與預測:按配銷通路,2021-2034
- 主要趨勢
- 線上
- 離線
第10章:市場估計與預測:按地區,2021 年至 2034 年
- 主要趨勢
- 北美洲
- 美國
- 加拿大
- 歐洲
- 英國
- 德國
- 法國
- 義大利
- 西班牙
- 亞太地區
- 中國
- 日本
- 印度
- 韓國
- 澳洲
- 拉丁美洲
- 巴西
- 墨西哥
- MEA
- 南非
- 沙烏地阿拉伯
- 阿拉伯聯合大公國
第 11 章:公司簡介
- B-Air
- Blast Zone
- Bouncer Depot
- Cloud 9
- Commercial Inflatable
- Cutting Edge Creations
- EZ Inflatables
- HEC Worldwide
- House of Bounce
- Inflatable Depot
- Jungle Jumps
- Magic Jump
- Ninja Jump
- Tent and Table
- Ultimate Jumpers
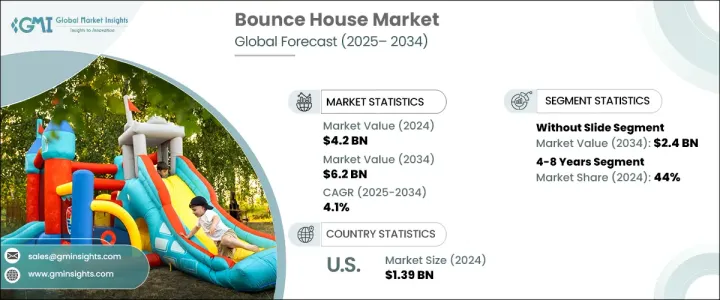
The Global Bounce House Market reached USD 4.2 billion in 2024 and is expected to grow at a CAGR of 4.1% during 2025-2034. The market continues to witness steady growth as the demand for inflatable entertainment solutions rises worldwide. As families increasingly seek safe, engaging, and affordable entertainment options for children, bounce houses have emerged as a top choice, offering fun-filled experiences for various occasions. The popularity of bounce houses is also tied to the growing number of amusement parks, family entertainment centers, and indoor playgrounds that are expanding their offerings to attract younger audiences.
These inflatable attractions, available in a wide range of themes and designs, are not just limited to commercial venues - they are now a common feature at birthday parties, school functions, corporate family events, and community festivals. With their vibrant colors, playful themes, and customizable features, bounce houses appeal to both children and parents who prioritize safety and enjoyment. Manufacturers are also focusing on introducing innovative designs that combine fun with safety, using high-quality, durable materials that comply with international safety standards. The market's growth is further supported by rising disposable incomes and a heightened focus on recreational activities for children, especially in urban areas where outdoor play spaces may be limited.
| Market Scope | |
|---|---|
| Start Year | 2024 |
| Forecast Year | 2025-2034 |
| Start Value | $4.2 Billion |
| Forecast Value | $6.2 Billion |
| CAGR | 4.1% |
The bounce house market is segmented based on product types, including bounce houses with slides, without slides, obstacle courses, combos, and others. Bounce houses without slides accounted for USD 1.6 billion in revenue in 2024 and are projected to generate USD 2.4 billion by 2034. These models are gaining traction for their versatility and broad appeal. Equipped with features like climbing walls, interactive obstacles, and creative themes, bounce houses without slides are a preferred choice for various events, including birthday parties, school carnivals, and church gatherings. Their visually attractive designs and ease of setup make them ideal for both indoor and outdoor use, contributing to their widespread popularity.
By age group, the bounce house market is divided into up to 4 years, 4-8 years, and over 8 years categories. The 4-8 years age group held a dominant 44% market share in 2024. Bounce houses in this segment are designed to meet the high-energy play needs of children, offering safe yet exciting environments that foster active play. For children under 4 years old, manufacturers focus on creating soft, low-height structures that encourage motor skill development and social interaction. For older children, bounce houses with more adventurous elements like obstacle courses and challenging climbs cater to their demand for thrilling play experiences.
The U.S. Bounce House Market is set to grow at a CAGR of 3.8% annually. As the leading market for inflatable entertainment, the U.S. benefits from a strong supply chain and a wide range of suppliers offering themed and customized bounce house designs. Rising consumer spending on leisure and recreational activities, combined with stringent safety regulations and quality standards, continues to drive market growth in the country.
Table of Contents
Chapter 1 Methodology & Scope
- 1.1 Market scope & definition
- 1.2 Base estimates & calculations
- 1.3 Forecast parameters
- 1.4 Data sources
- 1.4.1 Primary
- 1.5 Secondary
- 1.5.1.1 Paid sources
- 1.5.1.2 Public sources
Chapter 2 Executive Summary
- 2.1 Industry synopsis, 2021 - 2034
Chapter 3 Industry Insights
- 3.1 Industry ecosystem analysis
- 3.1.1 Factor affecting the value chain
- 3.1.2 Profit margin analysis
- 3.1.3 Disruptions
- 3.1.4 Future outlook
- 3.1.5 Manufacturers
- 3.1.6 Distributors
- 3.1.7 Retailers
- 3.2 Impact forces
- 3.2.1 Growth drivers
- 3.2.1.1 Increasing disposable income
- 3.2.1.2 Growing rental agencies
- 3.2.1.3 Growing amusement parks
- 3.2.2 Industry pitfalls & challenges
- 3.2.2.1 Weather sensitivity
- 3.2.2.2 Market saturation
- 3.2.1 Growth drivers
- 3.3 Consumer buying behavior analysis
- 3.3.1 Demographic trends
- 3.3.2 Factors affecting buying decision
- 3.3.3 Consumer product adoption
- 3.3.4 Preferred distribution channel
- 3.3.5 Preferred price range
- 3.4 Growth potential analysis
- 3.5 Regulatory landscape
- 3.6 Pricing analysis
- 3.7 Porter's analysis
- 3.8 PESTEL analysis
Chapter 4 Competitive Landscape, 2024
- 4.1 Introduction
- 4.2 Company market share analysis
- 4.3 Competitive positioning matrix
- 4.4 Strategic outlook matrix
Chapter 5 Market Estimates and Forecast, By Type, 2021 – 2034 (USD Billion) (Million Units)
- 5.1 Key trends
- 5.2 With slide
- 5.3 Without slide
- 5.4 Obstacle course
- 5.5 Combo
- 5.6 Others
Chapter 6 Market Estimates & Forecast, By Age Group, 2021-2034 (USD Billion) (Million Units)
- 6.1 Key trends
- 6.2 Upto 4 years
- 6.3 4-8 years
- 6.4 Above 8 years
Chapter 7 Market Estimates & Forecast, By Price Range, 2021-2034 (USD Billion) (Million Units)
- 7.1 Key trends
- 7.2 Low (upto 500$)
- 7.3 Mid (500$-1000$)
- 7.4 High (more than 1000$)
Chapter 8 Market Estimates & Forecast, By End Use, 2021-2034 (USD Billion) (Million Units)
- 8.1 Key trends
- 8.2 Individual
- 8.3 Commercial
Chapter 9 Market Estimates & Forecast, By Distribution Channel, 2021-2034 (USD Billion) (Million Units)
- 9.1 Key trends
- 9.2 Online
- 9.3 Offline
Chapter 10 Market Estimates & Forecast, By Region, 2021 – 2034, (USD Billion) (Million Units)
- 10.1 Key trends
- 10.2 North America
- 10.2.1 U.S.
- 10.2.2 Canada
- 10.3 Europe
- 10.3.1 UK
- 10.3.2 Germany
- 10.3.3 France
- 10.3.4 Italy
- 10.3.5 Spain
- 10.4 Asia Pacific
- 10.4.1 China
- 10.4.2 Japan
- 10.4.3 India
- 10.4.4 South Korea
- 10.4.5 Australia
- 10.5 Latin America
- 10.5.1 Brazil
- 10.5.2 Mexico
- 10.6 MEA
- 10.6.1 South Africa
- 10.6.2 Saudi Arabia
- 10.6.3 UAE
Chapter 11 Company Profiles (Business Overview, Financial Data, Product Landscape, Strategic Outlook, SWOT Analysis)
- 11.1 B-Air
- 11.2 Blast Zone
- 11.3 Bouncer Depot
- 11.4 Cloud 9
- 11.5 Commercial Inflatable
- 11.6 Cutting Edge Creations
- 11.7 EZ Inflatables
- 11.8 HEC Worldwide
- 11.9 House of Bounce
- 11.10 Inflatable Depot
- 11.11 Jungle Jumps
- 11.12 Magic Jump
- 11.13 Ninja Jump
- 11.14 Tent and Table
- 11.15 Ultimate Jumpers


