


 |
市場調查報告書
商品編碼
1716577
工業鍋爐市場機會、成長動力、產業趨勢分析及2025-2034年預測Industrial Boiler Market Opportunity, Growth Drivers, Industry Trend Analysis, and Forecast 2025 - 2034 |
||||||
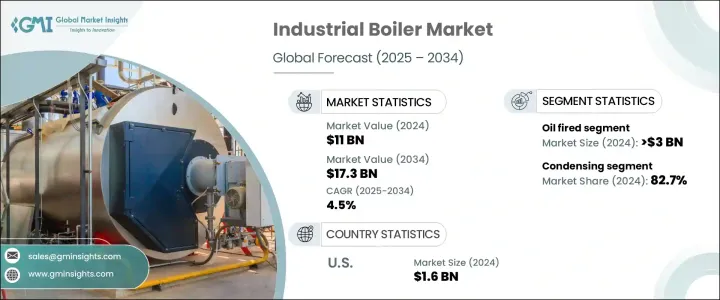
2024 年全球工業鍋爐市場規模達 110 億美元,預計 2025 年至 2034 年期間的複合年成長率為 4.5%。隨著各行各業越來越注重永續性、能源效率以及遵守更嚴格的環境法規,市場正在穩步成長。隨著氣候變遷問題的日益嚴重,世界各國政府正在實施嚴格的氮氧化物 (NOx)、硫氧化物 (SOx) 和二氧化碳 (CO2) 等污染物排放標準。這些監管措施迫使工業設施採用更清潔、更有效率的鍋爐技術,從而推動了各行業的巨大需求。此外,全球向再生能源的轉變正在改變工業營運,許多公司正在轉向生質能、氫和生物燃料等環保燃料替代品。
工業鍋爐市場的製造商正在透過開發下一代鍋爐系統來應對這些不斷變化的趨勢,以最佳化燃料消耗並最大限度地減少排放。工業基礎設施資本投資的增加,特別是新興經濟體的工業基礎設施資本投資的增加,進一步推動了市場擴張。化學加工、食品飲料和發電等行業正在優先考慮符合永續發展目標並提高營運效率的先進加熱解決方案。隨著企業尋求符合全球排放要求的經濟高效、節能的系統,對高性能工業鍋爐的需求預計會增加。
| 市場範圍 | |
|---|---|
| 起始年份 | 2024 |
| 預測年份 | 2025-2034 |
| 起始值 | 110億美元 |
| 預測值 | 173億美元 |
| 複合年成長率 | 4.5% |
工業鍋爐市場根據燃料類型細分,包括天然氣、石油和煤炭。預計到 2034 年,天然氣領域的複合年成長率將達到 5%,這主要得益於液化天然氣 (LNG) 基礎設施的快速擴張以及政府推廣低排放燃料替代品的激勵措施。隨著各行各業面臨越來越大的減少碳足跡的壓力,人們越來越傾向於使用性能卓越且符合嚴格環境標準的先進鍋爐。此外,要求更好的鍋爐性能認證的安全法規正在鼓勵各行各業採用技術先進的系統。
從技術面來看,工業鍋爐市場分為冷凝鍋爐和非冷凝鍋爐。冷凝工業鍋爐領域在 2024 年佔據了 82.7% 的市場佔有率,預計未來幾年將實現顯著成長。這些鍋爐的設計旨在提高運作效率,減少燃料消耗並降低溫室氣體排放。它們能夠捕獲和重新利用廢氣中的熱量,從而節省能源,使其成為工業應用的一個有吸引力的選擇。隨著企業優先考慮永續性,冷凝鍋爐因其對環境的影響較小且具有長期成本效益而越來越受歡迎。
美國工業鍋爐市場價值預計在 2022 年達到 14 億美元,隨著各行各業對節能供熱基礎設施的投資,該市場將繼續成長。更嚴格的能源效率要求和永續營運的推動正在推動採用先進的加熱技術來滿足空間和水加熱需求。高性能工業鍋爐在提高營運效率方面發揮著至關重要的作用,從而促進了該地區的市場成長。隨著各行各業對其供暖系統進行現代化改造以符合不斷變化的法規,對創新和環保鍋爐技術的需求將激增,從而進一步加強美國工業鍋爐市場。
目錄
第1章:方法論與範圍
第2章:執行摘要
第3章:行業洞察
- 產業生態系統分析
- 監管格局
- 產業衝擊力
- 成長動力
- 產業陷阱與挑戰
- 成長潛力分析
- 波特的分析
- PESTEL分析
第4章:競爭格局
- 介紹
- 戰略展望
- 創新與永續發展格局
第5章:市場規模及預測:依產品,2021 年至 2034 年
- 主要趨勢
- 火管
- 按容量
- < 10 百萬英熱單位/小時
- 10 - 25 百萬英熱單位/小時
- 25 - 50 百萬英熱單位/小時
- 50 - 75 百萬英熱單位/小時
- 75 - 100 百萬英熱單位/小時
- 100 - 175 百萬英熱單位/小時
- 175 - 250 百萬英熱單位/小時
- > 250 百萬英熱單位/小時
- 按應用
- 食品加工
- 紙漿和造紙
- 化學
- 煉油廠
- 原生金屬
- 其他
- 依技術
- 冷凝
- 無凝結
- 按燃料
- 天然氣
- 油
- 煤炭
- 其他
- 按容量
- 水管
- 按容量
- < 10 百萬英熱單位/小時
- 10 - 25 百萬英熱單位/小時
- 25 - 50 百萬英熱單位/小時
- 50 - 75 百萬英熱單位/小時
- 75 - 100 百萬英熱單位/小時
- 100 - 175 百萬英熱單位/小時
- 175 - 250 百萬英熱單位/小時
- > 250 百萬英熱單位/小時
- 按應用
- 食品加工
- 紙漿和造紙
- 化學
- 煉油廠
- 原生金屬
- 其他
- 依技術
- 冷凝
- 無凝結
- 按燃料
- 天然氣
- 油
- 煤炭
- 其他
- 按容量
第6章:市場規模及預測:依產能,2021 年至 2034 年
- 主要趨勢
- < 10 百萬英熱單位/小時
- 10 - 25 百萬英熱單位/小時
- 25 - 50 百萬英熱單位/小時
- 50 - 75 百萬英熱單位/小時
- 75 - 100 百萬英熱單位/小時
- 100 - 175 百萬英熱單位/小時
- 175 - 250 百萬英熱單位/小時
- > 250 百萬英熱單位/小時
第7章:市場規模及預測:依應用,2021 年至 2034 年
- 主要趨勢
- 食品加工
- 紙漿和造紙
- 化學
- 煉油廠
- 原生金屬
- 其他
第8章:市場規模及預測:依燃料,2021 年至 2034 年
- 主要趨勢
- 天然氣
- 油
- 煤炭
- 其他
第9章:市場規模及預測:依技術分類,2021 年至 2034 年
- 主要趨勢
- 冷凝
- 無凝結
第 10 章:市場規模與預測:按地區,2021 年至 2034 年
- 主要趨勢
- 北美洲
- 美國
- 加拿大
- 墨西哥
- 歐洲
- 法國
- 英國
- 波蘭
- 義大利
- 西班牙
- 奧地利
- 德國
- 瑞典
- 俄羅斯
- 亞太地區
- 中國
- 印度
- 菲律賓
- 日本
- 韓國
- 澳洲
- 印尼
- 中東和非洲
- 沙烏地阿拉伯
- 伊朗
- 阿拉伯聯合大公國
- 奈及利亞
- 南非
- 拉丁美洲
- 巴西
- 阿根廷
- 智利
第 11 章:公司簡介
- Babcock and Wilcox
- Bharat Heavy Electricals
- Bosch Industriekessel
- Clayton Industries
- Cleaver-Brooks
- Cochran
- Doosan Heavy Industries and Construction
- Ferroli
- Fondital
- Fonderie Sime
- Forbes Marshall
- Fulton
- Groupe Atlantic
- General Electric
- Hoval
- Hurst Boiler & Welding
- IHI Corporation
- John Cockerill
- John Wood Group
- Mitsubishi Heavy Industries
- Miura America
- Rentech Boilers
- Siemens
- Sofinter
- Thermax
- Victory Energy Operations
- Viessmann Climate Solutions
- Walchandnagar Industries
The global industrial boiler market generated USD 11 billion in 2024 and is projected to grow at a CAGR of 4.5% between 2025 and 2034. The market is experiencing steady growth as industries increasingly focus on sustainability, energy efficiency, and compliance with stricter environmental regulations. As climate change concerns escalate, governments worldwide are implementing stringent emission standards for pollutants such as nitrogen oxides (NOx), sulfur oxides (SOx), and carbon dioxide (CO2). These regulatory measures are compelling industrial facilities to adopt cleaner and more efficient boiler technologies, driving significant demand across various sectors. Additionally, the global shift toward renewable energy sources is transforming industrial operations, with many companies transitioning to eco-friendly fuel alternatives such as biomass, hydrogen, and biofuels.
Manufacturers in the industrial boiler market are responding to these evolving trends by developing next-generation boiler systems that optimize fuel consumption while minimizing emissions. Rising capital investments in industrial infrastructure, particularly in emerging economies, are further fueling market expansion. Industries such as chemical processing, food and beverage, and power generation are prioritizing advanced heating solutions that align with sustainability goals and enhance operational efficiency. The demand for high-performance industrial boilers is expected to rise as businesses seek cost-effective, energy-efficient systems that comply with global emission mandates.
| Market Scope | |
|---|---|
| Start Year | 2024 |
| Forecast Year | 2025-2034 |
| Start Value | $11 Billion |
| Forecast Value | $17.3 Billion |
| CAGR | 4.5% |
The industrial boiler market is segmented based on fuel type, including natural gas, oil, and coal. The natural gas segment is anticipated to witness a CAGR of 5% by 2034, largely driven by the rapid expansion of liquefied natural gas (LNG) infrastructure and government incentives promoting low-emission fuel alternatives. As industries face mounting pressure to reduce their carbon footprint, there is a growing preference for advanced boilers that offer superior performance while adhering to stringent environmental standards. Additionally, safety regulations mandating better boiler performance certifications are encouraging the adoption of technologically advanced systems across industries.
In terms of technology, the industrial boiler market is classified into condensing and non-condensing boilers. The condensing industrial boiler segment held an 82.7% market share in 2024 and is expected to see remarkable growth in the coming years. These boilers are designed to operate with higher efficiency, reducing fuel consumption and lowering greenhouse gas emissions. Their ability to capture and reuse heat from exhaust gases enhances energy savings, making them an attractive choice for industrial applications. As businesses prioritize sustainability, condensing boilers are gaining traction due to their lower environmental impact and long-term cost benefits.
U.S. industrial boiler market, valued at USD 1.4 billion in 2022, continues to grow as industries invest in energy-efficient heating infrastructure. Stricter energy efficiency mandates and the push for sustainable operations are driving the adoption of advanced heating technologies to meet space and water heating demands. High-performance industrial boilers are playing a crucial role in improving operational efficiency, thus reinforcing market growth in the region. As industries modernize their heating systems to comply with evolving regulations, the demand for innovative and eco-friendly boiler technologies is set to surge, further strengthening the industrial boiler market in the United States.
Table of Contents
Chapter 1 Methodology & Scope
- 1.1 Market scope & definitions
- 1.2 Market estimates & forecast parameters
- 1.3 Forecast calculation
- 1.4 Data sources
- 1.4.1 Primary
- 1.4.2 Secondary
- 1.4.2.1 Paid
- 1.4.2.2 Public
Chapter 2 Executive Summary
- 2.1 Industry synopsis, 2021 - 2034
Chapter 3 Industry Insights
- 3.1 Industry ecosystem analysis
- 3.2 Regulatory landscape
- 3.3 Industry impact forces
- 3.3.1 Growth drivers
- 3.3.2 Industry pitfalls & challenges
- 3.4 Growth potential analysis
- 3.5 Porter's analysis
- 3.5.1 Bargaining power of suppliers
- 3.5.2 Bargaining power of buyers
- 3.5.3 Threat of new entrants
- 3.5.4 Threat of substitutes
- 3.6 PESTEL Analysis
Chapter 4 Competitive Landscape, 2025
- 4.1 Introduction
- 4.2 Strategic outlook
- 4.3 Innovation & sustainability landscape
Chapter 5 Market Size and Forecast, By Product, 2021 – 2034 (Units, MMBtu/hr & USD Million)
- 5.1 Key trends
- 5.2 Fire-tube
- 5.2.1 By capacity
- 5.2.1.1 < 10 MMBtu/hr
- 5.2.1.2 10 - 25 MMBtu/hr
- 5.2.1.3 25 - 50 MMBtu/hr
- 5.2.1.4 50 - 75 MMBtu/hr
- 5.2.1.5 75 - 100 MMBtu/hr
- 5.2.1.6 100 - 175 MMBtu/hr
- 5.2.1.7 175 - 250 MMBtu/hr
- 5.2.1.8 > 250 MMBtu/hr
- 5.2.2 By application
- 5.2.2.1 Food processing
- 5.2.2.2 Pulp & paper
- 5.2.2.3 Chemical
- 5.2.2.4 Refinery
- 5.2.2.5 Primary metal
- 5.2.2.6 Others
- 5.2.3 By technology
- 5.2.3.1 Condensing
- 5.2.3.2 Non-condensing
- 5.2.4 By fuel
- 5.2.4.1 Natural gas
- 5.2.4.2 Oil
- 5.2.4.3 Coal
- 5.2.4.4 Others
- 5.2.1 By capacity
- 5.3 Water-tube
- 5.3.1 By capacity
- 5.3.1.1 < 10 MMBtu/hr
- 5.3.1.2 10 - 25 MMBtu/hr
- 5.3.1.3 25 - 50 MMBtu/hr
- 5.3.1.4 50 - 75 MMBtu/hr
- 5.3.1.5 75 - 100 MMBtu/hr
- 5.3.1.6 100 - 175 MMBtu/hr
- 5.3.1.7 175 - 250 MMBtu/hr
- 5.3.1.8 > 250 MMBtu/hr
- 5.3.2 By application
- 5.3.2.1 Food processing
- 5.3.2.2 Pulp & paper
- 5.3.2.3 Chemical
- 5.3.2.4 Refinery
- 5.3.2.5 Primary metal
- 5.3.2.6 Others
- 5.3.3 By technology
- 5.3.3.1 Condensing
- 5.3.3.2 Non-condensing
- 5.3.4 By fuel
- 5.3.4.1 Natural gas
- 5.3.4.2 Oil
- 5.3.4.3 Coal
- 5.3.4.4 Others
- 5.3.1 By capacity
Chapter 6 Market Size and Forecast, By Capacity, 2021 – 2034 (Units, MMBtu/hr & USD Million)
- 6.1 Key trends
- 6.2 < 10 MMBtu/hr
- 6.3 10 - 25 MMBtu/hr
- 6.4 25 - 50 MMBtu/hr
- 6.5 50 - 75 MMBtu/hr
- 6.6 75 - 100 MMBtu/hr
- 6.7 100 - 175 MMBtu/hr
- 6.8 175 - 250 MMBtu/hr
- 6.9 > 250 MMBtu/hr
Chapter 7 Market Size and Forecast, By Application, 2021 – 2034 (Units, MMBtu/hr & USD Million)
- 7.1 Key trends
- 7.2 Food processing
- 7.3 Pulp & paper
- 7.4 Chemical
- 7.5 Refinery
- 7.6 Primary metal
- 7.7 Others
Chapter 8 Market Size and Forecast, By Fuel, 2021 – 2034 (Units, MMBtu/hr & USD Million)
- 8.1 Key trends
- 8.2 Natural gas
- 8.3 Oil
- 8.4 Coal
- 8.5 Others
Chapter 9 Market Size and Forecast, By Technology, 2021 – 2034 (Units, MMBtu/hr & USD Million)
- 9.1 Key trends
- 9.2 Condensing
- 9.3 Non-condensing
Chapter 10 Market Size and Forecast, By Region, 2021 – 2034 (Units, MMBtu/hr & USD Million)
- 10.1 Key trends
- 10.2 North America
- 10.2.1 U.S.
- 10.2.2 Canada
- 10.2.3 Mexico
- 10.3 Europe
- 10.3.1 France
- 10.3.2 UK
- 10.3.3 Poland
- 10.3.4 Italy
- 10.3.5 Spain
- 10.3.6 Austria
- 10.3.7 Germany
- 10.3.8 Sweden
- 10.3.9 Russia
- 10.4 Asia Pacific
- 10.4.1 China
- 10.4.2 India
- 10.4.3 Philippines
- 10.4.4 Japan
- 10.4.5 South Korea
- 10.4.6 Australia
- 10.4.7 Indonesia
- 10.5 Middle East & Africa
- 10.5.1 Saudi Arabia
- 10.5.2 Iran
- 10.5.3 UAE
- 10.5.4 Nigeria
- 10.5.5 South Africa
- 10.6 Latin America
- 10.6.1 Brazil
- 10.6.2 Argentina
- 10.6.3 Chile
Chapter 11 Company Profiles
- 11.1 Babcock and Wilcox
- 11.2 Bharat Heavy Electricals
- 11.3 Bosch Industriekessel
- 11.4 Clayton Industries
- 11.5 Cleaver-Brooks
- 11.6 Cochran
- 11.7 Doosan Heavy Industries and Construction
- 11.8 Ferroli
- 11.9 Fondital
- 11.10 Fonderie Sime
- 11.11 Forbes Marshall
- 11.12 Fulton
- 11.13 Groupe Atlantic
- 11.14 General Electric
- 11.15 Hoval
- 11.16 Hurst Boiler & Welding
- 11.17 IHI Corporation
- 11.18 John Cockerill
- 11.19 John Wood Group
- 11.20 Mitsubishi Heavy Industries
- 11.21 Miura America
- 11.22 Rentech Boilers
- 11.23 Siemens
- 11.24 Sofinter
- 11.25 Thermax
- 11.26 Victory Energy Operations
- 11.27 Viessmann Climate Solutions
- 11.28 Walchandnagar Industries
 工業鍋爐維護市場規模、佔有率和成長分析(按類型、服務、最終用戶和地區分類)-2026-2033年產業預測
 工業鍋爐市場規模、佔有率和成長分析(按鍋爐類型、功能、燃料類型、額定容量、鍋爐馬力、技術和地區分類)—2026-2033年產業預測
 工業鍋爐市場(按鍋爐類型、燃料類型、設計類型、容量、技術、組件、最終用途行業和安裝類型分類)—全球預測,2025-2032年
 2025年全球工業鍋爐市場報告
 全球工業火管低溫鍋爐市場全球工業鍋爐維修市場全球低溫工業鍋爐市場
 工業鍋爐市場規模、佔有率和趨勢分析報告:按容量、鍋爐類型、類型、燃料、應用、地區和細分市場預測,2025 年至 2033 年全球冷凝式低溫商用鍋爐市場全球工業用燃氣水管鍋爐市場