


 |
市場調查報告書
商品編碼
1716558
冷藏自動販賣機市場機會、成長動力、產業趨勢分析及 2025 - 2034 年預測Refrigerated Vending Machine Market Opportunity, Growth Drivers, Industry Trend Analysis, and Forecast 2025 - 2034 |
||||||
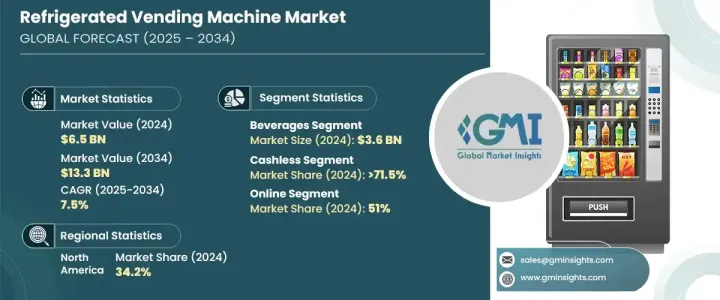
2024 年全球冷藏自動販賣機市場價值為 65 億美元,預計 2025 年至 2034 年的複合年成長率為 7.5%。這一成長主要得益於對冷凍食品、冷藏飲料和易腐爛產品的需求不斷成長,而這得益於人們生活方式的改變和對方便、即食食品的日益成長的偏好。隨著城市化和繁忙的工作日程不斷影響消費者偏好,越來越多的人選擇冷凍食品、乳製品、冰淇淋和新鮮零食,冷藏自動販賣機成為滿足這些需求的理想解決方案。
多區域冷卻、即時監控和節能冷卻系統等技術進步有助於維持產品的新鮮度和安全性,同時降低營運成本。根據美國能源部的數據,這些系統可以減少高達 30% 的能源消耗,對於旨在最佳化性能和降低成本的企業來說,它們是一個有吸引力的選擇。隨著自助零售和自動便利商店的日益普及,冷藏自動販賣機在機場、醫院、辦公室和公共交通站等地提供新鮮和冷凍食品選擇,進一步推動了市場的發展。
| 市場範圍 | |
|---|---|
| 起始年份 | 2024 |
| 預測年份 | 2025-2034 |
| 起始值 | 65億美元 |
| 預測值 | 133億美元 |
| 複合年成長率 | 7.5% |
2024 年,飲料業創造 36 億美元的收入,預計在預測期內以 7.9% 的複合年成長率成長。瓶裝水、軟性飲料、冰咖啡和能量飲料的需求量很大,使得冷藏自動販賣機成為忙碌消費者的首選。功能性飲料(例如調味水和健康飲料)的日益普及進一步刺激了這種需求。配備先進冷卻系統和無現金支付選項的智慧自動販賣機在學校、辦公室、醫院和機場等人流量大的區域越來越受歡迎,增強了自動販賣機對於尋求快速便捷地獲得冰鎮飲料的消費者的吸引力。
2024 年,無現金支付領域佔據了超過 71.5% 的市場佔有率,預計到 2034 年將以 9% 的速度成長。無現金支付系統的廣泛採用透過提供安全且方便用戶使用的選項簡化了自動販賣機交易。消費者擴大從現金轉向行動錢包、信用卡/金融卡和非接觸式支付。配備 NFC 掃描器和2D碼閱讀器的智慧自動販賣機可實現無縫、安全的支付,滿足日益成長的無現金便利需求。
受電子商務平台提供的便利性和多樣性的推動,到 2024 年,線上配銷通路將佔據 51% 的主要佔有率。線上管道允許消費者在購買之前比較型號、查看產品規格並閱讀客戶評論。買家可以享受多種付款方式、輕鬆訂購和直接送貨上門服務,無需前往實體店。製造商還利用線上平台接觸更廣泛的客戶群,並提供有關其產品的詳細資訊,從而促進線上銷售日益普及。
2024 年,北美引領冷藏自動販賣機市場,佔全球市場佔有率的 34.2%,創造約 22 億美元的收入。該地區的成長得益於快餐店和零售連鎖店的廣泛存在,對即食小吃和飲料的強勁需求。配備人工智慧庫存管理和數位支付系統的智慧自動販賣機的使用日益增多,進一步加強了市場擴張。政府舉措,例如美國能源部推廣節能冷卻技術的激勵措施,也鼓勵了產業的創新和採用。
目錄
第1章:方法論與範圍
第2章:執行摘要
第3章:行業洞察
- 產業生態系統分析
- 供應商格局
- 定價分析
- 技術與創新格局
- 重要新聞和舉措
- 監管格局
- 製造商
- 經銷商
- 對部隊的影響
- 成長動力
- 冷凍食品和冷藏產品的需求不斷成長
- 生活方式的改變和快速的城市化
- 產業陷阱與挑戰
- 安裝和營運成本高
- 日益嚴格的監管
- 成長動力
- 成長潛力分析
- 波特的分析
- PESTEL分析
第4章:競爭格局
- 介紹
- 公司市佔率分析
- 競爭定位矩陣
- 戰略展望矩陣
第5章:市場估計與預測:按產品類型,2021 - 2034 年(十億美元)
- 主要趨勢
- 飲料
- 非酒精性
- 汽水
- 可樂
- 檸檬水
- 水果味汽水
- 熱飲
- 水
- 其他(果汁等)
- 汽水
- 酒精
- 非酒精性
- 乳製品
- 新鮮水果和蔬菜
- 冷凍食品
- 其他(製藥)
第6章:市場估計與預測:按營運模式,2021 - 2034 年(十億美元)
- 主要趨勢
- 聰明的
- 傳統的
第7章:市場估計與預測:按支付方式,2021 - 2034 年(十億美元)
- 主要趨勢
- 現金
- 無現金
第8章:市場估計與預測:按最終用途,2021 - 2034 年(十億美元)
- 主要趨勢
- 食品服務
- 全方位服務的餐廳和飯店
- 速食店
- 其他(咖啡廳、酒吧)
- 零售
- 超市和超市
- 雜貨
- 藥局
- 其他(個體店、一元商店等)
- 其他(企業、博覽會、地鐵等)
第9章:市場估計與預測:按配銷通路,2021 - 2034 年(十億美元)
- 主要趨勢
- 線上
- 電子商務
- 公司網站
- 離線
第10章:市場估計與預測:按地區,2021 - 2034 年(十億美元)
- 主要趨勢
- 北美洲
- 美國
- 加拿大
- 歐洲
- 英國
- 德國
- 法國
- 義大利
- 西班牙
- 俄羅斯
- 亞太地區
- 中國
- 印度
- 日本
- 澳洲
- 韓國
- 拉丁美洲
- 巴西
- 墨西哥
- 阿根廷
- MEA
- 阿拉伯聯合大公國
- 南非
- 沙烏地阿拉伯
第 11 章:公司簡介
- Azkoyen
- Bharat Refrigerations
- Bianchi Vending
- Crane Merchandising
- Dover
- FAS International
- Fuji Electric
- Heatcraft Worldwide Refrigeration
- Rheavendors
- Rockwell Industries
- RS Hughes
- Seaga Manufacturing
- Vendcraftz
- Vendekin Technologies
- Westomatic Vending Services
The Global Refrigerated Vending Machine Market was valued at USD 6.5 billion in 2024 and is expected to grow at a CAGR of 7.5% from 2025 to 2034. This growth is largely driven by the increasing demand for frozen foods, chilled beverages, and perishable products, fueled by changing lifestyles and the growing preference for convenient, ready-to-eat options. As urbanization and busy work schedules continue to shape consumer preferences, more people are opting for frozen meals, dairy products, ice cream, and fresh snacks, making refrigerated vending machines an ideal solution to meet these needs.
Technological advancements such as multi-zone cooling, real-time monitoring, and energy-efficient refrigeration systems help maintain product freshness and safety while reducing operational costs. According to the U.S. Department of Energy, these systems can reduce energy consumption by up to 30%, making them an attractive option for businesses aiming to optimize performance and minimize expenses. The increasing adoption of self-service retail and automated convenience stores has further fueled the market as refrigerated vending machines offer fresh and frozen food options at locations like airports, hospitals, offices, and public transit stations.
| Market Scope | |
|---|---|
| Start Year | 2024 |
| Forecast Year | 2025-2034 |
| Start Value | $6.5 Billion |
| Forecast Value | $13.3 Billion |
| CAGR | 7.5% |
In 2024, the beverages segment generated USD 3.6 billion in revenue and is expected to grow at a CAGR of 7.9% during the forecast period. High demand for bottled water, soft drinks, iced coffee, and energy drinks has made refrigerated vending machines a preferred choice for on-the-go consumers. The increasing popularity of functional beverages, such as flavored water and health-boosting drinks, has further fueled this demand. Smart vending machines equipped with advanced cooling systems and cashless payment options have become increasingly popular in high-traffic areas such as schools, offices, hospitals, and airports, enhancing the appeal of vending machines for consumers seeking quick and convenient access to chilled beverages.
The cashless segment accounted for over 71.5% of the market in 2024 and is projected to grow at a rate of 9% through 2034. The widespread adoption of cashless payment systems has simplified vending machine transactions by offering secure and user-friendly options. Consumers are increasingly shifting from cash to mobile wallets, credit/debit cards, and contactless payments. Smart vending machines equipped with NFC scanners and QR code readers facilitate seamless and secure payments, catering to the growing demand for cashless convenience.
The online distribution channel held a major share of 51% in 2024, driven by the convenience and variety offered by e-commerce platforms. Online channels allow consumers to compare models, review product specifications, and read customer reviews before making a purchase. Buyers benefit from multiple payment options, easy ordering, and direct home delivery, eliminating the need to visit physical stores. Manufacturers also leverage online platforms to reach a broader customer base and provide detailed information about their products, contributing to the growing popularity of online sales.
North America led the refrigerated vending machine market in 2024, accounting for 34.2% of the global market share and generating approximately USD 2.2 billion in revenue. The region's growth is fueled by a strong demand for grab-and-go snacks and beverages, influenced by the widespread presence of fast-food restaurants and retail chains. The rising use of intelligent vending machines with AI-driven inventory management and digital payment systems has further strengthened market expansion. Government initiatives, such as incentives from the U.S. Department of Energy promoting energy-efficient refrigeration technologies, have also encouraged innovation and adoption within the industry.
Table of Contents
Chapter 1 Methodology & Scope
- 1.1 Research design
- 1.1.1 Research approach
- 1.1.2 Data collection methods
- 1.2 Base estimates and calculations
- 1.2.1 Base year calculation
- 1.2.2 Key trends for market estimates
- 1.3 Forecast model
- 1.4 Primary research & validation
- 1.4.1 Primary sources
- 1.4.2 Data mining sources
- 1.5 Market definitions
Chapter 2 Executive Summary
- 2.1 Industry synopsis, 2021 - 2034
Chapter 3 Industry Insights
- 3.1 Industry ecosystem analysis
- 3.2 Supplier landscape
- 3.3 Pricing analysis
- 3.4 Technology & innovation landscape
- 3.5 Key news & initiatives
- 3.6 Regulatory landscape
- 3.7 Manufacturers
- 3.8 Distributors
- 3.9 Impact on forces
- 3.9.1 Growth drivers
- 3.9.1.1 Rising demand of frozen foods and chilled products
- 3.9.1.2 Changing lifestyle and rapid urbanization
- 3.9.2 Industry pitfalls & challenges
- 3.9.2.1 High installation and operating costs
- 3.9.2.2 Rising stringent regulations
- 3.9.1 Growth drivers
- 3.10 Growth potential analysis
- 3.11 Porter's analysis
- 3.12 PESTEL analysis
Chapter 4 Competitive Landscape, 2024
- 4.1 Introduction
- 4.2 Company market share analysis
- 4.3 Competitive positioning matrix
- 4.4 Strategic outlook matrix
Chapter 5 Market Estimates & Forecast, By Product Type, 2021 - 2034 ($Bn) (Thousand Units)
- 5.1 Key trends
- 5.2 Beverages
- 5.2.1 Non-alcoholic
- 5.2.1.1 Soft drink
- 5.2.1.1.1 Cola
- 5.2.1.1.2 Lemonade
- 5.2.1.1.3 Fruit-flavored sodas
- 5.2.1.1.4 Hot beverages
- 5.2.1.2 Water
- 5.2.1.3 Others (Fruit Juices, etc.)
- 5.2.1.1 Soft drink
- 5.2.2 Alcoholic
- 5.2.1 Non-alcoholic
- 5.3 Dairy products
- 5.4 Fresh fruits and vegetables
- 5.5 Frozen foods
- 5.6 Others (Pharma)
Chapter 6 Market Estimates & Forecast, By Operation Mode, 2021 - 2034 ($Bn) (Thousand Units)
- 6.1 Key trends
- 6.2 Smart
- 6.3 Conventional
Chapter 7 Market Estimates & Forecast, By Payment Mode, 2021 - 2034 ($Bn) (Thousand Units)
- 7.1 Key trends
- 7.2 Cash
- 7.3 Cashless
Chapter 8 Market Estimates & Forecast, By End Use, 2021 - 2034 ($Bn) (Thousand Units)
- 8.1 Key trends
- 8.2 Food services
- 8.2.1 Full-Service Restaurants & Hotels
- 8.2.2 Quick service restaurants
- 8.2.3 Others (cafe, bars)
- 8.3 Retails
- 8.3.1 Supermarket & Supermarket
- 8.3.2 Groceries
- 8.3.3 Drug store
- 8.3.4 Others (Individual Stores, Dollar Stores, etc.)
- 8.4 Others (Corporates, Expo, metro, etc.)
Chapter 9 Market Estimates & Forecast, By Distribution Channel, 2021 - 2034 ($Bn) (Thousand Units)
- 9.1 Key trends
- 9.2 Online
- 9.2.1 E-commerce
- 9.2.2 Company website
- 9.3 Offline
Chapter 10 Market Estimates & Forecast, By Region, 2021 - 2034 ($Bn) (Thousand Units)
- 10.1 Key trends
- 10.2 North America
- 10.2.1 U.S.
- 10.2.2 Canada
- 10.3 Europe
- 10.3.1 UK
- 10.3.2 Germany
- 10.3.3 France
- 10.3.4 Italy
- 10.3.5 Spain
- 10.3.6 Russia
- 10.4 Asia Pacific
- 10.4.1 China
- 10.4.2 India
- 10.4.3 Japan
- 10.4.4 Australia
- 10.4.5 South Korea
- 10.5 Latin America
- 10.5.1 Brazil
- 10.5.2 Mexico
- 10.5.3 Argentina
- 10.6 MEA
- 10.6.1 UAE
- 10.6.2 South Africa
- 10.6.3 Saudi Arabia
Chapter 11 Company Profiles
- 11.1 Azkoyen
- 11.2 Bharat Refrigerations
- 11.3 Bianchi Vending
- 11.4 Crane Merchandising
- 11.5 Dover
- 11.6 FAS International
- 11.7 Fuji Electric
- 11.8 Heatcraft Worldwide Refrigeration
- 11.9 Rheavendors
- 11.10 Rockwell Industries
- 11.11 RS Hughes
- 11.12 Seaga Manufacturing
- 11.13 Vendcraftz
- 11.14 Vendekin Technologies
- 11.15 Westomatic Vending Services
 北美零售自動販賣機市場:市場規模、佔有率和趨勢分析(按產品、安裝地點、支付方式和國家/地區分類),細分市場預測(2025-2033 年)
 自動販賣機市場預測至2032年:按型號、技術、支付方式、應用和地區分類的全球分析2032 年智慧售貨和自動零售市場預測:按機器類型、部署、分銷管道、技術、最終用戶和地區進行的全球分析
 按產品類型、付款方式、自動販賣技術、地點和最終用戶分類的零售自動販賣機市場-2025-2032年全球預測按產品類型、支付方式、溫度控制、安裝位置、最終用戶和分銷管道分類的投幣式自動販賣機市場-2025年至2032年全球預測智慧型自動販賣機市場按產品類型、組件、最終用戶和分銷管道分類-2025-2032年全球預測自動販賣機市場按產品類型、技術、應用和支付方式分類-2025-2032年全球預測
 2025年全球自動販賣機市場報告2025年全球零售自動販賣機市場報告2025年全球自動販賣機營運商市場報告