

 |
市場調查報告書
商品編碼
1716548
光纖預製棒市場機會、成長動力、產業趨勢分析及 2025 - 2034 年預測Fiber Optic Preform Market Opportunity, Growth Drivers, Industry Trend Analysis, and Forecast 2025 - 2034 |
||||||
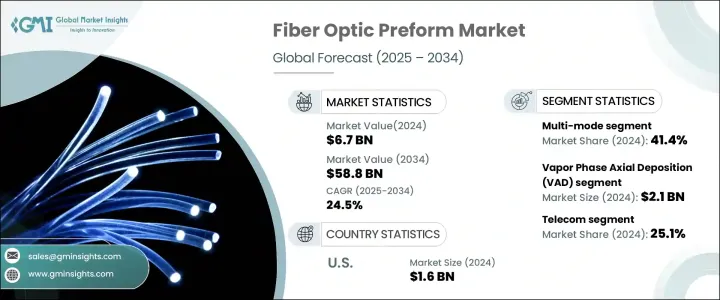
2024 年全球光纖預製棒市場規模達 67 億美元,預估 2025-2034 年期間複合年成長率為 24.5%。這一顯著成長得益於高速網際網路的日益普及,這得益於 5G 網路的推出以及對更快、更可靠的資料傳輸的需求不斷成長。隨著現代數位基礎設施對企業和家庭變得至關重要,光纖預製棒在提高網路容量和效能方面發揮關鍵作用。這些預製件對於製造能夠實現無縫通訊、雲端運算以及人工智慧 (AI) 和物聯網 (IoT) 等先進技術的光纖電纜至關重要。
隨著世界各國致力於改善數位連接,政府措施和對光纖基礎設施的大量投資進一步加速了市場擴張。此外,超大規模和邊緣資料中心的激增凸顯了對先進光纖解決方案的需求,以支援不斷成長的資料流量。人們對能夠處理視訊串流、線上遊戲和雲端服務等資料密集型應用程式激增的大容量網路的偏好日益增加,進一步增強了市場的上升趨勢。
| 市場範圍 | |
|---|---|
| 起始年份 | 2024 |
| 預測年份 | 2025-2034 |
| 起始值 | 67億美元 |
| 預測值 | 588億美元 |
| 複合年成長率 | 24.5% |
市場按產品類型細分為單模、多模和其他類別。 2024年,多模式市場佔有41.4%的佔有率。多模光纖非常適合短距離通訊,支援100G、400G和800G等先進的乙太網路技術。與單模光纖相比,它們在短距離應用中的成本效益使其成為企業實施區域網路 (LAN) 和儲存區域網路 (SAN) 的首選。多模光纖也因其能夠在較短距離內有效處理高資料傳輸速率而聞名,這使得它們對於企業網路來說不可或缺。
根據工藝,光纖預製棒市場分為改進化學氣相沉積 (MCVD)、氣相軸向沉積 (VAD)、外部氣相沉積 (OVD) 和等離子體活化化學氣相沉積 (PCVD)。 2024 年,VAD 製程創造了 21 億美元的產值。 VAD 因其能夠生產品質穩定的長而連續的預製棒,被廣泛應用於大規模生產環境中。這種方法使製造商能夠大量生產光纖電纜,同時保持高精度,滿足全球日益成長的光纖解決方案需求。
2024 年美國光纖預製棒市場產值將達到 16 億美元,反映出對大容量網路的需求不斷成長以及對數位基礎設施的投資不斷增加。雲端運算和人工智慧的快速成長帶動了資料中心的擴張,對可靠的光纖解決方案提出了更高的需求。各大電信公司正大力投資光纖基礎設施,以滿足對更快、更可靠的連接日益成長的需求。隨著消費者和企業都尋求提高資料傳輸能力,光纖預製棒仍然是加強國家數位基礎設施不可或缺的一部分。
目錄
第1章:方法論與範圍
第2章:執行摘要
第3章:行業洞察
- 產業生態系統分析
- 影響價值鏈的因素
- 利潤率分析
- 中斷
- 未來展望
- 製造商
- 經銷商
- 供應商格局
- 利潤率分析
- 重要新聞和舉措
- 監管格局
- 衝擊力
- 成長動力
- 5G網路的快速普及
- 有利的政府措施和投資
- 高速網路需求增加
- 海底電纜部署日益增多
- 光纖技術的進步
- 產業陷阱與挑戰
- 生產成本高
- 原物料價格波動
- 成長動力
- 成長潛力分析
- 波特的分析
- PESTEL分析
第4章:競爭格局
- 介紹
- 公司市佔率分析
- 競爭定位矩陣
- 戰略展望矩陣
第5章:市場估計與預測:依產品類型,2021-2034
- 主要趨勢
- 單模
- 多模式
- 其他
第6章:市場估計與預測:依工藝,2021-2034
- 主要趨勢
- 氣相軸向沉積 (VAD)
- 改良的化學氣相沉積(MCVD)
- 外部氣相沉積(OVD)
- 等離子活化化學氣相沉積(PCVD)
第7章:市場估計與預測:按最終用途產業,2021-2034 年
- 主要趨勢
- 電信
- 石油和天然氣
- 軍事和航太
- 金融服務業
- 醫療的
- 鐵路
- 其他
第8章:市場估計與預測:按地區,2021-2034
- 主要趨勢
- 北美洲
- 美國
- 加拿大
- 歐洲
- 英國
- 德國
- 法國
- 義大利
- 西班牙
- 俄羅斯
- 亞太地區
- 中國
- 印度
- 日本
- 韓國
- 澳洲
- 拉丁美洲
- 巴西
- 墨西哥
- MEA
- 南非
- 沙烏地阿拉伯
- 阿拉伯聯合大公國
第9章:公司簡介
- Corning Incorporated
- Fasten Group
- FCJ OPTO TECH
- Fujikura Ltd.
- Futong Group
- Hengtong Group
- Heraeus Holding GmbH
- Jiangsu Zhongtian Technology Co., Ltd.
- OFS Fitel, LLC
- Prysmian Group
- Rosendahl Nextrom GmbH
- Shin-Etsu Chemical Co., Ltd
- Sterlite Technologies Limited
- Sumitomo Electric Industries, Ltd
- Yangtze Optical Fibre (YOFC)
The Global Fiber Optic Preform Market generated USD 6.7 billion in 2024 and is expected to expand at a CAGR of 24.5% during 2025-2034. This remarkable growth is fueled by the increasing adoption of high-speed internet, driven by the rollout of 5G networks and rising demand for faster and more reliable data transmission. As modern digital infrastructure becomes essential for both businesses and households, fiber optic preforms play a pivotal role in enhancing network capacity and performance. These preforms are vital in creating fiber optic cables that enable seamless communication, cloud computing, and advanced technologies such as artificial intelligence (AI) and the Internet of Things (IoT).
Government initiatives and substantial investments in fiber infrastructure further accelerate market expansion, as countries worldwide focus on improving digital connectivity. Additionally, the proliferation of data centers, both hyperscale and edge-based, highlights the need for advanced fiber optic solutions to support the growing volume of data traffic. The increasing preference for high-capacity networks that can handle the surge in data-intensive applications, including video streaming, online gaming, and cloud services, further strengthens the market's upward trajectory.
| Market Scope | |
|---|---|
| Start Year | 2024 |
| Forecast Year | 2025-2034 |
| Start Value | $6.7 Billion |
| Forecast Value | $58.8 Billion |
| CAGR | 24.5% |
The market is segmented by product type into single-mode, multi-mode, and other categories. In 2024, the multi-mode segment held 41.4% of the market share. Multi-mode fibers are well-suited for short-distance communication, supporting advanced Ethernet technologies such as 100G, 400G, and 800G. Their cost-effectiveness in short-range applications, compared to single-mode fibers, makes them the preferred choice for businesses implementing Local Area Networks (LAN) and Storage Area Networks (SAN). Multi-mode fibers are also known for their ability to handle high data transmission rates efficiently over shorter distances, making them indispensable for enterprise networks.
By process, the fiber optic preform market is divided into Modified Chemical Vapor Deposition (MCVD), Vapor Phase Axial Deposition (VAD), Outside Vapor Deposition (OVD), and Plasma Activated Chemical Vapor Deposition (PCVD). The VAD process generated USD 2.1 billion in 2024. VAD is widely adopted in mass production environments due to its ability to produce long, continuous preforms with consistent quality. This method enables manufacturers to produce fiber optic cables in large quantities while maintaining high precision, meeting the increasing global demand for fiber optic solutions.
The U.S. fiber optic preform market generated USD 1.6 billion in 2024, reflecting the rising demand for high-capacity networks and increased investment in digital infrastructure. The rapid growth of cloud computing and AI has led to the expansion of data centers, creating a higher demand for reliable fiber optic solutions. Major telecommunications companies are investing heavily in fiber infrastructure to meet the growing need for faster and more reliable connectivity. As both consumers and businesses seek improved data transmission capabilities, fiber optic preforms remain an integral component in strengthening the country's digital infrastructure.
Table of Contents
Chapter 1 Methodology & Scope
- 1.1 Market scope & definitions
- 1.2 Base estimates & calculations
- 1.3 Forecast calculations
- 1.4 Data sources
- 1.4.1 Primary
- 1.4.2 Secondary
- 1.4.2.1 Paid sources
- 1.4.2.2 Public sources
Chapter 2 Executive Summary
- 2.1 Industry synopsis, 2021-2034
Chapter 3 Industry Insights
- 3.1 Industry ecosystem analysis
- 3.1.1 Factor affecting the value chain
- 3.1.2 Profit margin analysis
- 3.1.3 Disruptions
- 3.1.4 Future outlook
- 3.1.5 Manufacturers
- 3.1.6 Distributors
- 3.2 Supplier landscape
- 3.3 Profit margin analysis
- 3.4 Key news & initiatives
- 3.5 Regulatory landscape
- 3.6 Impact forces
- 3.6.1 Growth drivers
- 3.6.1.1 Rapid proliferation of 5G networks
- 3.6.1.2 Favorable government initiatives and investments
- 3.6.1.3 Increase in demand for high-speed internet
- 3.6.1.4 Growing deployment of submarine cable
- 3.6.1.5 Rise in advancements in fiber optic technology
- 3.6.2 Industry pitfalls & challenges
- 3.6.2.1 High production costs
- 3.6.2.2 Fluctuating raw material prices
- 3.6.1 Growth drivers
- 3.7 Growth potential analysis
- 3.8 Porter's analysis
- 3.9 PESTEL analysis
Chapter 4 Competitive Landscape, 2024
- 4.1 Introduction
- 4.2 Company market share analysis
- 4.3 Competitive positioning matrix
- 4.4 Strategic outlook matrix
Chapter 5 Market Estimates & Forecast, By Product Type, 2021-2034 (USD Billion)
- 5.1 Key trends
- 5.2 Single-Mode
- 5.3 Multi-Mode
- 5.4 Others
Chapter 6 Market Estimates & Forecast, By Process, 2021-2034 (USD Billion)
- 6.1 Key trends
- 6.2 Vapor Phase Axial Deposition (VAD)
- 6.3 Modified Chemical Vapor Deposition (MCVD)
- 6.4 Outside Vapor Deposition (OVD)
- 6.5 Plasma Activated Chemical Vapor Deposition (PCVD)
Chapter 7 Market Estimates & Forecast, By End Use Industry, 2021-2034 (USD Billion)
- 7.1 Key trends
- 7.2 Telecom
- 7.3 Oil & gas
- 7.4 Military & aerospace
- 7.5 BFSI
- 7.6 Medical
- 7.7 Railway
- 7.8 Others
Chapter 8 Market Estimates & Forecast, By Region, 2021-2034 (USD Billion)
- 8.1 Key trends
- 8.2 North America
- 8.2.1 U.S.
- 8.2.2 Canada
- 8.3 Europe
- 8.3.1 UK
- 8.3.2 Germany
- 8.3.3 France
- 8.3.4 Italy
- 8.3.5 Spain
- 8.3.6 Russia
- 8.4 Asia Pacific
- 8.4.1 China
- 8.4.2 India
- 8.4.3 Japan
- 8.4.4 South Korea
- 8.4.5 Australia
- 8.5 Latin America
- 8.5.1 Brazil
- 8.5.2 Mexico
- 8.6 MEA
- 8.6.1 South Africa
- 8.6.2 Saudi Arabia
- 8.6.3 UAE
Chapter 9 Company Profiles
- 9.1 Corning Incorporated
- 9.2 Fasten Group
- 9.3 FCJ OPTO TECH
- 9.4 Fujikura Ltd.
- 9.5 Futong Group
- 9.6 Hengtong Group
- 9.7 Heraeus Holding GmbH
- 9.8 Jiangsu Zhongtian Technology Co., Ltd.
- 9.9 OFS Fitel, LLC
- 9.10 Prysmian Group
- 9.11 Rosendahl Nextrom GmbH
- 9.12 Shin-Etsu Chemical Co., Ltd
- 9.13 Sterlite Technologies Limited
- 9.14 Sumitomo Electric Industries, Ltd
- 9.15 Yangtze Optical Fibre (YOFC)


