


 |
市場調查報告書
商品編碼
1716530
營養棒市場機會、成長動力、產業趨勢分析及 2025 - 2034 年預測Nutritional Bars Market Opportunity, Growth Drivers, Industry Trend Analysis, and Forecast 2025 - 2034 |
||||||
2024 年,全球營養棒市場規模達到 74 億美元,預計 2025 年至 2034 年期間的複合年成長率將達到 6.1%,這得益於對更健康、方便攜帶的零食選擇的需求激增。隨著人們越來越關注健身、健康和均衡的生活方式,消費者正在積極尋求既能提供功能性益處又不影響口味的方便點心。隨著全球健康意識的增強,人們開始將營養棒作為傳統高熱量零食和加工食品的理想替代品。人們對富含蛋白質、低糖、無麩質和有機產品的偏好日益增加,重新定義了消費者的期望,並鼓勵品牌推出符合不斷變化的飲食需求的創新產品。
現代消費者也密切關注成分透明度、永續性和道德採購,促使品牌採用可識別的天然成分的清潔標籤配方。此外,電子商務的日益普及,加上超市、便利商店和健身中心等場所產品的便利供應,持續推動營養棒的銷售。隨著城市人口生活節奏加快並重視整體健康,營養棒已成為尋求攜帶式營養的消費者的必需品,無論是運動前補充能量、代餐還是忙碌日程中的快餐。
| 市場範圍 | |
|---|---|
| 起始年份 | 2024 |
| 預測年份 | 2025-2034 |
| 起始值 | 74億美元 |
| 預測值 | 132億美元 |
| 複合年成長率 | 6.1% |
市場分為各種類型的營養棒,包括穀物/燕麥棒、蛋白質棒、能量棒/代餐棒、水果和堅果棒等。其中,穀物棒和燕麥棒佔據主導地位,因為它們作為健康、富含纖維且能提供持續能量的零食而廣受歡迎。隨著越來越多的消費者選擇對自己更有益的食物,對低糖、高蛋白和有機穀物和燕麥棒的需求正在成長。各大品牌紛紛推出富含益生菌、膠原蛋白和適應原等功能性成分的產品,以滿足人們對健康配方日益成長的興趣。尤其是蛋白質棒,越來越受到健身愛好者、運動員以及尋求肌肉恢復或體重管理支持的個人的需求。隨著消費者對食材的了解越來越深入,他們越來越傾向於選擇那些提供純淨營養、不含人工添加劑和防腐劑的能量棒。
市場也分為無麩質和傳統兩大類。由於廣泛的可及性和可負擔性,傳統酒吧目前佔據了 62.1% 的市場佔有率。然而,隨著人們對乳糜瀉、麩質不耐症和穀物替代品益處的認知不斷提高,無麩質營養棒正在迅速受到關注。製造商對此作出了回應,他們生產出含有藜麥、莧菜和蕎麥等營養豐富的穀物的能量棒,以吸引對麩質敏感的消費者和注重健康的消費者。然而,開發平衡口味、質地和成本效益的無麩質棒仍然是一個挑戰,迫使品牌投資研發。
美國營養棒市場佔全球佔有率的 28%,到 2024 年將達到 21 億美元,這得益於消費者對富含蛋白質和功能性食品的興趣日益濃厚。完善的健身文化,加上對有機、非基因改造和清潔標籤產品日益成長的需求,加強了美國市場的擴張。此外,政府提倡健康飲食的有利舉措,加上零售和電子商務平台的成長,支持了強勁的銷售。然而,激烈的競爭和高昂的生產成本仍然是品牌實現差異化和維持獲利能力所面臨的嚴峻挑戰。
目錄
第1章:方法論與範圍
第2章:執行摘要
第3章:行業洞察
- 產業生態系統分析
- 影響價值鏈的因素
- 利潤率分析
- 中斷
- 未來展望
- 製造商
- 經銷商
- 供應商格局
- 利潤率分析
- 重要新聞和舉措
- 監管格局
- 衝擊力
- 成長動力
- 產業陷阱與挑戰
- 成長潛力分析
- 波特的分析
- PESTEL分析
第4章:競爭格局
- 介紹
- 公司市佔率分析
- 競爭定位矩陣
- 戰略展望矩陣
第5章:市場估計與預測:按產品,2021 年至 2034 年
- 主要趨勢
- 穀物/格蘭諾拉麥片棒
- 蛋白質棒
- 能量棒/代餐棒
- 水果和堅果棒
- 其他(減肥棒、碳水化合物棒、耐力棒)
第6章:市場估計與預測:依類別,2021 年至 2034 年
- 主要趨勢
- 不含麩質
- 傳統的
第7章:市場估計與預測:按配銷通路,2021 年至 2034 年
- 主要趨勢
- 大賣場/超市
- 專賣店
- 網路零售
- 其他
第8章:市場估計與預測:按地區,2021 年至 2034 年
- 主要趨勢
- 北美洲
- 美國
- 加拿大
- 歐洲
- 德國
- 英國
- 法國
- 西班牙
- 義大利
- 俄羅斯
- 亞太地區
- 中國
- 印度
- 日本
- 澳洲
- 韓國
- 拉丁美洲
- 巴西
- 墨西哥
- 中東和非洲
- 沙烏地阿拉伯
- 南非
- 阿拉伯聯合大公國
第9章:公司簡介
- General Mills Inc
- Ajinomoto Co Inc
- Cargill Incorporated
- Mondelez International
- Glanbia Plc
- HEALTHY BARS
- ADM
- Global Nutrition International
- The Simply Good Foods Company
- The Kellogg Company.
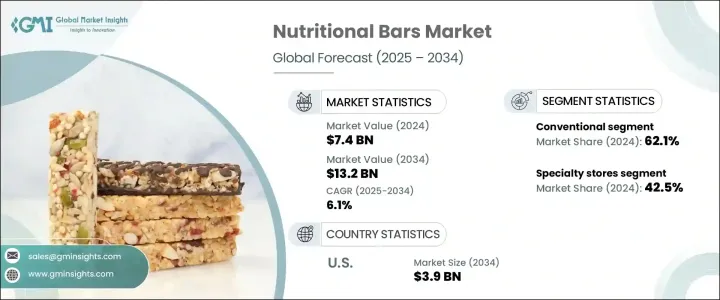
The Global Nutritional Bars Market reached USD 7.4 billion in 2024 and is projected to expand at a CAGR of 6.1% between 2025 and 2034, driven by the surging demand for healthier, on-the-go snacking options. With the rising focus on fitness, wellness, and balanced lifestyles, consumers are actively seeking convenient snacks that offer functional benefits without compromising on taste. As health awareness grows globally, people are turning to nutritional bars as an ideal alternative to traditional high-calorie snacks and processed foods. The increasing preference for protein-rich, low-sugar, gluten-free, and organic products has redefined consumer expectations, encouraging brands to deliver innovative products that align with evolving dietary needs.
Modern consumers are also paying close attention to ingredient transparency, sustainability, and ethical sourcing, prompting brands to adopt clean-label formulations with recognizable, natural ingredients. Moreover, the growing penetration of e-commerce, coupled with easy product availability in supermarkets, convenience stores, and fitness centers, continues to fuel sales of nutritional bars. As urban populations adopt fast-paced routines and prioritize holistic health, nutritional bars have emerged as a staple for consumers seeking portable nutrition, whether for pre-workout energy, meal replacement, or quick snacks during busy schedules.
| Market Scope | |
|---|---|
| Start Year | 2024 |
| Forecast Year | 2025-2034 |
| Start Value | $7.4 Billion |
| Forecast Value | $13.2 Billion |
| CAGR | 6.1% |
The market is segmented into various types of nutritional bars, including cereal/granola bars, protein bars, energy bars/meal replacement bars, fruit and nut bars, and others. Among these, cereal and granola bars dominate due to their widespread appeal as wholesome, fiber-rich snacks that provide sustained energy. As more consumers opt for better-for-you options, demand for low-sugar, high-protein, and organic variants of cereal and granola bars is gaining momentum. Brands are launching products enriched with functional ingredients like probiotics, collagen, and adaptogens to meet the rising interest in health-boosting formulations. Protein bars, in particular, are seeing heightened demand from fitness enthusiasts, athletes, and individuals seeking muscle recovery or weight management support. With consumers becoming increasingly ingredient-savvy, there is a strong preference for bars that offer clean nutrition, free from artificial additives and preservatives.
The market is also categorized into gluten-free and conventional segments. Conventional bars currently command a significant 62.1% market share, driven by broad accessibility and affordability. However, gluten-free nutritional bars are rapidly gaining traction as awareness about celiac disease, gluten intolerance, and the benefits of grain alternatives rises. Manufacturers are responding by formulating bars with nutrient-dense grains such as quinoa, amaranth, and buckwheat, which appeal to both gluten-sensitive and general health-conscious consumers. Yet, the development of gluten-free bars that balance taste, texture, and cost-effectiveness continues to be a challenge, pushing brands to invest in R&D.
U.S. Nutritional Bars Market accounted for 28% of the global share, generating USD 2.1 billion in 2024, propelled by growing consumer interest in protein-enriched and functional foods. A well-established fitness culture, coupled with heightened demand for organic, non-GMO, and clean-label products, reinforces market expansion in the U.S. Moreover, favorable government initiatives promoting healthy eating, combined with the growth of retail and e-commerce platforms, support robust sales. Nevertheless, fierce competition and high production costs remain critical challenges for brands aiming to differentiate and sustain profitability.
Table of Contents
Chapter 1 Methodology & Scope
- 1.1 Market scope & definition
- 1.2 Base estimates & calculations
- 1.3 Forecast calculation
- 1.4 Data sources
- 1.4.1 Primary
- 1.4.2 Secondary
- 1.4.2.1 Paid sources
- 1.4.2.2 Public sources
- 1.5 Primary research and validation
- 1.5.1 Primary sources
- 1.5.2 Data mining sources
Chapter 2 Executive Summary
- 2.1 Industry synopsis, 2021-2034
Chapter 3 Industry Insights
- 3.1 Industry ecosystem analysis
- 3.1.1 Factor affecting the value chain
- 3.1.2 Profit margin analysis
- 3.1.3 Disruptions
- 3.1.4 Future outlook
- 3.1.5 Manufacturers
- 3.1.6 Distributors
- 3.2 Supplier landscape
- 3.3 Profit margin analysis
- 3.4 Key news & initiatives
- 3.5 Regulatory landscape
- 3.6 Impact forces
- 3.6.1 Growth drivers
- 3.6.2 Industry pitfalls & challenges
- 3.7 Growth potential analysis
- 3.8 Porter's analysis
- 3.9 PESTEL analysis
Chapter 4 Competitive Landscape, 2024
- 4.1 Introduction
- 4.2 Company market share analysis
- 4.3 Competitive positioning matrix
- 4.4 Strategic outlook matrix
Chapter 5 Market Estimates and Forecast, By Product, 2021 – 2034 (USD Billion) (Kilo Tons)
- 5.1 Key trends
- 5.2 Cereal/Granola bars
- 5.3 Protein bars
- 5.4 Energy Bars/ Meal replacements bars
- 5.5 Fruits & nuts bars
- 5.6 Others (Diet Bars, Carbohydrate Bars, Endurance bars)
Chapter 6 Market Estimates and Forecast, By Category, 2021 – 2034 (USD Billion) (Kilo Tons)
- 6.1 Key trends
- 6.2 Gluten-free
- 6.3 Conventional
Chapter 7 Market Estimates and Forecast, By Distribution Channel, 2021 – 2034 (USD Billion) (Kilo Tons)
- 7.1 Key trends
- 7.2 Hypermarkets/Supermarkets
- 7.3 Specialty stores
- 7.4 Online retail
- 7.5 Others
Chapter 8 Market Estimates and Forecast, By Region, 2021 – 2034 (USD Billion) (Kilo Tons)
- 8.1 Key trends
- 8.2 North America
- 8.2.1 U.S.
- 8.2.2 Canada
- 8.3 Europe
- 8.3.1 Germany
- 8.3.2 UK
- 8.3.3 France
- 8.3.4 Spain
- 8.3.5 Italy
- 8.3.6 Russia
- 8.4 Asia Pacific
- 8.4.1 China
- 8.4.2 India
- 8.4.3 Japan
- 8.4.4 Australia
- 8.4.5 South Korea
- 8.5 Latin America
- 8.5.1 Brazil
- 8.5.2 Mexico
- 8.6 Middle East and Africa
- 8.6.1 Saudi Arabia
- 8.6.2 South Africa
- 8.6.3 UAE
Chapter 9 Company Profiles
- 9.1 General Mills Inc
- 9.2 Ajinomoto Co Inc
- 9.3 Cargill Incorporated
- 9.4 Mondelez International
- 9.5 Glanbia Plc
- 9.6 HEALTHY BARS
- 9.7 ADM
- 9.8 Global Nutrition International
- 9.9 The Simply Good Foods Company
- 9.10 The Kellogg Company.

