


 |
市場調查報告書
商品編碼
1699369
翻新電腦及筆記型電腦市場機會、成長動力、產業趨勢分析及 2025-2034 年預測Refurbished Computers and Laptops Market Opportunity, Growth Drivers, Industry Trend Analysis, and Forecast 2025-2034 |
||||||
2024 年全球翻新電腦和筆記型電腦市場規模達到 54 億美元,預計 2025 年至 2034 年的複合年成長率為 5.9%。隨著消費者和企業尋求減少電子垃圾的方法,對環境永續性的日益關注是一個主要驅動力。人們越來越重視具有成本效益的技術解決方案,這也刺激了需求,翻新設備可以以極低的價格提供高性能。越來越多的公司和機構選擇翻新電腦和筆記型電腦來降低成本並保持效率。改進的翻新技術和品質檢查進一步增強了消費者的信任,使這些產品成為新設備的可行替代品。
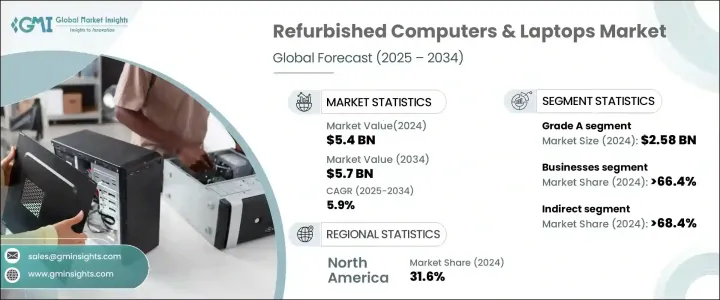
2024 年,甲級辦公室市場營收為 25.8 億美元,預計複合年成長率為 6.1%。這些設備使用頻率很低,並經過嚴格的品質檢查,以確保其功能與新品一樣,因此在注重預算的買家中非常受歡迎。 A 級產品的吸引力在於其磨損極小,使其成為全新電腦的經濟高效且可靠的替代品。尋求高性能且價格不菲的設備的企業和專業人士更青睞 A 級設備,從而推動了該領域穩定的需求。配備更新軟體和延長保固期的高品質翻新筆記型電腦和桌上型電腦的上市進一步增強了消費者信心。
| 市場範圍 | |
|---|---|
| 起始年份 | 2024 |
| 預測年份 | 2025-2034 |
| 起始值 | 54億美元 |
| 預測值 | 57億美元 |
| 複合年成長率 | 5.9% |
間接分銷管道部分在 2024 年佔據 68.4% 的佔有率,預計到 2034 年將成長 5.8%。線上平台和第三方零售商讓消費者更容易獲得經過認證的翻新電腦和筆記型電腦,提供便利和有競爭力的價格。這些平台透過提供保固、退貨選項和品質認證來確保產品符合高標準。許多企業、教育機構和政府機構喜歡從批發商和零售商處購買,因為大量訂單有折扣且可靠。間接賣家的營運成本降低意味著更好的定價和促銷優惠,從而使翻新設備對買家更具吸引力。
北美翻新電腦和筆記型電腦市場佔有 31.6% 的佔有率,2024 年創造了 17 億美元的產值。消費者意識的提高和對經濟高效的 IT 解決方案的需求不斷成長推動了該地區市場的成長。企業、學校和個人消費者認知到翻新電子產品的價值,從而促進了其廣泛應用。強大的分銷網路和值得信賴的線上平台使買家可以輕鬆找到高品質、經過認證的翻新設備。隨著人們越來越關注永續性和可負擔性,北美仍然是翻新電腦和筆記型電腦的主要市場。
目錄
第1章:方法論與範圍
- 研究設計
- 研究方法
- 資料收集方法
- 基礎估算與計算
- 基準年計算
- 市場估計的主要趨勢
- 預測模型
- 初步研究與驗證
- 主要來源
- 資料探勘來源
- 市場定義
第2章:執行摘要
第3章:行業洞察
- 產業生態系統分析
- 供應商概況
- 定價分析
- 技術與創新格局
- 重要新聞和舉措
- 監管格局
- 製造商
- 經銷商
- 零售商
- 衝擊力
- 成長動力
- 永續性和環保意識
- 新興市場需求不斷成長
- 產業陷阱與挑戰
- 對品質和可靠性的認知
- 供應鏈挑戰
- 成長動力
- 成長潛力分析
- 消費者購買行為
- 波特的分析
- PESTEL分析
第4章:競爭格局
- 介紹
- 公司市佔率分析
- 競爭定位矩陣
- 戰略展望矩陣
第5章:市場估計與預測:依等級,2021 年至 2034 年(十億美元)
- 主要趨勢
- A級
- B級
- C 級
- D級
第6章:市場估計與預測:按作業系統,2021 - 2034 年(十億美元)
- 主要趨勢
- Windows 翻新電腦和筆記型電腦
- Mac 翻新電腦和筆記型電腦
第7章:市場估計與預測:按螢幕尺寸,2021 - 2034 年(十億美元)
- 主要趨勢
- 11-13英寸
- 14-16英寸
- 17吋以上
第8章:市場估計與預測:按最終用途,2021 - 2034 年(十億美元)
- 主要趨勢
- 個人消費者
- 企業
- 其他
第9章:市場估計與預測:按配銷通路,2021 - 2034 年(十億美元)
- 主要趨勢
- 直接的
- 間接
第10章:市場估計與預測:按地區,2021 - 2034 年(十億美元)
- 主要趨勢
- 北美洲
- 美國
- 加拿大
- 歐洲
- 英國
- 德國
- 法國
- 義大利
- 西班牙
- 俄羅斯
- 亞太地區
- 中國
- 印度
- 日本
- 澳洲
- 韓國
- 拉丁美洲
- 巴西
- 墨西哥
- 阿根廷
- MEA
- 阿拉伯聯合大公國
- 南非
- 沙烏地阿拉伯
第 11 章:公司簡介
- Acer
- Amazon Renewed
- Apple
- Arrow Direct
- ASUS
- Back Market
- Best Buy
- Blair Tech
- Dell
- Gazelle
- HP
- Lenovo
- Microsoft
- Samsung
The Global Refurbished Computers and Laptops Market reached USD 5.4 billion in 2024 and is expected to exhibit a CAGR of 5.9% from 2025 to 2034. Rising concerns about environmental sustainability are a major driver as consumers and businesses look for ways to reduce electronic waste. The growing emphasis on cost-effective technology solutions has also fueled demand, with refurbished devices offering high performance at a fraction of the price. Companies and institutions are increasingly opting for refurbished computers and laptops to cut costs while maintaining efficiency. Improved refurbishment techniques and quality checks have further strengthened consumer trust, making these products a viable alternative to new devices.
The Grade A segment generated USD 2.58 billion in 2024 and is anticipated to grow at a CAGR of 6.1%. These devices are lightly used and undergo rigorous quality checks to ensure they function like new, making them highly desirable among budget-conscious buyers. The appeal of Grade A products lies in their minimal wear and tear, making them a cost-effective yet reliable alternative to brand-new computers. Businesses and professionals seeking high-performance devices without the premium price tag prefer Grade A options, driving steady demand in this segment. The availability of high-quality refurbished laptops and desktops with updated software and extended warranties further strengthens consumer confidence.
| Market Scope | |
|---|---|
| Start Year | 2024 |
| Forecast Year | 2025-2034 |
| Start Value | $5.4 Billion |
| Forecast Value | $5.7 Billion |
| CAGR | 5.9% |
Indirect distribution channels segment held a 68.4% share in 2024, with expected growth of 5.8% through 2034. Online platforms and third-party retailers have made it easier for consumers to access certified refurbished computers and laptops, offering convenience and competitive pricing. These platforms ensure that products meet high standards by providing warranties, return options, and quality certifications. Many businesses, educational institutions, and government agencies prefer purchasing from wholesalers and retailers due to bulk order discounts and reliability. Lower operational costs for indirect sellers translate to better pricing and promotional offers, making refurbished devices more attractive to buyers.
North America Refurbished Computers & Laptops Market held a 31.6% share and generated USD 1.7 billion in 2024. High consumer awareness and increasing demand for cost-efficient IT solutions drive market growth in the region. Businesses, schools, and individual consumers recognize the value of refurbished electronics, contributing to their widespread adoption. Strong distribution networks and trusted online platforms make it easy for buyers to find high-quality, certified refurbished devices. With a growing focus on sustainability and affordability, North America remains a key market for refurbished computers and laptops.
Table of Contents
Chapter 1 Methodology & Scope
- 1.1 Research design
- 1.1.1 Research Approach
- 1.1.2 Data collection methods
- 1.2 Base estimates and calculations
- 1.2.1 Base year calculation
- 1.2.2 Key trends for market estimates
- 1.3 Forecast model
- 1.4 Primary research & validation
- 1.4.1 Primary sources
- 1.4.2 Data mining sources
- 1.5 Market definitions
Chapter 2 Executive Summary
- 2.1 Industry synopsis, 2021 - 2034
Chapter 3 Industry Insights
- 3.1 Industry ecosystem analysis
- 3.2 Supplier Landscape
- 3.3 Pricing analysis
- 3.4 Technology & innovation landscape
- 3.5 Key news & initiatives
- 3.6 Regulatory landscape
- 3.7 Manufacturers
- 3.8 Distributors
- 3.9 Retailers
- 3.10 Impact forces
- 3.10.1 Growth drivers
- 3.10.1.1 Sustainability and environmental awareness
- 3.10.1.2 Growing demand from emerging markets
- 3.10.2 Industry pitfalls & challenges
- 3.10.2.1 Perception of quality and reliability
- 3.10.2.2 Supply chain challenges
- 3.10.1 Growth drivers
- 3.11 Growth potential analysis
- 3.12 Consumer buying behavior
- 3.13 Porter's analysis
- 3.14 PESTEL analysis
Chapter 4 Competitive Landscape, 2024
- 4.1 Introduction
- 4.2 Company market share analysis
- 4.3 Competitive positioning matrix
- 4.4 Strategic outlook matrix
Chapter 5 Market Estimates & Forecast, By Grade, 2021 - 2034 ($Bn) (Thousand Units)
- 5.1 Key trends
- 5.2 Grade A
- 5.3 Grade B
- 5.4 Grade C
- 5.5 Grade D
Chapter 6 Market Estimates & Forecast, By Operating System, 2021 - 2034 ($Bn) (Thousand Units)
- 6.1 Key trends
- 6.2 Windows refurbished computers & laptops
- 6.3 Mac refurbished computers & laptops
Chapter 7 Market Estimates & Forecast, By Screen Size, 2021 - 2034 ($Bn) (Thousand Units)
- 7.1 Key trends
- 7.2 11-13 inches
- 7.3 14-16 inches
- 7.4 17 inches and above
Chapter 8 Market Estimates & Forecast, By End Use, 2021 - 2034 ($Bn) (Thousand Units)
- 8.1 Key trends
- 8.2 Individual consumers
- 8.3 Businesses
- 8.4 Others
Chapter 9 Market Estimates & Forecast, By Distribution Channel, 2021 - 2034 ($Bn) (Thousand Units)
- 9.1 Key trends
- 9.2 Direct
- 9.3 Indirect
Chapter 10 Market Estimates & Forecast, By Region, 2021 - 2034 ($Bn) (Thousand Units)
- 10.1 Key trends
- 10.2 North America
- 10.2.1 U.S.
- 10.2.2 Canada
- 10.3 Europe
- 10.3.1 UK
- 10.3.2 Germany
- 10.3.3 France
- 10.3.4 Italy
- 10.3.5 Spain
- 10.3.6 Russia
- 10.4 Asia Pacific
- 10.4.1 China
- 10.4.2 India
- 10.4.3 Japan
- 10.4.4 Australia
- 10.4.5 South Korea
- 10.5 Latin America
- 10.5.1 Brazil
- 10.5.2 Mexico
- 10.5.3 Argentina
- 10.6 MEA
- 10.6.1 UAE
- 10.6.2 South Africa
- 10.6.3 Saudi Arabia
Chapter 11 Company Profiles
- 11.1 Acer
- 11.2 Amazon Renewed
- 11.3 Apple
- 11.4 Arrow Direct
- 11.5 ASUS
- 11.6 Back Market
- 11.7 Best Buy
- 11.8 Blair Tech
- 11.9 Dell
- 11.10 Gazelle
- 11.11 HP
- 11.12 Lenovo
- 11.13 Microsoft
- 11.14 Samsung


