

 |
市場調查報告書
商品編碼
1699365
文具產品市場機會、成長動力、產業趨勢分析及2025-2034年預測Stationery Products Market Opportunity, Growth Drivers, Industry Trend Analysis, and Forecast 2025-2034 |
||||||
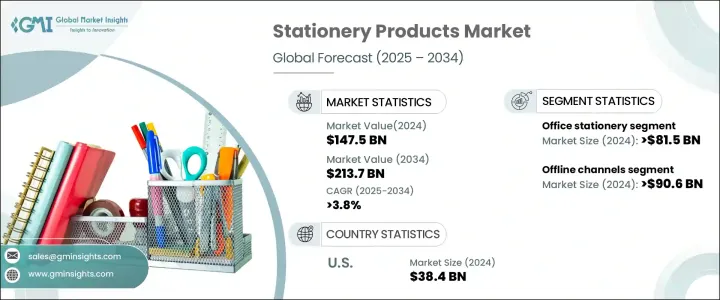
2024 年全球文具產品市場規模達到 1,475 億美元,預估 2025 年至 2034 年的複合年成長率為 3.8%。全球對教育的日益重視,加上識字率的提高,正在推動對文具產品的需求。越來越多的年輕人報名參加高等教育課程,增加了對書寫工具、筆記本和組織用品的需求。此外,隨著經濟的增強,可支配收入的增加,鼓勵消費者投資高階文具產品,包括豪華鋼筆和高品質辦公室必需品。
創業熱情的激增和新創企業數量的不斷增加也推動了市場擴張。企業需要必備的辦公用品來提高生產力,而混合工作模式導致對家庭辦公文具的需求增加。數位工具與傳統文具(如智慧型筆記本和支援手寫筆的書寫工具)的融合正在進一步塑造市場。隨著消費者和企業越來越重視環境責任,永續和環保的文具產品也越來越受歡迎。製造商正在推出可生物分解的筆、再生紙產品和可重複使用的筆記本,以符合全球永續發展目標。
| 市場範圍 | |
|---|---|
| 起始年份 | 2024 |
| 預測年份 | 2025-2034 |
| 起始值 | 1475億美元 |
| 預測值 | 2137億美元 |
| 複合年成長率 | 3.8% |
文具市場分為各種產品類別,包括鋼筆、鉛筆、記號筆和螢光筆等書寫工具,以及橡皮擦、削鉛筆機和筆芯。 2024年,辦公文具將引領市場,創造815億美元的產值。企業繼續依賴訂書機、迴紋針、剪刀、尺、打孔機和郵票等辦公必需品來支援日常營運。另一個重要領域是美術用品,包括顏料、畫筆、畫布和素描本,可滿足專業人士和業餘愛好者的需求。隨著企業和教育機構的擴張,對這些必需產品的需求仍然強勁。
按應用進行市場細分,辦公領域佔據主導地位,2024 年該領域佔據 45.7% 的市場佔有率。業務的持續擴張和企業界對效率的關注確保了對辦公用品的需求保持強勁。公司正在投資高品質的文具來最佳化工作流程並加強工作場所的組織。受學生入學人數增加和創意學習工具採用率增加的推動,學校和家庭部門也對市場成長做出了重大貢獻。
2024 年美國文具產品市場規模達 384 億美元,預估預測期內複合年成長率為 3.6%。推動該地區成長的因素包括不斷擴大的教育計劃、不斷增加的國內外學生獎學金數量以及強勁的企業格局。隨著商業的蓬勃發展和教育產業的穩定招生,美國對文具產品的需求持續高漲。
目錄
第1章:方法論與範圍
- 市場範圍和定義
- 基礎估算與計算
- 預測參數
- 資料來源
- 基本的
- 次要
- 付費來源
- 公共資源
第2章:執行摘要
第3章:行業洞察
- 產業生態系統分析
- 技術與創新格局
- 重要新聞和舉措
- 監管格局
- 衝擊力
- 成長動力
- 識字率不斷提高
- 農村地區學校和學院數量的增加
- 藝術學校數量不斷增加
- 透過電子商務提高產品銷售
- 產業陷阱與挑戰
- 學校和學院的快速數位化
- 成長動力
- 消費者購買行為分析
- 成長潛力分析
- 波特的分析
- PESTEL分析
第4章:競爭格局
- 介紹
- 公司市佔率分析
- 競爭定位矩陣
- 戰略展望矩陣
第5章:市場估計與預測:依產品類型,2018 – 2034 年
- 主要趨勢
- 書寫工具
- 鋼筆
- 鉛筆
- 標記
- 螢光筆
- 橡皮擦
- 其他(削鉛筆機、替換筆芯等)
- 辦公文具
- 訂書機
- 迴紋針
- 剪刀
- 統治者
- 打孔器
- 郵票
- 其他(印台、圖釘等)
- 美術用品
- 油漆
- 刷子
- 帆布
- 粉彩
- 木炭
- 黏土
- 其他(繪圖板、素描本等)
- 文件
- 其他(膠帶、膠水等)
第6章:市場估計與預測:按應用,2018 – 2034
- 主要趨勢
- 學校
- 辦公室
- 家
第7章:市場估計與預測:按價格,2018 年至 2034 年
- 主要趨勢
- 低的
- 中等的
- 高的
第8章:市場估計與預測:按配銷通路,2018 – 2034 年
- 主要趨勢
- 線上通路
- 線下通路
第9章:市場估計與預測:按地區,2018 – 2034
- 主要趨勢
- 北美洲
- 美國
- 加拿大
- 歐洲
- 德國
- 英國
- 法國
- 義大利
- 西班牙
- 歐洲其他地區
- 亞太地區
- 中國
- 印度
- 日本
- 韓國
- 澳洲
- 馬來西亞
- 印尼
- 亞太其他地區
- 拉丁美洲
- 巴西
- 墨西哥
- 拉丁美洲其他地區
- MEA
- 沙烏地阿拉伯
- 阿拉伯聯合大公國
- 南非
- MEA 其餘地區
第10章:公司簡介
- 3M
- Artline
- BIC
- Faber-Castell
- Fullmark
- Kokuyo Camlin
- Linc Pens & Plastics Ltd.
- Maped
- Mead
- Pilot Corporation
The Global Stationery Products Market reached USD 147.5 billion in 2024 and is projected to grow at a CAGR of 3.8% from 2025 to 2034. The increasing emphasis on education worldwide, coupled with rising literacy rates, is driving demand for stationery products. More young individuals are enrolling in higher education programs, boosting the need for writing instruments, notebooks, and organizational supplies. Additionally, as economies strengthen, disposable incomes rise, encouraging consumers to invest in premium stationery products, including luxury pens and high-quality office essentials.
Market expansion is also being fueled by the surge in entrepreneurship and the growing number of startups. Businesses require essential office supplies to enhance productivity, while hybrid work models have led to increased demand for home office stationery. The integration of digital tools with traditional stationery, such as smart notebooks and stylus-enabled writing instruments, is further shaping the market. Sustainable and eco-friendly stationery products are also gaining traction as consumers and corporations prioritize environmental responsibility. Manufacturers are responding with biodegradable pens, recycled paper products, and reusable notebooks, aligning with global sustainability goals.
| Market Scope | |
|---|---|
| Start Year | 2024 |
| Forecast Year | 2025-2034 |
| Start Value | $147.5 Billion |
| Forecast Value | $213.7 Billion |
| CAGR | 3.8% |
The stationery market is divided into various product categories, including writing instruments such as pens, pencils, markers, and highlighters, along with erasers, sharpeners, and refills. In 2024, office stationery led the market, generating USD 81.5 billion. Businesses continue to rely on office essentials like staplers, paper clips, scissors, rulers, hole punchers, and stamps to support daily operations. Art supplies, another significant segment, include paints, brushes, canvases, and sketchbooks, catering to both professionals and hobbyists. As businesses and educational institutions expand, demand for these essential products remains strong.
Market segmentation by application highlights the dominance of the office sector, which accounted for a 45.7% market share in 2024. The continued expansion of businesses and the corporate world's focus on efficiency ensure that demand for office supplies stays robust. Companies are investing in high-quality stationery to optimize workflow and enhance workplace organization. The school and home segments also contribute significantly to market growth, driven by rising student enrollments and the increasing adoption of creative learning tools.
The U.S. Stationery Products Market generated USD 38.4 billion in 2024 and is projected to grow at a CAGR of 3.6% during the forecast period. Growth in this region is being driven by expanding educational initiatives, an increasing number of scholarships for both domestic and international students, and a strong corporate landscape. As businesses continue to flourish and the education sector sees steady enrollment, demand for stationery products in the U.S. remains consistently high.
Table of Contents
Chapter 1 Methodology & Scope
- 1.1 Market scope & definition
- 1.2 Base estimates & calculations
- 1.3 Forecast parameters
- 1.4 Data sources
- 1.4.1 Primary
- 1.4.2 Secondary
- 1.4.2.1 Paid sources
- 1.4.2.2 Public sources
Chapter 2 Executive Summary
- 2.1 Industry 3600 synopsis, 2018 - 2034
Chapter 3 Industry Insights
- 3.1 Industry ecosystem analysis
- 3.2 Technology & innovation landscape
- 3.3 Key news and initiatives
- 3.4 Regulatory landscape
- 3.5 Impact forces
- 3.5.1 Growth drivers
- 3.5.1.1 Growing literacy rates
- 3.5.1.2 Increase in number of schools and colleges in rural areas
- 3.5.1.3 Rising number of art schools
- 3.5.1.4 Rising product sales through E-commerce
- 3.5.2 Industry pitfalls & challenges
- 3.5.2.1 Rapid digitalization in schools and colleges
- 3.5.1 Growth drivers
- 3.6 Consumer buying behavior analysis
- 3.7 Growth potential analysis
- 3.8 Porter's analysis
- 3.8.1 Supplier power
- 3.8.2 Buyer power
- 3.8.3 Threat of new entrants
- 3.8.4 Threat of substitutes
- 3.8.5 Industry rivalry
- 3.9 PESTEL analysis
Chapter 4 Competitive Landscape, 2024
- 4.1 Introduction
- 4.2 Company market share analysis
- 4.3 Competitive positioning matrix
- 4.4 Strategic outlook matrix
Chapter 5 Market Estimates & Forecast, By Product Type, 2018 – 2034, (USD Million) (Thousand Units)
- 5.1 Key trends
- 5.2 Writing Instruments
- 5.2.1 Pens
- 5.2.2 Pencils
- 5.2.3 Markers
- 5.2.4 Highlighters
- 5.2.5 Erasers
- 5.2.6 Others (Sharpeners, refills, etc.)
- 5.3 Office Stationery
- 5.3.1 Staplers
- 5.3.2 Paper clip
- 5.3.3 Scissors
- 5.3.4 Rulers
- 5.3.5 Hole punchers
- 5.3.6 Stamps
- 5.3.7 Others (Ink pads, Pushpins etc.)
- 5.4 Art Supplies
- 5.4.1 Paints
- 5.4.2 Brushes
- 5.4.3 Canvas
- 5.4.4 Pastels
- 5.4.5 Charcoal
- 5.4.6 Clay
- 5.4.7 Other (drawing pads, sketchbooks, etc.)
- 5.5 Files
- 5.6 Others (tape, glue, etc.)
Chapter 6 Market Estimates & Forecast, By Application, 2018 – 2034, (USD Million) (Thousand Units)
- 6.1 Key trends
- 6.2 School
- 6.3 Office
- 6.4 Home
Chapter 7 Market Estimates & Forecast, By Price, 2018 – 2034, (USD Million) (Thousand Units)
- 7.1 Key trends
- 7.2 Low
- 7.3 Medium
- 7.4 High
Chapter 8 Market Estimates & Forecast, By Distribution Channel, 2018 – 2034, (USD Million) (Thousand Units)
- 8.1 Key trends
- 8.2 Online channels
- 8.3 Offline channels
Chapter 9 Market Estimates & Forecast, By Region, 2018 – 2034, (USD Million) (Thousand Units)
- 9.1 Key trends
- 9.2 North America
- 9.2.1 U.S.
- 9.2.2 Canada
- 9.3 Europe
- 9.3.1 Germany
- 9.3.2 UK
- 9.3.3 France
- 9.3.4 Italy
- 9.3.5 Spain
- 9.3.6 Rest of Europe
- 9.4 Asia Pacific
- 9.4.1 China
- 9.4.2 India
- 9.4.3 Japan
- 9.4.4 South Korea
- 9.4.5 Australia
- 9.4.6 Malaysia
- 9.4.7 Indonesia
- 9.4.8 Rest of Asia Pacific
- 9.5 Latin America
- 9.5.1 Brazil
- 9.5.2 Mexico
- 9.5.3 Rest of Latin America
- 9.6 MEA
- 9.6.1 Saudi Arabia
- 9.6.2 UAE
- 9.6.3 South Africa
- 9.6.4 Rest of MEA
Chapter 10 Company Profiles
- 10.1 3M
- 10.2 Artline
- 10.3 BIC
- 10.4 Faber-Castell
- 10.5 Fullmark
- 10.6 Kokuyo Camlin
- 10.7 Linc Pens & Plastics Ltd.
- 10.8 Maped
- 10.9 Mead
- 10.10 Pilot Corporation
 計算器市場:2026-2032年全球市場預測(依產品類型、操作方式、顯示技術、最終用戶和通路分類)辦公用品及耗材市場:2026-2032年全球市場預測(依產品類型、材料類型、通路和最終用戶分類)文具市場:2026-2032年全球市場預測(依產品類型、材料成分、年齡層、最終用戶及通路分類)可水洗馬克筆市場:按類型、應用、最終用戶和分銷管道分類-2026-2032年全球市場預測
 客製化活頁夾市場分析及預測(至2035年):類型、產品類型、材質、應用、最終用戶、技術、組件、功能、製程和解決方案
 全球文具產品市場規模、佔有率、趨勢及成長分析報告(2026-2034)
 文具產品市場-全球產業規模、佔有率、趨勢、機會、預測:依產品類型、最終用戶、銷售管道、地區和競爭格局分類,2021-2031年書擋市場-全球產業規模、佔有率、趨勢、機會和預測:按材料類型、最終用戶、分銷管道、地區和競爭格局分類,2021-2031年蠟筆市場 - 全球產業規模、佔有率、趨勢、機會、預測:按類型、應用、銷售管道、地區和競爭格局分類,2021-2031年無毒可水洗馬克筆市場:按筆尖類型、包裝、應用、最終用戶、通路和顏色類別分類 - 全球預測(2026-2032 年)