


 |
市場調查報告書
商品編碼
1699323
石油和天然氣基礎設施市場機會、成長動力、產業趨勢分析及 2025-2034 年預測Oil and Gas Infrastructure Market Opportunity, Growth Drivers, Industry Trend Analysis, and Forecast 2025-2034 |
||||||
2024 年全球石油和天然氣基礎設施市場規模達到 7,611 億美元,預計 2025 年至 2034 年的複合年成長率為 6.8%。石油和天然氣需求的不斷成長,尤其是新興經濟體的需求,加上大型基礎設施項目投資的激增,將推動產業擴張。隨著能源產業的快速轉型,各國正投入大量資源來加強基礎建設和提高營運效率。能源消耗的增加,加上技術的進步,正在加速高效率運輸、儲存和加工設施的發展。
該行業分為幾個部分,包括地面和租賃設備、收集和加工、管道、儲存、精煉和運輸以及出口終端。受探勘和生產活動擴張的推動,預計到 2034 年,地面和租賃設備的複合年成長率將達到 6.5%。緻密氣和頁岩氣開採等非常規鑽井技術的日益普及,進一步刺激了對支援作業的先進設備的需求。隨著能源生產商尋求提高效率和最佳化生產,對地面基礎設施的投資仍然至關重要。
| 市場範圍 | |
|---|---|
| 起始年份 | 2024 |
| 預測年份 | 2025-2034 |
| 起始值 | 7611億美元 |
| 預測值 | 1.46兆美元 |
| 複合年成長率 | 6.8% |
到 2024 年,石油和天然氣儲存行業的佔有率將達到 3.5%,由於向天然氣為基礎的經濟轉變和全球貿易的不斷擴大,需求將不斷增加。對大規模儲存解決方案日益成長的需求源於石化和煉油活動的加強,這些活動需要大量容量來容納原油、原料和精煉石油產品,包括航空燃料、柴油和汽油。推動供應靈活性和增強儲存基礎設施正在促進市場成長,確保穩定的能源供應以滿足波動的需求。
2024 年美國石油和天然氣基礎設施市場價值為 804 億美元,預計到 2034 年將達到 1,500 億美元。對能源基礎設施的策略性投資正在加強國家能源安全,最大限度地減少供應鏈漏洞,並確保燃料分配不間斷。該國正致力於液化工廠和煉油終端的現代化和擴建,加速業界採用尖端技術。管道網路、儲存擴建和先進煉油設施的資本支出增加正在促進產業成長,使美國能夠保持其在石油和天然氣基礎設施領域的主導地位。
目錄
第1章:方法論與範圍
- 市場範圍和定義
- 市場估計和預測參數
- 預測計算
- 資料來源
- 基本的
- 次要
- 有薪資的
- 民眾
第2章:執行摘要
第3章:行業洞察
- 產業生態系統分析
- 監管格局
- 產業衝擊力
- 成長動力
- 產業陷阱與挑戰
- 成長潛力分析
- 波特的分析
- PESTEL分析
第4章:競爭格局
- 介紹
- 戰略展望
- 創新與永續發展格局
第5章:市場規模及預測:依類別,2021 年至 2034 年
- 主要趨勢
- 地面和租賃設備
- 收集和加工
- 石油、天然氣和天然氣凝析液管道
- 石油和天然氣儲存
- 煉油及石油產品運輸
- 出口碼頭
第6章:市場規模及預測:依地區,2021 年至 2034 年
- 主要趨勢
- 北美洲
- 美國
- 加拿大
- 歐洲
- 挪威
- 英國
- 法國
- 義大利
- 俄羅斯
- 亞太地區
- 中國
- 印度
- 日本
- 韓國
- 澳洲
- 中東和非洲
- 沙烏地阿拉伯
- 卡達
- 奈及利亞
- 阿拉伯聯合大公國
- 阿曼
- 埃及
- 拉丁美洲
- 巴西
- 阿根廷
- 墨西哥
第7章:公司簡介
- Baker Hughes Company
- BP
- Centrica
- Chevron Corporation
- ConocoPhillips
- Energy Transfer
- Enterprise Products Partners
- Exxon Mobil Corporation
- Hatch
- Halliburton
- Kinder Morgan
- Marathon Oil Company
- NGL Energy Partners
- Occidental Petroleum Corporation
- ONEOK
- Royal Vopak
- SLB
- Shell
- TotalEnergies
- WILLIAMS
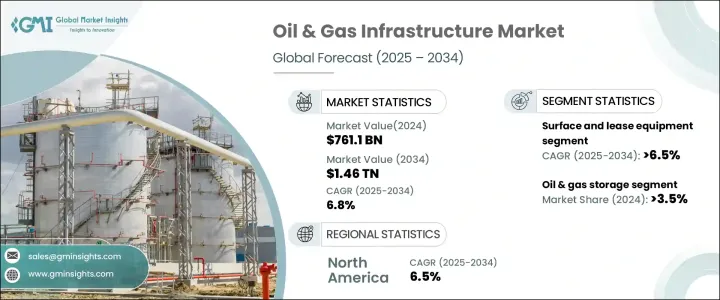
The Global Oil and Gas Infrastructure Market reached USD 761.1 billion in 2024 and is projected to grow at a CAGR of 6.8% from 2025 to 2034. The increasing demand for oil and gas, especially in emerging economies, combined with surging investments in large-scale infrastructure projects, is set to drive industry expansion. With the energy sector undergoing rapid transformation, nations are allocating significant resources to strengthen their infrastructure and enhance operational efficiency. Rising energy consumption, coupled with advancements in technology, is accelerating the development of efficient transportation, storage, and processing facilities.
The industry is classified into several segments, including surface and lease equipment, gathering and processing, pipelines, storage, refining and transportation, and export terminals. Surface and lease equipment is expected to grow at a CAGR of 6.5% by 2034, driven by the expansion of exploration and production activities. The rising implementation of unconventional drilling techniques, such as tight gas and shale gas extraction, is further fueling demand for advanced equipment to support operations. As energy producers seek to enhance efficiency and optimize production, investment in surface infrastructure remains critical.
| Market Scope | |
|---|---|
| Start Year | 2024 |
| Forecast Year | 2025-2034 |
| Start Value | $761.1 Billion |
| Forecast Value | $1.46 Trillion |
| CAGR | 6.8% |
The oil & gas storage sector held a 3.5% share in 2024, with demand increasing due to a shift toward a natural gas-based economy and expanding global trade. The growing need for large-scale storage solutions stems from heightened petrochemical and refinery activities, where significant capacities are required to accommodate crude oil, feedstocks, and refined petroleum products, including jet fuel, diesel, and gasoline. The push for supply flexibility and enhanced storage infrastructure is reinforcing market growth, ensuring a stable energy supply to meet fluctuating demand.
United States oil & gas infrastructure market was valued at USD 80.4 billion in 2024, with projections expected to generate USD 150 billion by 2034. Strategic investments in energy infrastructure are reinforcing national energy security, minimizing supply chain vulnerabilities, and ensuring uninterrupted fuel distribution. The country is focusing on modernizing and expanding liquefaction plants and refining terminals, accelerating industry adoption of cutting-edge technologies. Increased capital expenditure in pipeline networks, storage expansions, and advanced refining facilities is fostering sectoral growth, allowing the US to maintain its position as a dominant player in the oil and gas infrastructure landscape.
Table of Contents
Chapter 1 Methodology & Scope
- 1.1 Market scope & definitions
- 1.2 Market estimates & forecast parameters
- 1.3 Forecast calculation
- 1.4 Data sources
- 1.4.1 Primary
- 1.4.2 Secondary
- 1.4.2.1 Paid
- 1.4.2.2 Public
Chapter 2 Executive Summary
- 2.1 Industry synopsis, 2021 - 2034
Chapter 3 Industry Insights
- 3.1 Industry ecosystem analysis
- 3.2 Regulatory landscape
- 3.3 Industry impact forces
- 3.3.1 Growth drivers
- 3.3.2 Industry pitfalls & challenges
- 3.4 Growth potential analysis
- 3.5 Porter's analysis
- 3.5.1 Bargaining power of suppliers
- 3.5.2 Bargaining power of buyers
- 3.5.3 Threat of new entrants
- 3.5.4 Threat of substitutes
- 3.6 PESTEL analysis
Chapter 4 Competitive Landscape, 2024
- 4.1 Introduction
- 4.2 Strategic outlook
- 4.3 Innovation & sustainability landscape
Chapter 5 Market Size and Forecast, By Category, 2021 – 2034 (USD Billion)
- 5.1 Key trends
- 5.2 Surface and lease equipment
- 5.3 Gathering & processing
- 5.4 Oil, gas & NGL pipelines
- 5.5 Oil & gas storage
- 5.6 Refining & oil products transport
- 5.7 Export terminals
Chapter 6 Market Size and Forecast, By Region, 2021 – 2034 (USD Billion)
- 6.1 Key trends
- 6.2 North America
- 6.2.1 U.S.
- 6.2.2 Canada
- 6.3 Europe
- 6.3.1 Norway
- 6.3.2 UK
- 6.3.3 France
- 6.3.4 Italy
- 6.3.5 Russia
- 6.4 Asia Pacific
- 6.4.1 China
- 6.4.2 India
- 6.4.3 Japan
- 6.4.4 South Korea
- 6.4.5 Australia
- 6.5 Middle East & Africa
- 6.5.1 Saudi Arabia
- 6.5.2 Qatar
- 6.5.3 Nigeria
- 6.5.4 UAE
- 6.5.5 Oman
- 6.5.6 Egypt
- 6.6 Latin America
- 6.6.1 Brazil
- 6.6.2 Argentina
- 6.6.3 Mexico
Chapter 7 Company Profiles
- 7.1 Baker Hughes Company
- 7.2 BP
- 7.3 Centrica
- 7.4 Chevron Corporation
- 7.5 ConocoPhillips
- 7.6 Energy Transfer
- 7.7 Enterprise Products Partners
- 7.8 Exxon Mobil Corporation
- 7.9 Hatch
- 7.10 Halliburton
- 7.11 Kinder Morgan
- 7.12 Marathon Oil Company
- 7.13 NGL Energy Partners
- 7.14 Occidental Petroleum Corporation
- 7.15 ONEOK
- 7.16 Royal Vopak
- 7.17 SLB
- 7.18 Shell
- 7.19 TotalEnergies
- 7.20 WILLIAMS
 全球工業靜電消除器市場
 生產測試市場-全球產業規模、佔有率、趨勢、機會與預測(細分、按服務類型、按設備類型、按地區、按競爭,2020-2030 年預測)真空氣油市場-全球產業規模、佔有率、趨勢、機會和預測(按產品、類型、應用、地區和競爭細分,2020-2030 年)
 2025-2029年全球石油與天然氣開採市場
 真空柴油市場規模、佔有率、成長分析(按產品、按含硫量、按應用、按地區)- 產業預測,2025 年至 2032 年
 2025-2029年全球石油天然氣產業IT支出
 2025年上游石油和天然氣活動全球市場報告2025年全球石油和天然氣支援活動市場報告
 石油和天然氣資本支出市場(按產品、流類型、技術、最終用戶產業和地理分類)—2025-2030 年全球預測
 中國上游石油天然氣市場:市場佔有率分析、產業趨勢與統計、成長預測(2025-2030年)