


 |
市場調查報告書
商品編碼
1699282
碳捕獲與儲存市場機會、成長動力、產業趨勢分析及 2025-2034 年預測Carbon Capture and Storage Market Opportunity, Growth Drivers, Industry Trend Analysis, and Forecast 2025-2034 |
||||||
2024 年全球碳捕獲與儲存市場價值為 88 億美元,預計 2025 年至 2034 年期間的複合年成長率為 16.7%。抑制溫室氣體排放和實現脫碳目標的緊迫性日益增加,推動了對 CCS 技術的大量投資。世界各國政府正在實施嚴格的環境法規,迫使各行各業採用先進的碳捕獲解決方案以滿足合規標準並減少其碳足跡。人們對氣候變遷的擔憂日益加劇,加上工業的快速擴張和能源需求,進一步推動了對具有成本效益的排放控制技術的需求。
能源、化學和製造業領域的公司正在積極將 CCS 解決方案融入其營運中,以符合全球永續發展計畫。人們對清潔能源轉型的日益關注,加上碳捕獲效率的提高,為市場擴張帶來了新的機會。此外,不斷增加的研究和開發活動正在促進下一代 CCS 技術的創新,從而提高可擴展性和操作可行性。隨著各行各業努力在環境責任和經濟成長之間取得平衡,CCS 正成為實現長期碳中和的關鍵解決方案。
| 市場範圍 | |
|---|---|
| 起始年份 | 2024 |
| 預測年份 | 2025-2034 |
| 起始值 | 88億美元 |
| 預測值 | 450億美元 |
| 複合年成長率 | 16.7% |
根據技術,市場分為燃燒前、富氧燃燒和燃燒後。預計燃燒後捕獲技術將實現大幅成長,預計到 2034 年其市場價值將達到 340 億美元。該技術由於與現有工業設備的無縫整合而越來越受到關注,並有望在發電廠、煉油廠和製造工廠中大規模採用。隨著排放控制成為優先事項,後燃燒系統正在不斷發展,效率和成本效益不斷提高,使其成為尋求可行碳減排策略的行業的一個有吸引力的選擇。創新吸收劑和先進過濾技術的開發進一步提升了燃燒後技術的性能和應用,確保了市場的持續擴張。
在應用方面,市場涵蓋發電、化學加工、石油和天然氣等產業。 2024 年,發電領域佔據了 36% 的佔有率,預計到 2034 年將以 17% 的複合年成長率成長。 CCS 基礎設施的持續部署以促進氫氣的生產、儲存和分配是推動該領域需求的關鍵因素。隨著全球能源消耗持續上升,各國政府和公用事業供應商都優先採用 CCS 來滿足排放目標,同時又不影響能源產出。發電廠正在利用 CCS 解決方案改造傳統能源系統,確保遵守嚴格的環境政策,同時維持營運效率。 CCS 與再生能源專案和碳負排放措施的整合進一步鞏固了其在不斷變化的能源格局中的作用。
美國市場在 2024 年創造了 33 億美元的收入,預計到 2034 年將達到 110 億美元。美國對減少碳排放和現代化能源基礎設施的重視正在加速 CCS 投資。排放控制系統的技術進步,加上大規模 CCS 專案的大量資金,正在推動全國市場的成長。北美仍然是 CCS 擴張的關鍵地區,戰略夥伴關係和政府激勵措施在促進創新和部署方面發揮著至關重要的作用。隨著各行各業都在努力追求更乾淨的生產方法,美國市場必將經歷強勁成長,鞏固其在全球 CCS 領域的領導地位。
目錄
第1章:方法論與範圍
- 市場範圍和定義
- 市場估計和預測參數
- 預測計算
- 資料來源
- 基本的
- 次要
- 有薪資的
- 民眾
第2章:執行摘要
第3章:行業洞察
- 產業生態系統分析
- 監管格局
- 產業衝擊力
- 成長動力
- 產業陷阱與挑戰
- 成長潛力分析
- 波特的分析
- PESTEL分析
第4章:競爭格局
- 介紹
- 戰略展望
- 創新與永續發展格局
第5章:市場規模及預測:依技術分類,2021 年至 2034 年
- 主要趨勢
- 預燃燒
- 後燃燒
- 富氧燃燒
第6章:市場規模及預測:依應用,2021 年至 2034 年
- 主要趨勢
- 石油和天然氣
- 化學加工
- 發電
- 其他
第7章:市場規模及預測:依地區,2021 年至 2034 年
- 主要趨勢
- 北美洲
- 美國
- 加拿大
- 歐洲
- 英國
- 德國
- 丹麥
- 瑞典
- 亞太地區
- 中國
- 澳洲
- 韓國
- 世界其他地區
第8章:公司簡介
- Air Products
- Aker Solutions
- Carbon Clean
- Chevron
- Dakota Gasification Company
- Equinor
- Exxon Mobil
- Fluor
- General Electric
- Halliburton
- Linde
- Mitsubishi Heavy Industries
- NRG Energy
- Shell Cansolv
- Siemens
- SLB
- Sulzer
- TotalEnergies
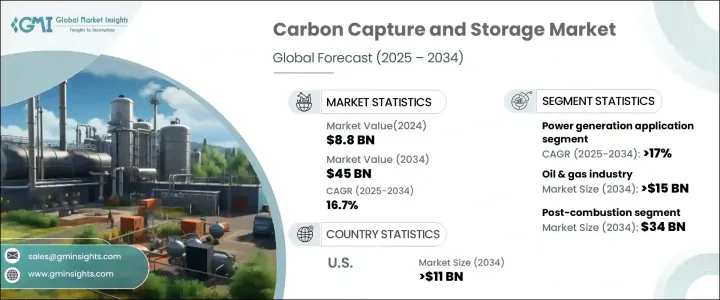
The Global Carbon Capture And Storage Market was valued at USD 8.8 billion in 2024 and is projected to grow at a CAGR of 16.7% between 2025 and 2034. The increasing urgency to curb greenhouse gas emissions and achieve decarbonization goals is driving significant investments in CCS technologies. Governments worldwide are implementing stringent environmental regulations, compelling industries to adopt advanced carbon capture solutions to meet compliance standards and mitigate their carbon footprint. Rising concerns over climate change, combined with the rapid industrial expansion and energy demands, are further propelling the need for cost-effective emission control technologies.
Companies across the energy, chemical, and manufacturing sectors are actively integrating CCS solutions into their operations to align with global sustainability initiatives. The growing focus on clean energy transition, coupled with advancements in carbon capture efficiency, is unlocking new opportunities for market expansion. Additionally, increasing research and development activities are fostering the innovation of next-generation CCS technologies that enhance scalability and operational feasibility. As industries strive to balance environmental responsibility with economic growth, CCS is emerging as a pivotal solution for achieving long-term carbon neutrality.
| Market Scope | |
|---|---|
| Start Year | 2024 |
| Forecast Year | 2025-2034 |
| Start Value | $8.8 Billion |
| Forecast Value | $45 Billion |
| CAGR | 16.7% |
The market is segmented based on technology into pre-combustion, oxy-fuel combustion, and post-combustion. Post-combustion capture technology is expected to witness substantial growth, with forecasts indicating it will reach USD 34 billion by 2034. This technology is gaining traction due to its seamless integration with existing industrial setups, enabling large-scale adoption across power plants, refineries, and manufacturing facilities. As emission control becomes a priority, post-combustion systems are evolving with enhanced efficiency and cost-effectiveness, making them an attractive option for industries seeking viable carbon reduction strategies. The development of innovative absorbents and advanced filtration techniques is further boosting the performance and adoption of post-combustion technology, ensuring consistent market expansion.
In terms of application, the market spans power generation, chemical processing, and oil & gas, among other industries. The power generation segment captured a 36% share in 2024 and is expected to grow at a CAGR of 17% through 2034. The increasing deployment of CCS infrastructure to facilitate hydrogen production, storage, and distribution is a crucial factor fueling demand within this sector. As global energy consumption continues to rise, governments and utility providers are prioritizing CCS adoption to meet emission targets without compromising energy output. Power plants are leveraging CCS solutions to retrofit conventional energy systems, ensuring compliance with strict environmental policies while maintaining operational efficiency. The integration of CCS in renewable energy projects and carbon-negative initiatives is further solidifying its role in the evolving energy landscape.
The U.S. market generated USD 3.3 billion in 2024 and is projected to reach USD 11 billion by 2034. The nation's emphasis on reducing carbon emissions and modernizing energy infrastructure is accelerating CCS investments. Technological advancements in emission control systems, coupled with substantial funding for large-scale CCS projects, are driving market growth across the country. North America remains a key region for CCS expansion, with strategic partnerships and government incentives playing a vital role in fostering innovation and deployment. As industries strive for cleaner production methods, the U.S. market is set to experience robust growth, reinforcing its leadership in the global CCS landscape.
Table of Contents
Chapter 1 Methodology & Scope
- 1.1 Market scope & definitions
- 1.2 Market estimates & forecast parameters
- 1.3 Forecast calculation
- 1.4 Data sources
- 1.4.1 Primary
- 1.4.2 Secondary
- 1.4.2.1 Paid
- 1.4.2.2 Public
Chapter 2 Executive Summary
- 2.1 Industry synopsis, 2021 - 2034
Chapter 3 Industry Insights
- 3.1 Industry ecosystem analysis
- 3.2 Regulatory landscape
- 3.3 Industry impact forces
- 3.3.1 Growth drivers
- 3.3.2 Industry pitfalls & challenges
- 3.4 Growth potential analysis
- 3.5 Porter's analysis
- 3.5.1 Bargaining power of suppliers
- 3.5.2 Bargaining power of buyers
- 3.5.3 Threat of new entrants
- 3.5.4 Threat of substitutes
- 3.6 PESTEL analysis
Chapter 4 Competitive Landscape, 2024
- 4.1 Introduction
- 4.2 Strategic outlook
- 4.3 Innovation & sustainability landscape
Chapter 5 Market Size and Forecast, By Technology, 2021 – 2034 (MTPA, USD Billion)
- 5.1 Key trends
- 5.2 Pre combustion
- 5.3 Post combustion
- 5.4 Oxy-Fuel combustion
Chapter 6 Market Size and Forecast, By Application, 2021 – 2034 (MTPA, USD Billion)
- 6.1 Key trends
- 6.2 Oil and gas
- 6.3 Chemical processing
- 6.4 Power generation
- 6.5 Others
Chapter 7 Market Size and Forecast, By Region, 2021 – 2034 (MTPA, USD Billion)
- 7.1 Key trends
- 7.2 North America
- 7.2.1 U.S.
- 7.2.2 Canada
- 7.3 Europe
- 7.3.1 UK
- 7.3.2 Germany
- 7.3.3 Denmark
- 7.3.4 Sweden
- 7.4 Asia Pacific
- 7.4.1 China
- 7.4.2 Australia
- 7.4.3 South Korea
- 7.5 Rest of World
Chapter 8 Company Profiles
- 8.1 Air Products
- 8.2 Aker Solutions
- 8.3 Carbon Clean
- 8.4 Chevron
- 8.5 Dakota Gasification Company
- 8.6 Equinor
- 8.7 Exxon Mobil
- 8.8 Fluor
- 8.9 General Electric
- 8.10 Halliburton
- 8.11 Linde
- 8.12 Mitsubishi Heavy Industries
- 8.13 NRG Energy
- 8.14 Shell Cansolv
- 8.15 Siemens
- 8.16 SLB
- 8.17 Sulzer
- 8.18 TotalEnergies
 碳捕獲利用化學品市場機會、成長促進因素、產業趨勢分析及預測(2025-2034年)
 2025年全球海事排放交易體系(ETS)合規平台市場報告
 全球捕碳封存(CCS)市場:市場規模、佔有率、趨勢分析(按捕獲技術、應用和地區分類)、細分市場預測,2025-2033年
 二氧化碳捕集壓縮機:全球市場佔有率和排名、總銷售額和需求預測(2025-2031 年)碳捕獲與利用(CCU):全球市場佔有率排名、總銷售額和需求預測,2025-2031年
 CCUS吸收的全球市場(~2035年):各吸收類型,各吸收階段類型,各部署類型,各用途類型,各終端用戶,各地區,產業趨勢,預測
 CCUS吸收市場分析及2034年預測:類型、產品、服務、技術、組件、應用、流程、最終用戶、能力、解決方案
 全球捕碳封存市場:預測至2032年-按來源、技術、服務、最終用戶和地區分類的分析捕碳封存(CCS)市場預測至2032年:按服務類型、儲存類型、技術、應用、最終用戶和地區分類的全球分析
 2025 年至 2032 年發電領域 CCS 市場(按技術類型、擷取方法、工廠類型、計劃規模和部署模型分類)全球預測