


 |
市場調查報告書
商品編碼
1698566
浮動太陽能光電市場機會、成長動力、產業趨勢分析及2025-2034年預測Floating Solar PV Market Opportunity, Growth Drivers, Industry Trend Analysis, and Forecast 2025-2034 |
||||||
2024 年全球浮動太陽能光電市場價值為 77 億美元,預計 2025 年至 2034 年的複合年成長率為 1.5%。與水力發電廠相連的水庫擴大部署太陽能光電系統,加上材料、設計和繫泊技術的創新,正在推動其更廣泛的應用。這些進步提高了浮動結構的耐用性和穩定性,使其更有效率、更具成本效益。透過冷卻來減少水分蒸發和提高面板效率的能力是一個關鍵促進因素,特別是在中東和非洲等高溫和缺水地區。
此外,在土地資源有限的島國和沿海地區擴大安裝也加強了市場成長。監管框架、試點計畫和支持浮動光伏應用的政府政策的建立正在進一步加速該產業的擴張。較低的環境影響、減少的溫室氣體排放以及每個電池板的更高能量產量使浮動太陽能成為一種有吸引力的再生能源解決方案。這些系統主要部署在未充分利用的水體上,包括水庫、水壩和湖泊,這增強了它們作為永續電源的可行性。
| 市場範圍 | |
|---|---|
| 起始年份 | 2024 |
| 預測年份 | 2025-2034 |
| 起始值 | 77億美元 |
| 預測值 | 89億美元 |
| 複合年成長率 | 1.5% |
根據容量,市場分為 5 兆瓦、5-15 兆瓦和 >15 兆瓦。 2022 年該市場價值為 54 億美元,2023 年為 76 億美元,2024 年為 77 億美元。預計到 2034 年,在技術進步、大規模專案投資和優惠政策的支持下,15 兆瓦以上的市值將超過 40 億美元。中國、印度和韓國等國家正在擴大其發電能力,增加了對大規模浮動光電裝置的需求。受分散式能源發電需求不斷成長、重點轉向再生能源以及土地限制的推動,5 兆瓦市場預計將穩步成長。這些小規模項目由於資本要求較低,對市政當局、當地公用事業公司和私人開發商具有吸引力。此外,隨著技術的進步,5 MW 至 15 MW 範圍內專案的採用正在擴大,特別是在水資源豐富但土地有限的地區。
市場根據產品進一步細分為追蹤型和固定浮動太陽能光電系統。由於有利的監管環境,固定式設備市場在 2024 年的收入佔比超過 82%。同時,隨著追蹤技術的整合提高了能源生產效率,預計到 2032 年追蹤領域的複合年成長率將達到 5.5%。追蹤系統的採用日益增多,特別是在太陽能需求高且土地有限的地區,正在推動市場擴張。正在開發結合太陽追蹤的混合浮動光伏系統,透過自動調整面板角度以獲得最佳陽光照射來提高性能。
在美國,浮動太陽能光電市場在 2022 年達到 1,000 萬美元,2023 年達到 1,400 萬美元,2024 年達到 1,600 萬美元。由於人們對陸上浮動技術、土地保護和更高能源效率的興趣日益濃厚,推動了市場成長,北美在 2024 年將佔全球市場佔有率的 0.3%。
目錄
第1章:方法論與範圍
- 研究設計
- 基礎估算與計算
- 預測模型
- 初步研究與驗證
- 主要來源
- 資料探勘來源
- 市場定義
第2章:執行摘要
第3章:行業洞察
- 產業生態系統
- 監管格局
- 主要漂浮太陽能光電項目
- 操作
- 即將推出
- 產業衝擊力
- 成長動力
- 產業陷阱與挑戰
- 成長潛力分析
- 價格趨勢分析
- 波特的分析
- PESTEL分析
第4章:競爭格局
- 介紹
- 戰略儀表板
- 創新與技術格局
第5章:市場規模及預測:依產能,2021 年至 2034 年
- 主要趨勢
- <5 兆瓦
- 5-15兆瓦
- >15 兆瓦
第6章:市場規模及預測:依產品,2021 年至 2034 年
- 主要趨勢
- 固定式
- 追蹤
第7章:市場規模及預測:依地區,2021 年至 2034 年
- 主要趨勢
- 北美洲
- 美國
- 加拿大
- 歐洲
- 德國
- 法國
- 荷蘭
- 義大利
- 挪威
- 亞太地區
- 中國
- 日本
- 韓國
- 印度
- 印尼
- 中東和非洲
- 摩洛哥
- 阿拉伯聯合大公國
- 拉丁美洲
- 巴西
- 寮國
第8章:公司簡介
- China Three Gorges New Energy
- Ciel & Terre International
- Eni Energy Solutions
- FOST
- Isifloating
- Kyocera Corporation
- Longi Solar
- Ocean Sun AS
- SolarDuck
- SolarisFloat
- Sungrow Group
- Swimsol
- Yingli Solar
- ZIMMERMANN PV-Floating BV
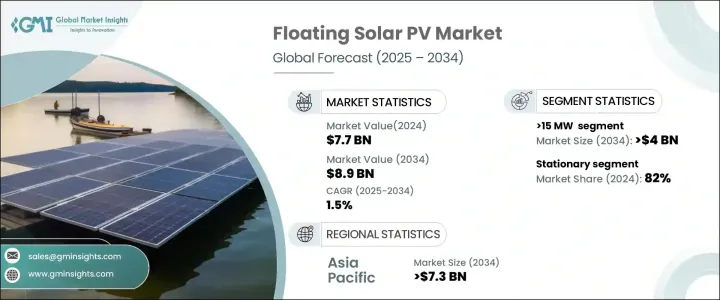
The Global Floating Solar PV Market was valued at USD 7.7 billion in 2024 and is set to grow at a CAGR of 1.5% from 2025 to 2034. The increasing deployment of solar PV systems on reservoirs linked to hydropower plants, along with innovations in materials, design, and mooring technology, is driving broader adoption. These advancements enhance the durability and stability of floating structures, making them more efficient and cost-effective. The ability to minimize water evaporation and improve panel efficiency through cooling is a key driver, particularly in high-temperature and water-scarce regions such as the Middle East and Africa.
Additionally, expanding installations in island nations and coastal areas with limited land resources are strengthening market growth. The establishment of regulatory frameworks, pilot projects, and government policies supporting floating PV adoption is further accelerating the industry's expansion. The lower environmental impact, reduced greenhouse gas emissions, and higher energy yield per panel make floating solar an attractive renewable energy solution. These systems are primarily deployed on underutilized water bodies, including reservoirs, dams, and lakes, which enhances their viability as a sustainable power source.
| Market Scope | |
|---|---|
| Start Year | 2024 |
| Forecast Year | 2025-2034 |
| Start Value | $7.7 Billion |
| Forecast Value | $8.9 Billion |
| CAGR | 1.5% |
By capacity, the market is categorized into 5 MW, 5-15 MW, and >15 MW. It was valued at USD 5.4 billion in 2022, USD 7.6 billion in 2023, and USD 7.7 billion in 2024. The >15 MW segment is forecast to surpass USD 4 billion by 2034, supported by technological advancements, large-scale project investments, and favorable policies. Countries such as China, India, and South Korea are expanding their electricity generation capacity, increasing demand for extensive floating PV installations. The 5 MW segment is expected to experience steady growth, driven by the rising need for decentralized energy generation, shifting focus toward renewables, and land constraints. These smaller-scale projects appeal to municipalities, local utilities, and private developers due to their lower capital requirements. Additionally, the adoption of projects in the >5 MW to 15 MW range is expanding as technology improves, particularly in regions with abundant water resources but limited land availability.
The market is further segmented by product into tracking and stationary floating solar PV systems. The stationary segment accounted for over 82% of revenue in 2024, bolstered by a favorable regulatory environment that supports its adoption. Meanwhile, the tracking segment is projected to grow at a CAGR of 5.5% through 2032, as the integration of tracking technology enhances energy generation efficiency. The rising adoption of tracking systems, particularly in regions with high solar demand and land limitations, is boosting market expansion. Hybrid floating PV systems incorporating solar tracking are being developed, improving performance by automatically adjusting panel angles for optimal sunlight exposure.
In the United States, the floating solar PV market recorded USD 10 million in 2022, USD 14 million in 2023, and USD 16 million in 2024. North America accounted for 0.3% of the global market share in 2024, as increasing interest in onshore floating technology, land conservation, and higher energy efficiency contributes to market growth.
Table of Contents
Chapter 1 Methodology & Scope
- 1.1 Research Design
- 1.2 Base estimates & calculations
- 1.3 Forecast model
- 1.4 Primary research & validation
- 1.4.1 Primary sources
- 1.4.2 Data mining sources
- 1.5 Market definitions
Chapter 2 Executive Summary
- 2.1 Industry 3600 synopsis, 2021 – 2034
Chapter 3 Industry Insights
- 3.1 Industry ecosystem
- 3.2 Regulatory landscape
- 3.3 Major floating solar PV projects
- 3.3.1 Operational
- 3.3.2 Upcoming
- 3.4 Industry impact forces
- 3.4.1 Growth drivers
- 3.4.2 Industry pitfalls & challenges
- 3.5 Growth potential analysis
- 3.6 Price trend analysis
- 3.7 Porter's analysis
- 3.7.1 Bargaining power of suppliers
- 3.7.2 Bargaining power of buyers
- 3.7.3 Threat of new entrants
- 3.7.4 Threat of substitutes
- 3.8 PESTEL analysis
Chapter 4 Competitive landscape, 2024
- 4.1 Introduction
- 4.2 Strategic dashboard
- 4.3 Innovation & technology landscape
Chapter 5 Market Size and Forecast, By Capacity, 2021 – 2034 (USD Million & MW)
- 5.1 Key trends
- 5.2 <5 MW
- 5.3 5-15 MW
- 5.4 >15 MW
Chapter 6 Market Size and Forecast, By Product, 2021 – 2034 (USD Million & MW)
- 6.1 Key trends
- 6.2 Stationary
- 6.3 Tracking
Chapter 7 Market Size and Forecast, By Region, 2021 – 2034 (USD Million & MW)
- 7.1 Key trends
- 7.2 North America
- 7.2.1 U.S.
- 7.2.2 Canada
- 7.3 Europe
- 7.3.1 Germany
- 7.3.2 France
- 7.3.3 Netherlands
- 7.3.4 Italy
- 7.3.5 Norway
- 7.4 Asia Pacific
- 7.4.1 China
- 7.4.2 Japan
- 7.4.3 South Korea
- 7.4.4 India
- 7.4.5 Indonesia
- 7.5 Middle East & Africa
- 7.5.1 Morocco
- 7.5.2 UAE
- 7.6 Latin America
- 7.6.1 Brazil
- 7.6.2 Laos
Chapter 8 Company Profiles
- 8.1 China Three Gorges New Energy
- 8.2 Ciel & Terre International
- 8.3 Eni Energy Solutions
- 8.4 FOST
- 8.5 Isifloating
- 8.6 Kyocera Corporation
- 8.7 Longi Solar
- 8.8 Ocean Sun AS
- 8.9 SolarDuck
- 8.10 SolarisFloat
- 8.11 Sungrow Group
- 8.12 Swimsol
- 8.13 Yingli Solar
- 8.14 ZIMMERMANN PV-Floating B.V.


