


 |
市場調查報告書
商品編碼
1698549
農光伏市場機會、成長動力、產業趨勢分析及2025-2034年預測Agrivoltaic Market Opportunity, Growth Drivers, Industry Trend Analysis, and Forecast 2025-2034 |
||||||
2024 年全球農業光電市場價值為 63 億美元,預計 2025 年至 2034 年期間的複合年成長率為 5.6%。與農業活動相結合的大型太陽能裝置的日益普及正在推動這一擴張。透過提供部分遮蔭,太陽能板可以保護農作物和牲畜免受極端高溫和乾旱的影響,從而提高農業經濟的生產力。政府和私人企業不斷推出鼓勵具有成本效益的共置模式的資助計劃,重塑產業格局。此外,世界各地正在建立監管框架,以標準化安裝並確保永續部署。法國、德國、義大利等已開發經濟體正積極引進農光伏系統,以最佳化土地利用、提高能源效率。農業用地最佳化的需求日益成長,尤其是在土地稀缺的地區,這推動了農業用地最佳化的應用,而各個地區廣闊的農業景觀和充足的陽光進一步促進了該行業的擴張。
農業光電系統促進糧食和電力的高效生產,促進經濟成長。安裝在植被上方的太陽能電池板在較低的溫度下運行,從而提高了效率並增強了整體能量輸出。按系統設計進行的市場細分包括固定結構和動態結構,每種結構都有助於土地最佳化,而不會擾亂農業活動。固定農業光電系統的價值在 2022 年為 55 億美元,2023 年為 59 億美元,2024 年為 63 億美元,預計到 2034 年將以 4.5% 的複合年成長率成長。對可靠且經濟高效的太陽能解決方案的需求正在加速採用,而對簡化安裝流程的需求正在進一步推動市場滲透。對更高能源產量和更高作物生產率的追求正在增加動態系統的部署,而追蹤機制的創新則提高了整體性能。
| 市場範圍 | |
|---|---|
| 起始年份 | 2024 |
| 預測年份 | 2025-2034 |
| 起始值 | 63億美元 |
| 預測值 | 111億美元 |
| 複合年成長率 | 5.6% |
根據收穫類型,市場包括根莖作物、蔬菜和水果。 2024 年,塊根作物佔據了 56.7% 的市場佔有率,預計到 2032 年將以超過 6% 的複合年成長率成長。太陽能板能夠最大限度地減少水分蒸發,同時保持穩定的土壤濕度,這是其一個關鍵優勢,目前的研究正在確定更多適合農光伏農業的作物品種。由於農民尋求額外的收入來源並專注於永續的農業方法,蔬菜佔了近 20% 的市場。由於蒸發率降低、小氣候改善以及農民收入潛力提高,農業光伏水果產業正在獲得發展動力。探索多種應用的試點計畫繼續增加人們對該技術的興趣。
在美國,農業光電市場規模在 2022 年達到 6.8 億美元,2023 年達到 7.2 億美元,2024 年達到 7.7 億美元。預計到 2034 年,北美市場將以超過 6% 的複合年成長率擴張,這得益於不斷成長的太陽能需求和有限的土地供應。智慧農業光伏系統旨在監測作物健康狀況和最佳化能源生產,它正在促進這一成長,使該地區成為先進太陽能農業一體化的關鍵市場。
目錄
第1章:方法論與範圍
- 市場定義
- 基礎估算與計算
- 預測計算
- 資料來源
- 基本的
- 次要
- 付費來源
- 未付費來源
第2章:執行摘要
第3章:行業洞察
- 產業生態系統分析
- 供應商矩陣
- 監管格局
- 產業衝擊力
- 成長動力
- 產業陷阱與挑戰
- COVID-19 對產業前景的影響
- 成長潛力分析
- 波特的分析
- PESTEL 分析
第4章:競爭格局
- 戰略儀表板
- 創新與永續發展格局
第5章:市場規模及預測:依系統設計,2021 年至 2034 年
- 主要趨勢
- 固定的
- 動態的
第6章:市場規模及預測:依收穫類型,2021 年至 2034 年
- 主要趨勢
- 塊根作物
- 蔬菜
- 水果
第7章:市場規模及預測:依地區分類,2021 年至 2034 年
- 主要趨勢
- 獨立
- 遮陽網
- 溫室
- 其他
第8章:市場規模及預測:按地區,2021 年至 2034 年
- 主要趨勢
- 北美洲
- 美國
- 加拿大
- 墨西哥
- 歐洲
- 奧地利
- 挪威
- 丹麥
- 芬蘭
- 法國
- 亞太地區
- 中國
- 澳洲
- 印度
- 韓國
- 世界其他地區
第9章:公司簡介
- TotalEnergies
- Agrivoltaic Solution LLC
- Cero Generation Limited
- Sun'Agr
- iSun, Inc.
- REM TEC
- Trina Solar
- Jinko Solar
- VALOREM
- SunPower Corporation
- Next2Sun
- Enel Spa
- Solaria
- Waaree Energies Ltd.
- Insolight
- Vattenfall AB
- Chint New Energy Technology Co., Ltd.
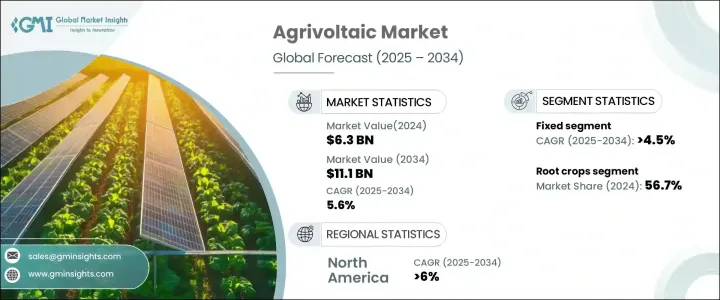
The Global Agrivoltaic Market, valued at USD 6.3 billion in 2024, is projected to grow at a 5.6% CAGR from 2025 to 2034. The increasing adoption of large-scale solar installations integrated with agricultural activities is driving this expansion. By providing partial shade, solar panels protect crops and livestock from extreme heat and drought, enhancing productivity in agrarian economies. Governments and private enterprises continue to introduce funding initiatives that encourage cost-effective co-location models, reshaping the industry landscape. Additionally, regulatory frameworks are being established worldwide to standardize installations and ensure sustainable deployment. Developed economies, including France, Germany, and Italy, are actively incorporating agrivoltaic systems to optimize land use and improve energy efficiency. The rising need for agricultural land optimization, particularly in land-scarce regions, is fueling adoption, while extensive agricultural landscapes and abundant sunlight in various regions further boost the industry's expansion.
Agrivoltaic systems facilitate the efficient production of food and electricity, contributing to economic growth. The panels installed over vegetation operate at lower temperatures, improving efficiency and enhancing overall energy output. Market segmentation by system design includes fixed and dynamic structures, each contributing to land optimization without disrupting farming activities. Fixed agrivoltaic systems, valued at USD 5.5 billion in 2022, USD 5.9 billion in 2023, and USD 6.3 billion in 2024, are expected to grow at a 4.5% CAGR through 2034. The demand for reliable and cost-effective solar energy solutions is accelerating adoption, while the need for simplified installation processes is further driving market penetration. The push for higher energy yields and improved crop productivity is increasing the deployment of dynamic systems, with innovations in tracking mechanisms enhancing overall performance.
| Market Scope | |
|---|---|
| Start Year | 2024 |
| Forecast Year | 2025-2034 |
| Start Value | $6.3 Billion |
| Forecast Value | $11.1 Billion |
| CAGR | 5.6% |
By harvest type, the market includes root crops, vegetables, and fruits. Root crops represented 56.7% of the market in 2024 and are projected to grow at over 6% CAGR through 2032. The ability of solar panels to minimize water evaporation while maintaining stable soil moisture is a key advantage, with ongoing research identifying additional crop varieties suited for agrivoltaic farming. Vegetables accounted for nearly 20% of the market, as farmers seek additional revenue streams and focus on sustainable farming methods. The agrivoltaic fruit sector is gaining traction due to reduced evaporation rates, improved microclimates, and enhanced income potential for farmers. Pilot projects exploring diverse applications continue to increase interest in the technology.
In the U.S., the agrivoltaic market reached USD 680 million in 2022, USD 720 million in 2023, and USD 770 million in 2024. North America's market is forecasted to expand at a CAGR exceeding 6% through 2034, driven by growing solar energy demand and limited land availability. Smart agrivoltaic systems, designed for monitoring crop health and optimizing energy production, are contributing to this growth, positioning the region as a key market for advanced solar-agriculture integration.
Table of Contents
Chapter 1 Methodology & Scope
- 1.1 Market definitions
- 1.2 Base estimates & calculations
- 1.3 Forecast calculation
- 1.4 Data sources
- 1.4.1 Primary
- 1.4.2 Secondary
- 1.4.2.1 Paid sources
- 1.4.2.2 Unpaid sources
Chapter 2 Executive Summary
- 2.1 Industry 360° synopsis, 2021 – 2034
Chapter 3 Industry Insights
- 3.1 Industry ecosystem analysis
- 3.1.1 Vendor Matrix
- 3.2 Regulatory landscape
- 3.3 Industry impact forces
- 3.3.1 Growth drivers
- 3.3.2 Industry pitfalls & challenges
- 3.4 COVID- 19 impact on the industry outlook
- 3.5 Growth potential analysis
- 3.6 Porter's Analysis
- 3.6.1 Bargaining power of suppliers
- 3.6.2 Bargaining power of buyers
- 3.6.3 Threat of new entrants
- 3.6.4 Threat of substitutes
- 3.7 PESTEL Analysis
Chapter 4 Competitive landscape, 2024
- 4.1 Strategic dashboard
- 4.2 Innovation & sustainability landscape
Chapter 5 Market Size and Forecast, By System Design, 2021 – 2034 (USD Million)
- 5.1 Key trends
- 5.2 Fixed
- 5.3 Dynamic
Chapter 6 Market Size and Forecast, By Harvest Type, 2021 – 2034 (USD Million)
- 6.1 Key trends
- 6.2 Root crops
- 6.3 Vegetables
- 6.4 Fruits
Chapter 7 Market Size and Forecast, By Placement, 2021 – 2034 (USD Million)
- 7.1 Key trends
- 7.2 Standalone
- 7.3 Shading nets
- 7.4 Greenhouses
- 7.5 Others
Chapter 8 Market Size and Forecast, By Region, 2021 – 2034 (USD million)
- 8.1 Key trends
- 8.2 North America
- 8.2.1 U.S.
- 8.2.2 Canada
- 8.2.3 Mexico
- 8.3 Europe
- 8.3.1 Austria
- 8.3.2 Norway
- 8.3.3 Denmark
- 8.3.4 Finland
- 8.3.5 France
- 8.4 Asia Pacific
- 8.4.1 China
- 8.4.2 Australia
- 8.4.3 India
- 8.4.4 South Korea
- 8.5 Rest of World
Chapter 9 Company Profiles
- 9.1 TotalEnergies
- 9.2 Agrivoltaic Solution LLC
- 9.3 Cero Generation Limited
- 9.4 Sun’Agr
- 9.5 iSun, Inc.
- 9.6 REM TEC
- 9.7 Trina Solar
- 9.8 Jinko Solar
- 9.9 VALOREM
- 9.10 SunPower Corporation
- 9.11 Next2Sun
- 9.12 Enel Spa
- 9.13 Solaria
- 9.14 Waaree Energies Ltd.
- 9.15 Insolight
- 9.16 Vattenfall AB
- 9.17 Chint New Energy Technology Co., Ltd.
 2026年全球農電市場報告
 農用電動工具市場:按類型、系統設計、組件、作物類型、農場類型和應用分類-2026-2032年全球市場預測2026年全球農場太陽能發電市場報告
 Agrivoltix市場分析及至2035年預測:按類型、產品、服務、技術、組件、應用、安裝類型、最終用戶和功能分類
 農光互補:市場佔有率分析、產業趨勢與統計、成長預測(2026-2031)
 全球農光互補市場(至 2035 年):依系統設計類型、技術類型、作物類型、安裝類型、應用類型、地區、產業趨勢與預測
 農業太陽能市場-全球產業規模、佔有率、趨勢、機會及預測(按陣列配置、太陽能電池技術、安裝地點、地區和競爭格局分類,2021-2031年)
 農光互補市場規模、佔有率和成長分析(按系統設計、作物類型、安裝方式、材料類型、電池類型和地區分類)-2026-2033年產業預測
 全球農光電市場
 農業光電市場:依系統類型、電池類型、作物類型、地區、機會、預測,2018-2032年