


 |
市場調查報告書
商品編碼
1698514
奈米光子學市場機會、成長動力、產業趨勢分析及 2025-2034 年預測Nanophotonics Market Opportunity, Growth Drivers, Industry Trend Analysis, and Forecast 2025-2034 |
||||||
全球奈米光子學市場價值 2024 年為 205 億美元,預計在高速資料傳輸、節能解決方案和量子運算的推動下,2025 年至 2034 年期間將以 16% 的複合年成長率強勁擴張。隨著各行各業擴大採用奈米光子學來增強光學性能、提高運算速度並最大限度地降低功耗,該技術在各個領域變得不可或缺。
隨著對高性能通訊網路的需求不斷成長,奈米光子學在提高資料傳輸速率同時減少延遲方面發揮著至關重要的作用。在奈米尺度上操縱光的能力正在徹底改變光學設備、半導體應用和生物感測技術。政府和私人組織正大力投資研發,探索奈米光子學的新應用,進一步推動市場成長。此外,向永續解決方案的持續轉變正在加速節能奈米光子 LED、光伏電池和光學放大器的採用。人們對奈米光子學在提高設備效率方面的好處的認知不斷提高,加上支持創新的有利監管政策,預計將為市場參與者創造豐厚的機會。
| 市場範圍 | |
|---|---|
| 起始年份 | 2024 |
| 預測年份 | 2025-2034 |
| 起始值 | 205億美元 |
| 預測值 | 888億美元 |
| 複合年成長率 | 16% |
市場依材料分為奈米帶、等離子體、光子晶體、奈米管、量子點等。量子點成為一個關鍵領域,2023 年創造了 41 億美元的收入。其卓越的光學特性、高量子效率和可調的發射特性正在推動各行業的應用,尤其是在顯示技術和醫學成像領域。量子點廣泛應用於高解析度顯示器、先進感測器和光電設備,成為不斷發展的半導體產業的首選。量子點合成和整合領域的持續創新有望開啟新的應用,增強其市場地位。
根據應用,奈米光子學市場分為 OLED、LED、近場光學、光伏電池、光放大器、光開關等。受節能照明解決方案需求不斷成長的推動,LED 領域到 2024 年將佔據總市場佔有率的 24.3%。隨著各行各業向永續照明技術轉型,奈米光子 LED 在消費性電子、汽車照明和智慧城市基礎設施領域越來越受到關注。它們能夠延長使用壽命、降低能耗、並提供卓越的亮度,進一步促進其普及。此外,奈米光子技術在 OLED 顯示器和光開關中的整合正在提高性能並拓寬其商業應用。
2024 年,北美以 35.8% 的市佔率引領全球奈米光子學市場。該地區是奈米材料技術進步和先驅研究的中心。在先進光學技術和量子運算不斷發展的推動下,美國正在經歷強勁成長。表面增強光學應用,特別是在生物感測和化學分析領域的應用,由於廣泛的研究計劃而發展勢頭強勁。此外,主要行業參與者的存在以及學術機構和科技公司之間的合作正在鞏固北美在市場上的主導地位。隨著對高速、低功耗光學解決方案的需求不斷成長,奈米光子學領域將在未來幾年實現大幅擴張。
目錄
第1章:方法論與範圍
- 市場範圍和定義
- 基礎估算與計算
- 預測計算
- 資料來源
- 基本的
- 次要
- 付費來源
- 公共資源
第2章:執行摘要
第3章:行業洞察
- 產業生態系統分析
- 影響價值鏈的因素
- 利潤率分析
- 中斷
- 未來展望
- 製造商
- 經銷商
- 供應商格局
- 利潤率分析
- 重要新聞和舉措
- 監管格局
- 衝擊力
- 成長動力
- 高速資料傳輸的需求不斷增加
- 消費性電子產品的成長
- 先進感測器的開發
- 日益關注永續技術
- 產業陷阱與挑戰
- 研發成本高
- 複雜的製造程序
- 成長動力
- 成長潛力分析
- 波特的分析
- PESTEL 分析
第4章:競爭格局
- 介紹
- 公司市佔率分析
- 競爭定位矩陣
- 戰略展望矩陣
第5章:市場估計與預測:依材料,2021-2034
- 主要趨勢
- 電漿
- 光子晶體
- 奈米管
- 奈米帶
- 量子點
- 其他
第6章:市場估計與預測:按應用,2021-2034
- 主要趨勢
- 引領
- OLED
- 近場光學
- 光伏電池
- 光放大器
- 光開關
- 其他
第7章:市場估計與預測:按最終用途產業,2021-2034 年
- 主要趨勢
- 電信
- 消費性電子產品
- 能源
- 航太與國防
- 衛生保健
- 其他
第8章:市場估計與預測:按地區,2021-2034
- 主要趨勢
- 北美洲
- 美國
- 加拿大
- 歐洲
- 英國
- 德國
- 法國
- 義大利
- 西班牙
- 俄羅斯
- 亞太地區
- 中國
- 印度
- 日本
- 韓國
- 澳洲
- 拉丁美洲
- 巴西
- 墨西哥
- 中東及非洲
- 南非
- 沙烏地阿拉伯
- 阿拉伯聯合大公國
第9章:公司簡介
- Anders Electronics PLC
- Cree Inc.
- Hamamatsu Photonics KK
- Intel Corporation
- Lumentum Holdings Inc.
- Lumileds Holding BV
- Merck Group
- Nanoco Group PLC
- NanoPhotonica, Inc.
- Nanosys Inc.
- OSRAM Opto Semiconductors GmbH
- Quantum Materials Corp.
- Samsung Electronics
- Schott AG
- Sharp Corporation
- Veeco Instruments Inc.
- WITec Wissenschaftliche Instrumente and Technologie GmbH
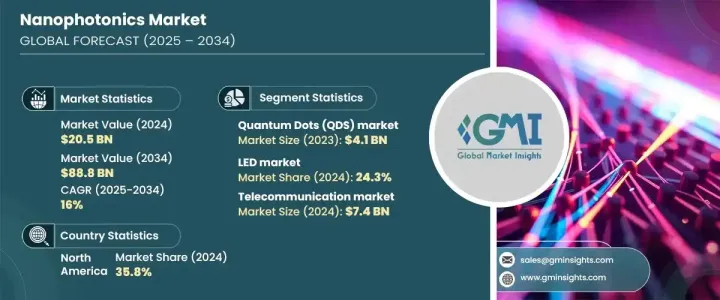
The Global Nanophotonics Market, valued at USD 20.5 billion in 2024, is projected to expand at a robust CAGR of 16% from 2025 to 2034, driven by advancements in high-speed data transmission, energy-efficient solutions, and quantum computing. As industries increasingly adopt nanophotonics to enhance optical performance, improve computational speeds, and minimize power consumption, the technology is becoming indispensable across various sectors.
With the rising demand for high-performance communication networks, nanophotonics is playing a crucial role in improving data transfer rates while reducing latency. The ability to manipulate light at the nanoscale is revolutionizing optical devices, semiconductor applications, and biosensing technologies. Governments and private organizations are investing heavily in research and development to explore new applications of nanophotonics, further propelling market growth. Additionally, the ongoing shift towards sustainable solutions is accelerating the adoption of energy-efficient nanophotonic-enabled LEDs, photovoltaic cells, and optical amplifiers. Increasing awareness about the benefits of nanophotonics in enhancing device efficiency, along with favorable regulatory policies supporting innovation, is expected to create lucrative opportunities for market players.
| Market Scope | |
|---|---|
| Start Year | 2024 |
| Forecast Year | 2025-2034 |
| Start Value | $20.5 Billion |
| Forecast Value | $88.8 Billion |
| CAGR | 16% |
The market is segmented by material into nanoribbons, plasmonic, photonic crystals, nanotubes, quantum dots, and others. Quantum dots emerged as a key segment, generating USD 4.1 billion in revenue in 2023. Their superior optical properties, high quantum efficiency, and tunable emission characteristics are driving adoption across industries, particularly in display technologies and medical imaging. Quantum dots are widely used in high-resolution displays, advanced sensors, and optoelectronic devices, making them a preferred choice in the evolving semiconductor industry. Ongoing innovations in quantum dot synthesis and integration are expected to unlock new applications, strengthening their market position.
By application, the nanophotonics market is classified into OLED, LED, near-field optics, photovoltaic cells, optical amplifiers, optical switches, and others. The LED segment accounted for 24.3% of the total market share in 2024, fueled by the growing demand for energy-efficient lighting solutions. As industries transition towards sustainable illumination technologies, nanophotonic-enabled LEDs are gaining traction in consumer electronics, automotive lighting, and smart city infrastructure. Their ability to offer extended lifespan, reduced energy consumption, and superior brightness is further contributing to increased adoption. Additionally, the integration of nanophotonic technology in OLED displays and optical switches is enhancing performance and broadening their commercial applications.
North America led the global nanophotonics market with a 35.8% share in 2024. The region is a hub for technological advancements and pioneering research in nanomaterials. The United States is witnessing strong growth, driven by increasing developments in advanced optical technologies and quantum computing. Surface-enhanced optical applications, particularly in biosensing and chemical analysis, are gaining momentum due to extensive research initiatives. Additionally, the presence of major industry players and collaborations between academic institutions and tech firms are reinforcing North America's dominant position in the market. As demand for high-speed, low-power optical solutions continues to rise, the nanophotonics sector is poised for significant expansion in the coming years.
Table of Contents
Chapter 1 Methodology & Scope
- 1.1 Market scope & definitions
- 1.2 Base estimates & calculations
- 1.3 Forecast calculations
- 1.4 Data sources
- 1.4.1 Primary
- 1.4.2 Secondary
- 1.4.2.1 Paid sources
- 1.4.2.2 Public sources
Chapter 2 Executive Summary
- 2.1 Industry synopsis, 2021-2034
Chapter 3 Industry Insights
- 3.1 Industry ecosystem analysis
- 3.1.1 Factor affecting the value chain
- 3.1.2 Profit margin analysis
- 3.1.3 Disruptions
- 3.1.4 Future outlook
- 3.1.5 Manufacturers
- 3.1.6 Distributors
- 3.2 Supplier landscape
- 3.3 Profit margin analysis
- 3.4 Key news & initiatives
- 3.5 Regulatory landscape
- 3.6 Impact forces
- 3.6.1 Growth drivers
- 3.6.1.1 Increasing demand for high-speed data transmission
- 3.6.1.2 Growth in consumer electronics
- 3.6.1.3 Development of advanced sensors
- 3.6.1.4 Increasing focus on sustainable technologies
- 3.6.2 Industry pitfalls & challenges
- 3.6.2.1 High cost of research and development
- 3.6.2.2 Complex manufacturing processes
- 3.6.1 Growth drivers
- 3.7 Growth potential analysis
- 3.8 Porter's analysis
- 3.9 PESTEL analysis
Chapter 4 Competitive Landscape, 2024
- 4.1 Introduction
- 4.2 Company market share analysis
- 4.3 Competitive positioning matrix
- 4.4 Strategic outlook matrix
Chapter 5 Market Estimates & Forecast, By Material, 2021-2034 (USD Million)
- 5.1 Key trends
- 5.2 Plasmonic
- 5.3 Photonic crystals
- 5.4 Nanotubes
- 5.5 Nanoribbons
- 5.6 Quantum dots
- 5.7 Others
Chapter 6 Market Estimates & Forecast, By Application, 2021-2034 (USD Million)
- 6.1 Key trends
- 6.2 LED
- 6.3 OLED
- 6.4 Near field optics
- 6.5 Photovoltaic cells
- 6.6 Optical amplifiers
- 6.7 Optical switches
- 6.8 Others
Chapter 7 Market Estimates & Forecast, By End Use Industry, 2021-2034 (USD Million)
- 7.1 Key trends
- 7.2 Telecommunication
- 7.3 Consumer electronics
- 7.4 Energy
- 7.5 Aerospace & defense
- 7.6 Healthcare
- 7.7 Others
Chapter 8 Market Estimates & Forecast, By Region, 2021-2034 (USD Million)
- 8.1 Key trends
- 8.2 North America
- 8.2.1 U.S.
- 8.2.2 Canada
- 8.3 Europe
- 8.3.1 UK
- 8.3.2 Germany
- 8.3.3 France
- 8.3.4 Italy
- 8.3.5 Spain
- 8.3.6 Russia
- 8.4 Asia Pacific
- 8.4.1 China
- 8.4.2 India
- 8.4.3 Japan
- 8.4.4 South Korea
- 8.4.5 Australia
- 8.5 Latin America
- 8.5.1 Brazil
- 8.5.2 Mexico
- 8.6 MEA
- 8.6.1 South Africa
- 8.6.2 Saudi Arabia
- 8.6.3 UAE
Chapter 9 Company Profiles
- 9.1 Anders Electronics PLC
- 9.2 Cree Inc.
- 9.3 Hamamatsu Photonics K.K.
- 9.4 Intel Corporation
- 9.5 Lumentum Holdings Inc.
- 9.6 Lumileds Holding B.V.
- 9.7 Merck Group
- 9.8 Nanoco Group PLC
- 9.9 NanoPhotonica, Inc.
- 9.10 Nanosys Inc.
- 9.11 OSRAM Opto Semiconductors GmbH
- 9.12 Quantum Materials Corp.
- 9.13 Samsung Electronics
- 9.14 Schott AG
- 9.15 Sharp Corporation
- 9.16 Veeco Instruments Inc.
- 9.17 WITec Wissenschaftliche Instrumente and Technologie GmbH
 全球光電市場規模、佔有率、趨勢和成長分析報告(2026-2034年)
 光電市場報告:按產品類型、光電材料、最終用途和地區分類(2026-2034 年)
 光電市場:2026-2032年全球市場按元件類型、技術、材料和應用分類的預測奈米光學市場規模、佔有率、成長及全球產業分析:按類型、應用和地區分類,並提供2026-2034年的洞察和預測
 2026年全球光電市場報告
 光電市場規模、佔有率和成長分析(按材料類型、應用、功能類型和地區分類)-2026-2033年產業預測全球奈米光子市場 - 全球產業分析、規模、佔有率、成長、趨勢、預測(2031)- 依產品、依原料、依應用、依地區