

 |
市場調查報告書
商品編碼
1698330
數位產品護照市場機會、成長動力、產業趨勢分析及 2025-2034 年預測Digital Product Passport Market Opportunity, Growth Drivers, Industry Trend Analysis, and Forecast 2025-2034 |
||||||
2024 年全球數位產品護照市場價值為 1.83 億美元,預計 2025 年至 2034 年的複合年成長率為 22.6%。對循環經濟原則的日益重視促使企業重新思考產品的設計、使用和處置。與傳統的線性生產和浪費模型不同,循環經濟注重最大限度地減少浪費和最大限度地重複使用材料。數位產品護照是這項轉變的核心,提供有關產品成分、來源和可回收性的全面資料。透過在整個生命週期中追蹤物品,這些護照使企業能夠開發更易於修復、再利用或回收的產品,從而符合全球永續發展目標。
由於透明度和可追溯性成為紡織、電子和汽車等行業的首要任務,世界各國政府正在實施嚴格的法規,以確保公司採用數位產品護照。歐盟已規定,到2026年,在其管轄範圍內銷售的所有產品都必須附有數位產品護照。這一監管轉變迫使企業整合能夠提供有關產品來源、環境足跡和永續性的詳細見解的技術,從而加強對不斷發展的行業標準的遵守。
| 市場範圍 | |
|---|---|
| 起始年份 | 2024 |
| 預測年份 | 2025-2034 |
| 起始值 | 1.83億美元 |
| 預測值 | 14億美元 |
| 複合年成長率 | 22.6% |
市場按組件細分為軟體和服務。 2024 年,軟體佔據主導地位,市場佔有率超過 60%,預計到 2034 年將超過 9 億美元。公司擴大部署軟體解決方案來簡化產品資訊管理。人工智慧和區塊鏈的融合對於提高這些解決方案的有效性起到了重要作用。人工智慧提高了資料分析能力,而區塊鏈則確保了記錄的安全和不可變,增強了透明度並降低了資料操縱的風險。
市場也根據組織規模分為中小型企業 (SME) 和大型企業。隨著製造業、汽車業和電子業等行業繼續投資數位產品護照解決方案,大型企業將在 2024 年佔據約 60% 的市場佔有率。這些投資提高了供應鏈的可視性,監控了產品生命週期,並確保遵守嚴格的永續法規。此外,企業優先考慮安全且可擴展的解決方案來保護產品資料並在全球營運中無縫整合數位產品護照。
數位產品護照具有多種功能,包括產品可追溯性、永續性和消費者參與度。 2024 年,法規合規性成為最重要的細分市場,貢獻了超過 5,000 萬美元的價值。各國政府正在為世界各地的產業制定更嚴格的法規,迫使企業採用記錄採購、回收和永續發展工作的可追溯性解決方案。歐盟作為其循環經濟行動計劃的一部分,對紡織等行業提出了必要的數位化要求,旨在改善環境影響評估並促進永續製造。
市場根據生命週期階段進一步分類,包括產品設計、分銷、生產和報廢管理。在監管壓力和永續發展措施的推動下,報廢產品領域到 2024 年將佔據約 30% 的市場佔有率。公司越來越需要記錄產品的處置和回收以滿足環境標準。向循環經濟的轉變提高了對產品生產和使用過程進行追蹤的解決方案的需求,以確保負責任的廢棄物管理和資源效率。
北美成為領先的區域市場,到 2024 年將佔據全球約 35% 的佔有率。美國處於領先地位,這得益於其在永續性和監管合規方面的大量投資。各行各業的公司正在迅速實施數位產品護照解決方案,以提高透明度、滿足行業法規並推動永續發展計畫。
目錄
第1章:方法論與範圍
- 研究設計
- 研究方法
- 資料收集方法
- 基礎估算與計算
- 基準年計算
- 市場評估的主要趨勢
- 預測模型
- 初步研究和驗證
- 主要來源
- 資料探勘來源
- 市場範圍和定義
第2章:執行摘要
第3章:行業洞察
- 產業生態系統分析
- 技術提供者
- 監管和認證機構
- 區塊鏈平台
- 最終用途
- 供應商格局
- 利潤率分析
- 技術與創新格局
- 專利分析
- 重要新聞和舉措
- 監管格局
- 數位產品護照案例研究
- 衝擊力
- 成長動力
- 監管要求不斷提高
- 消費者對透明度的需求日益增加
- 推動技術進步
- 擴大循環經濟舉措
- 產業陷阱與挑戰
- 數據標準化和互通性
- 實施成本和複雜性
- 成長動力
- 成長潛力分析
- 波特的分析
- PESTEL 分析
第4章:競爭格局
- 介紹
- 公司市佔率分析
- 競爭定位矩陣
- 戰略展望矩陣
第5章:市場估計與預測:按組件,2021 - 2034 年
- 主要趨勢
- 軟體
- 服務
- 諮詢
- 整合與部署
- 支援與維護
第6章:市場估計與預測:依組織規模,2021 - 2034 年
- 主要趨勢
- 中小企業
- 大型企業
第7章:市場估計與預測:按應用,2021 - 2034 年
- 主要趨勢
- 產品可追溯性
- 永續性
- 監理合規性
- 消費者參與
第8章:市場估計與預測:依垂直產業,2021 - 2034 年
- 主要趨勢
- 汽車
- 消費性電子產品
- 紡織品和服裝
- 製藥
- 食品和飲料
- 包裝
- 其他
第9章:市場估計與預測:依生命週期階段,2021 - 2034 年
- 主要趨勢
- 產品設計
- 分配
- 生產
- 生命終點
第10章:市場估計與預測:按地區,2021 - 2034 年
- 主要趨勢
- 北美洲
- 美國
- 加拿大
- 歐洲
- 英國
- 德國
- 法國
- 義大利
- 西班牙
- 俄羅斯
- 北歐人
- 亞太地區
- 中國
- 印度
- 日本
- 澳洲
- 韓國
- 東南亞
- 拉丁美洲
- 巴西
- 墨西哥
- 阿根廷
- 中東及非洲
- 阿拉伯聯合大公國
- 南非
- 沙烏地阿拉伯
第 11 章:公司簡介
- Avery Dennison
- Billon Group
- Circularise
- CIRPASS Consortium
- Det Norske Veritas Group (DNV)
- Eon
- Everledger
- Gemalto
- GS1
- IBM
- iPoint-systems
- Kezzler
- LyondellBasell
- Microsoft
- PSQR (Product Safety & Quality Right)
- R3
- SAP
- Siemens
- Spherity
- Zebra Technologies
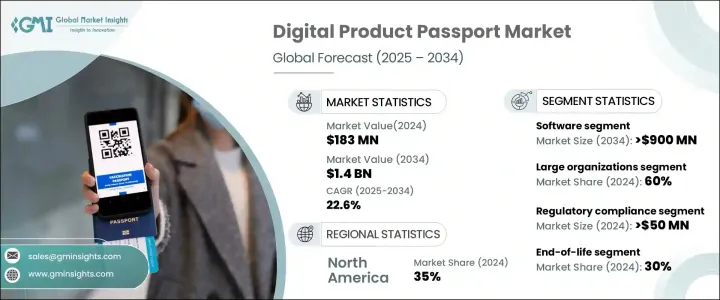
The Global Digital Product Passport Market was valued at USD 183 million in 2024 and is projected to grow at a CAGR of 22.6% from 2025 to 2034. The rising emphasis on circular economic principles is prompting businesses to rethink product design, usage, and disposal. Unlike the traditional linear model of production and waste, a circular economy focuses on minimizing waste and maximizing material reuse. Digital Product Passports are central to this transition, offering comprehensive data on a product's composition, sourcing, and recyclability. By tracking items throughout their lifecycle, these passports enable businesses to develop products that are easier to repair, reuse, or recycle, aligning with global sustainability goals.
Governments worldwide are enforcing strict regulations to ensure companies adopt digital product passports, as transparency and traceability become top priorities in industries such as textiles, electronics, and automotive. The European Union has mandated that all products sold within its jurisdiction must carry a Digital Product Passport by 2026. This regulatory shift is compelling businesses to integrate technologies that provide detailed insights into a product's origin, environmental footprint, and sustainability, reinforcing compliance with evolving industry standards.
| Market Scope | |
|---|---|
| Start Year | 2024 |
| Forecast Year | 2025-2034 |
| Start Value | $183 Million |
| Forecast Value | $1.4 Billion |
| CAGR | 22.6% |
The market is segmented by component into software and services. In 2024, software dominated, with over 60% of the market share, and is anticipated to surpass USD 900 million by 2034. Companies increasingly deploy software solutions to streamline product information management. The integration of artificial intelligence and blockchain has been instrumental in enhancing the effectiveness of these solutions. AI improves data analysis capabilities, while blockchain ensures secure and immutable records, strengthening transparency and reducing data manipulation risks.
The market is also categorized by organization size into small and medium enterprises (SME) and large corporations. Large enterprises held approximately 60% of the market share in 2024, as industries such as manufacturing, automotive, and electronics continue to invest in digital product passport solutions. These investments enhance supply chain visibility, monitor product life cycles, and ensure adherence to stringent sustainability regulations. Additionally, enterprises prioritize secure and scalable solutions to protect product data and integrate digital product passports seamlessly across global operations.
Digital product passports serve multiple functions, including product traceability, sustainability, and consumer engagement. In 2024, regulatory compliance represented the most significant market segment, contributing over USD 50 million in value. Governments are introducing stricter regulations for industries worldwide, compelling businesses to adopt traceability solutions that document sourcing, recycling, and sustainability efforts. The European Union, as part of its Circular Economy Action Plan, has introduced essential digital requirements for industries such as textiles, aiming to improve environmental impact assessments and promote sustainable manufacturing.
The market is further divided based on life cycle stages, including product design, distribution, production, and end-of-life management. The end-of-life segment accounted for around 30% of the market in 2024, driven by regulatory pressures and sustainability initiatives. Companies are increasingly required to document the disposal and recycling of products to meet environmental standards. The shift toward a circular economy has heightened demand for solutions that track products beyond production and usage, ensuring responsible waste management and resource efficiency.
North America emerged as the leading regional market, holding approximately 35% of the global share in 2024. The United States is at the forefront, driven by substantial investments in sustainability and regulatory compliance. Companies across various industries are swiftly implementing digital product passport solutions to enhance transparency, meet industry regulations, and advance sustainability initiatives.
Table of Contents
Chapter 1 Methodology & Scope
- 1.1 Research design
- 1.1.1 Research approach
- 1.1.2 Data collection methods
- 1.2 Base estimates & calculations
- 1.2.1 Base year calculation
- 1.2.2 Key trends for market estimation
- 1.3 Forecast model
- 1.4 Primary research and validation
- 1.4.1 Primary sources
- 1.4.2 Data mining sources
- 1.5 Market scope & definition
Chapter 2 Executive Summary
- 2.1 Industry synopsis, 2021 - 2034
Chapter 3 Industry Insights
- 3.1 Industry ecosystem analysis
- 3.1.1 Technology providers
- 3.1.2 Regulatory and certification bodies
- 3.1.3 Blockchain platforms
- 3.1.4 End use
- 3.2 Supplier landscape
- 3.3 Profit margin analysis
- 3.4 Technology & innovation landscape
- 3.5 Patent analysis
- 3.6 Key news & initiatives
- 3.7 Regulatory landscape
- 3.8 Case study of digital product passport
- 3.9 Impact forces
- 3.9.1 Growth drivers
- 3.9.1.1 Rising regulatory requirements
- 3.9.1.2 Increasing consumer demand for transparency
- 3.9.1.3 Advancing technological advancements
- 3.9.1.4 Expanding circular economy initiatives
- 3.9.2 Industry pitfalls & challenges
- 3.9.2.1 Data standardization and interoperability
- 3.9.2.2 Cost and complexity of implementation
- 3.9.1 Growth drivers
- 3.10 Growth potential analysis
- 3.11 Porter’s analysis
- 3.12 PESTEL analysis
Chapter 4 Competitive Landscape, 2024
- 4.1 Introduction
- 4.2 Company market share analysis
- 4.3 Competitive positioning matrix
- 4.4 Strategic outlook matrix
Chapter 5 Market Estimates & Forecast, By Component, 2021 - 2034 ($ Million)
- 5.1 Key trends
- 5.2 Software
- 5.3 Services
- 5.3.1 Consulting
- 5.3.2 Integration & deployment
- 5.3.3 Support & maintenance
Chapter 6 Market Estimates & Forecast, By Organization Size, 2021 - 2034 ($ Million)
- 6.1 Key trends
- 6.2 SME
- 6.3 Large enterprises
Chapter 7 Market Estimates & Forecast, By Application, 2021 - 2034 ($ Million)
- 7.1 Key trends
- 7.2 Product traceability
- 7.3 Sustainability
- 7.4 Regulatory compliance
- 7.5 Consumer engagement
Chapter 8 Market Estimates & Forecast, By Vertical, 2021 - 2034 ($ Million)
- 8.1 Key trends
- 8.2 Automotive
- 8.3 Consumer electronics
- 8.4 Textiles and apparel
- 8.5 Pharmaceuticals
- 8.6 Food & beverage
- 8.7 Packaging
- 8.8 Others
Chapter 9 Market Estimates & Forecast, By Lifecycle Stage, 2021 - 2034 ($ Million)
- 9.1 Key trends
- 9.2 Product design
- 9.3 Distribution
- 9.4 Production
- 9.5 End of life
Chapter 10 Market Estimates & Forecast, By Region, 2021 - 2034 ($ Million)
- 10.1 Key trends
- 10.2 North America
- 10.2.1 U.S.
- 10.2.2 Canada
- 10.3 Europe
- 10.3.1 UK
- 10.3.2 Germany
- 10.3.3 France
- 10.3.4 Italy
- 10.3.5 Spain
- 10.3.6 Russia
- 10.3.7 Nordics
- 10.4 Asia Pacific
- 10.4.1 China
- 10.4.2 India
- 10.4.3 Japan
- 10.4.4 Australia
- 10.4.5 South Korea
- 10.4.6 Southeast Asia
- 10.5 Latin America
- 10.5.1 Brazil
- 10.5.2 Mexico
- 10.5.3 Argentina
- 10.6 MEA
- 10.6.1 UAE
- 10.6.2 South Africa
- 10.6.3 Saudi Arabia
Chapter 11 Company Profiles
- 11.1 Avery Dennison
- 11.2 Billon Group
- 11.3 Circularise
- 11.4 CIRPASS Consortium
- 11.5 Det Norske Veritas Group (DNV)
- 11.6 Eon
- 11.7 Everledger
- 11.8 Gemalto
- 11.9 GS1
- 11.10 IBM
- 11.11 iPoint-systems
- 11.12 Kezzler
- 11.13 LyondellBasell
- 11.14 Microsoft
- 11.15 PSQR (Product Safety & Quality Right)
- 11.16 R3
- 11.17 SAP
- 11.18 Siemens
- 11.19 Spherity
- 11.20 Zebra Technologies
 數位產品護照合規市場預測至2034年:按產品、組件、技術、應用、最終用戶和地區分類的全球分析
 2026年全球數位產品護照(DPP)市場報告
 數位產品護照市場:按組件、產品生命週期階段、部署模式、應用和產業分類-2026-2032年全球預測
 全球數位產品護照市場:市場規模、佔有率和趨勢分析(按產品、部署方式、產業和地區分類),細分市場預測(2026-2033 年)
 數位健康路徑市場規模、佔有率和成長分析:按應用程式類型、技術類型、最終用戶細分、部署模式和地區分類 - 2026-2033 年產業預測
 數位產品護照軟體市場-全球產業規模、佔有率、趨勢、機會、預測:按部署方式、公司規模、產業、地區和競爭對手分類,2021-2031年2025年全球數位健康通行證市場報告全球數位產品護照市場:預測至 2032 年-按組件、部署方式、組織規模、應用、最終用戶和地區進行分析
 全球數位產品護照市場:市場規模、佔有率、趨勢分析(按部署方式、產品、產業和地區)、展望與未來預測(2025-2032 年)
 全球數位產品護照軟體市場