


 |
市場調查報告書
商品編碼
1685174
飲料包裝市場機會、成長動力、產業趨勢分析與 2025 - 2034 年預測Beverage Packaging Market Opportunity, Growth Drivers, Industry Trend Analysis, and Forecast 2025 - 2034 |
||||||
2024 年全球飲料包裝市場規模達 1,679 億美元,預估 2025 年至 2034 年期間複合年成長率為 5.3%。這一成長主要受消費者對永續和環保包裝解決方案需求不斷成長的推動。隨著環保意識的不斷增強,消費者和製造商都在不斷尋求傳統包裝方法的替代品。人們明顯在推動可回收、可生物分解或可重複使用的材料,從而推動企業創新並採用更永續的選擇。此外,即飲飲料的成長趨勢進一步促進了市場的擴張。人們對便利、便攜選擇的需求正在不斷成長,這種轉變正在影響飲料包裝產業。此外,包裝技術的進步正在提高效率並減少對環境的影響,提供的解決方案不僅輕巧、實用,而且還具有環保意識。這些發展有助於公司與永續發展目標保持一致,同時滿足具有環保意識的消費者不斷變化的需求。隨著全球監管壓力的增加,向環保包裝材料和技術的轉變預計將加速。
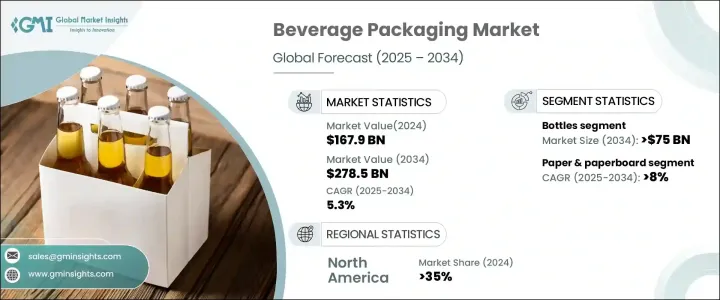
飲料包裝市場分為幾種產品類型,包括瓶子、罐子、紙盒、袋等。瓶子繼續佔據市場主導地位,預計到 2034 年將創造 750 億美元的市場價值。瓶子經久不衰的受歡迎程度得益於其多功能性、耐用性以及長時間保持飲料品質的能力。瓶子還具有便攜性和可重新密封的瓶蓋,這增加了便利性,特別是對於忙碌的消費者而言。隨著輕量和可回收 PET 瓶等創新的出現,這個細分市場符合永續發展目標,推動了有環保意識的購物者的需求增加。
| 市場範圍 | |
|---|---|
| 起始年份 | 2024 |
| 預測年份 | 2025-2034 |
| 起始值 | 1679億美元 |
| 預測值 | 2785億美元 |
| 複合年成長率 | 5.3% |
就材料而言,市場分為塑膠、玻璃、金屬、紙和紙板。其中,紙和紙板的成長速度最快,預計 2025 年至 2034 年期間的複合年成長率為 8%。這種快速成長歸因於人們擴大轉向永續替代品。隨著人們對塑膠廢物的擔憂日益加劇,消費者和品牌都開始選擇紙和紙板等環保材料。這些材料可生物分解且可回收,特別適合果汁和乳製品飲料等需要可再生和輕質包裝的產品。
在北美,飲料包裝市場在2024年佔全球佔有率的35%。美國對永續和便利包裝解決方案的需求正在快速成長。消費者越來越關注購買產品對環境的影響,進一步提高了對可回收和可生物分解包裝的需求。功能性飲料的激增和個性化包裝的興起進一步推動了市場的成長。此外,減少塑膠廢棄物和加強回收力度的監管壓力不斷增加,促使企業採用滿足這些新興偏好的新型包裝技術和設計。
目錄
第 1 章:方法論與範圍
- 市場範圍和定義
- 基礎估算與計算
- 預測計算
- 資料來源
- 基本的
- 次要
- 付費來源
- 公共資源
第 2 章:執行摘要
第 3 章:產業洞察
- 產業生態系統分析
- 影響價值鏈的因素
- 利潤率分析
- 中斷
- 未來展望
- 製造商
- 經銷商
- 重要新聞及舉措
- 監管格局
- 衝擊力
- 成長動力
- 都市化和可支配所得增加
- 消費者偏好美觀創新的包裝設計
- 即飲飲料和功能性飲料日益流行
- 消費者對方便攜帶的飲料包裝的需求不斷增加
- 對永續和環保包裝解決方案的需求不斷成長
- 產業陷阱與挑戰
- 原物料價格波動影響包裝成本
- 包裝材料和回收實踐的監管限制
- 成長動力
- 成長潛力分析
- 波特的分析
- PESTEL 分析
第4章:競爭格局
- 介紹
- 公司市佔率分析
- 競爭定位矩陣
- 戰略展望矩陣
第 5 章:市場估計與預測:按材料,2021 年至 2034 年
- 主要趨勢
- 塑膠
- 玻璃
- 金屬
- 紙和紙板
- 其他
第 6 章:市場估計與預測:按產品類型,2021-2034 年
- 主要趨勢
- 瓶子
- 罐頭
- 紙箱
- 袋裝
- 其他
第 7 章:市場估計與預測:按飲料類型,2021-2034 年
- 主要趨勢
- 酒精飲料
- 非酒精飲料
- 乳製品飲料
第 8 章:市場估計與預測:按地區,2021 年至 2034 年
- 主要趨勢
- 北美洲
- 美國
- 加拿大
- 歐洲
- 英國
- 德國
- 法國
- 義大利
- 西班牙
- 俄羅斯
- 亞太地區
- 中國
- 印度
- 日本
- 韓國
- 澳洲
- 拉丁美洲
- 巴西
- 墨西哥
- 中東及非洲
- 南非
- 沙烏地阿拉伯
- 阿拉伯聯合大公國
第9章:公司簡介
- Amcor
- Ardagh Group
- Ball Corporation
- Berry Global Group
- Can-Pack
- CCL Containers
- CPMC Holdings
- Crown Holdings
- Graham Packaging Company
- Graphic Packaging International
- Novelis
- Plastipak Holdings
- SIG
- Silgan Holdings
- Smurfit Kappa
- Stora Enso
- Tetra Pak International
- Visy Industries
- WestRock
The Global Beverage Packaging Market reached USD 167.9 billion in 2024 and is projected to expand at a CAGR of 5.3% from 2025 to 2034. This growth is primarily driven by rising consumer demand for sustainable and eco-friendly packaging solutions. As environmental awareness continues to grow, both consumers and manufacturers are increasingly seeking alternatives to traditional packaging methods. There is a clear push for recyclable, biodegradable, or reusable materials, leading companies to innovate and adopt more sustainable options. Additionally, the growing trend of ready-to-drink beverages further contributes to the market's expansion. The demand for convenient, on-the-go options is rising, and this shift is influencing the beverage packaging industry. Moreover, advancements in packaging technologies are improving efficiency and reducing environmental impact, offering solutions that are not only lightweight and functional but also environmentally conscious. These developments are helping companies stay aligned with sustainability goals while meeting the evolving demands of eco-conscious consumers. As regulatory pressures increase globally, the shift toward eco-friendly packaging materials and technologies is expected to accelerate.
The beverage packaging market is categorized into several product types, including bottles, cans, cartons, pouches, and others. Bottles continue to dominate the market and are projected to generate USD 75 billion by 2034. Their enduring popularity is due to their versatility, durability, and ability to preserve beverage quality over extended periods. Bottles also offer portability and resealable caps, which add convenience, especially for on-the-go consumers. With innovations such as lightweight and recyclable PET bottles, this segment aligns with sustainability goals, driving increased demand from environmentally conscious shoppers.
| Market Scope | |
|---|---|
| Start Year | 2024 |
| Forecast Year | 2025-2034 |
| Start Value | $167.9 Billion |
| Forecast Value | $278.5 Billion |
| CAGR | 5.3% |
When it comes to materials, the market is segmented into plastic, glass, metal, paper, and paperboard. Among these, paper and paperboard are experiencing the fastest growth, projected to rise at a CAGR of 8% between 2025 and 2034. This rapid growth is attributed to the increasing shift toward sustainable alternatives. With the growing concerns over plastic waste, consumers and brands alike are opting for eco-friendly materials like paper and paperboard. These materials are biodegradable and recyclable, making them particularly popular for products like juices and dairy beverages, where renewable and lightweight packaging is desired.
In North America, the beverage packaging market accounted for 35% of the global share in 2024. The U.S. is seeing rapid growth in demand for sustainable and convenient packaging solutions. Consumers are becoming more mindful of the environmental impact of their purchases, pushing the demand for recyclable and biodegradable packaging even higher. The surge in functional beverages and the rising trend for personalized packaging are further propelling market growth. Additionally, increasing regulatory pressures to reduce plastic waste and enhance recycling efforts are driving companies to adopt new packaging technologies and designs that meet these emerging preferences.
Table of Contents
Chapter 1 Methodology & Scope
- 1.1 Market scope & definitions
- 1.2 Base estimates & calculations
- 1.3 Forecast calculations
- 1.4 Data sources
- 1.4.1 Primary
- 1.4.2 Secondary
- 1.4.2.1 Paid sources
- 1.4.2.2 Public sources
Chapter 2 Executive Summary
- 2.1 Industry synopsis, 2022-2034
Chapter 3 Industry Insights
- 3.1 Industry ecosystem analysis
- 3.1.1 Factor affecting the value chain
- 3.1.2 Profit margin analysis
- 3.1.3 Disruptions
- 3.1.4 Future outlook
- 3.1.5 Manufacturers
- 3.1.6 Distributors
- 3.2 Key news & initiatives
- 3.3 Regulatory landscape
- 3.4 Impact forces
- 3.4.1 Growth drivers
- 3.4.1.1 Urbanization and rising disposable incomes
- 3.4.1.2 Consumer preference for aesthetic and innovative packaging designs
- 3.4.1.3 Rising popularity of ready-to-drink and functional beverages
- 3.4.1.4 Increased consumer demand for convenient, on-the-go beverage packaging
- 3.4.1.5 Rising demand for sustainable and environmentally friendly packaging solutions
- 3.4.2 Industry pitfalls & challenges
- 3.4.2.1 Volatility in raw material prices affecting packaging costs
- 3.4.2.2 Regulatory restrictions on packaging materials and recycling practices
- 3.4.1 Growth drivers
- 3.5 Growth potential analysis
- 3.6 Porter’s analysis
- 3.7 PESTEL analysis
Chapter 4 Competitive Landscape, 2024
- 4.1 Introduction
- 4.2 Company market share analysis
- 4.3 Competitive positioning matrix
- 4.4 Strategic outlook matrix
Chapter 5 Market Estimates & Forecast, By Material, 2021-2034 (USD Billion & Kilo Tons)
- 5.1 Key trends
- 5.2 Plastic
- 5.3 Glass
- 5.4 Metal
- 5.5 Paper & Paperboard
- 5.6 Others
Chapter 6 Market Estimates & Forecast, By Product Type, 2021-2034 (USD Billion & Kilo Tons)
- 6.1 Key trends
- 6.2 Bottles
- 6.3 Cans
- 6.4 Cartons
- 6.5 Pouches
- 6.6 Others
Chapter 7 Market Estimates & Forecast, By Beverages Type, 2021-2034 (USD Billion & Kilo Tons)
- 7.1 Key trends
- 7.2 Alcoholic beverages
- 7.3 Non-alcoholic beverages
- 7.4 Dairy beverages
Chapter 8 Market Estimates & Forecast, By Region, 2021-2034 (USD Billion & Kilo Tons)
- 8.1 Key trends
- 8.2 North America
- 8.2.1 U.S.
- 8.2.2 Canada
- 8.3 Europe
- 8.3.1 UK
- 8.3.2 Germany
- 8.3.3 France
- 8.3.4 Italy
- 8.3.5 Spain
- 8.3.6 Russia
- 8.4 Asia Pacific
- 8.4.1 China
- 8.4.2 India
- 8.4.3 Japan
- 8.4.4 South Korea
- 8.4.5 Australia
- 8.5 Latin America
- 8.5.1 Brazil
- 8.5.2 Mexico
- 8.6 MEA
- 8.6.1 South Africa
- 8.6.2 Saudi Arabia
- 8.6.3 UAE
Chapter 9 Company Profiles
- 9.1 Amcor
- 9.2 Ardagh Group
- 9.3 Ball Corporation
- 9.4 Berry Global Group
- 9.5 Can-Pack
- 9.6 CCL Containers
- 9.7 CPMC Holdings
- 9.8 Crown Holdings
- 9.9 Graham Packaging Company
- 9.10 Graphic Packaging International
- 9.11 Novelis
- 9.12 Plastipak Holdings
- 9.13 SIG
- 9.14 Silgan Holdings
- 9.15 Smurfit Kappa
- 9.16 Stora Enso
- 9.17 Tetra Pak International
- 9.18 Visy Industries
- 9.19 WestRock
 飲料包裝:市場佔有率分析、行業趨勢和統計數據、成長預測(2025-2030 年)
 酒精飲料包裝市場規模、佔有率和成長分析(按產品、材料、應用和地區)- 2025-2032 年產業預測
 2025 年酒精飲料包裝全球市場報告飲料包裝市場:依產品類型、應用和地區
 熱填充包裝市場報告:趨勢、預測和競爭分析(至 2031 年)
 飲料容器市場機會、成長動力、產業趨勢分析及 2025-2034 年預測飲料包裝市場規模、佔有率和成長分析(按材料、產品、數量、應用和地區)- 2025-2032 年行業預測軟性飲料包裝市場機會、成長動力、產業趨勢分析與預測 2025-2034中東和非洲軟性飲料包裝:市場佔有率分析、產業趨勢、成長預測(2025-2030)亞太地區飲料包裝:市場佔有率分析、產業趨勢、成長預測(2025-2030)