


 |
市場調查報告書
商品編碼
1684771
微型逆變器市場機會、成長動力、產業趨勢分析及 2024 - 2032 年預測Micro Inverter Market Opportunity, Growth Drivers, Industry Trend Analysis, and Forecast 2024 - 2032 |
||||||
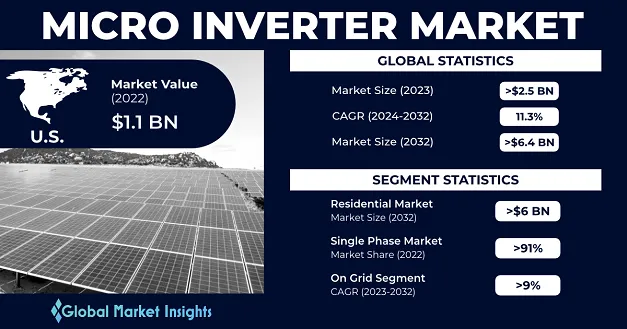
2023 年全球微型逆變器市場規模達 25 億美元,預計 2024 年至 2032 年的複合年成長率為 11.3%。微型逆變器是太陽能發電系統中的關鍵組件,可將單一太陽能板產生的直流電轉換為家庭和企業使用的交流電。與連接到整個太陽能板陣列的傳統逆變器不同,微型逆變器安裝在每個電池板上,從而實現最佳化能源生產。這種設計可以使面板面向不同方向或環境條件的系統獲得更好的性能,使微型逆變器成為住宅和商業安裝的首選。
再生能源的日益普及,加上太陽能技術的進步,推動了微型逆變器的需求。它們能夠提高能源效率、提高系統可靠性並提供即時監控,這使它們成為太陽能市場的關鍵解決方案。此外,對永續性的日益關注和政府對再生能源採用的激勵措施進一步推動了市場成長。隨著全球太陽能安裝量持續上升,微型逆變器市場預計將在預測期內大幅擴張。
| 市場範圍 | |
|---|---|
| 起始年份 | 2023 |
| 預測年份 | 2024-2032 |
| 起始值 | 25億美元 |
| 預測值 | 64.8億美元 |
| 複合年成長率 | 11.3% |
2022年,單相部分佔據91%的市場。該領域的微型逆變器允許每個太陽能電池板獨立運行,這不僅提高了能源效率,而且還能夠即時監控單個電池板的性能。此功能可確保更快地偵測故障並提高整個系統的可靠性。單相微型逆變器還可在較低的直流電壓下運行,從而提高安裝和維護期間的安全性。這些特點使它們特別適合住宅和小規模商業應用,從而推動了它們在各個地區的廣泛應用。
微型逆變器市場的住宅部分預計到 2032 年將創造 60 億美元。微型逆變器系統的靈活性使其成為不同大小和方向的屋頂安裝的理想選擇,使屋主可以自訂他們的太陽能裝置。這種適應性確保即使一個面板發生故障,各個面板仍能繼續運行,從而增強了系統的可靠性和彈性。由於電力成本上漲和環境問題,人們對住宅太陽能裝置的興趣日益濃厚,這是推動該領域成長的主要因素。越來越多的屋主將太陽能作為一種永續且經濟高效的解決方案,進一步推動了該領域對微型逆變器的需求。
2022 年美國微型逆變器市場產值將達到 11 億美元,反映出太陽能作為減少電費和促進環境永續性的手段越來越受歡迎。微型逆變器的技術進步提高了其效率並降低了成本,使其能夠被更廣泛的受眾所接受。政府激勵措施和支持再生能源應用的政策也在推動市場發展方面發揮著至關重要的作用。隨著住宅太陽能市場不斷擴大,美國對微型逆變器解決方案的需求預計將大幅成長,以鞏固該國作為全球市場主要參與者的地位。
目錄
第 1 章:方法論與範圍
- 市場範圍和定義
- 市場估計和預測參數
- 研究原理
- 預測計算
- 資料來源
- 基本的
- 次要
- 有薪資的
- 民眾
第 2 章:執行摘要
第 3 章:微型逆變器產業洞察
- 產業生態系統分析
- 供應商矩陣
- 監管格局
- 北美洲
- 美國
- 美國國家消防協會 (NFPA)
- UL 1741 標準
- IEEE 1547-2018
- IEC 62109 標準
- 聯邦投資稅收抵免(ITC)
- 加拿大
- 加拿大電氣規範 (CEC)
- 美國
- 歐洲
- 德國
- VDE AR-N 4105
- BDEW 中壓指令
- DIN VDE 0100-551
- 波蘭
- 奧地利
- 英國
- 法國
- 德國
- 亞太地區
- 中國
- 澳洲
- AS/NZS 5033:2021
- 印度
- 日本
- 中東和非洲
- 埃及
- 拉丁美洲
- 巴西
- ICMS 會議 16/2015
- 智利
- 墨西哥
- 巴西
- 北美洲
- 產業衝擊力
- 成長動力
- 提高產量和成本效益
- 對永續能源的監管傾向有利
- 對清潔能源持樂觀態度
- 大規模再生能源併網
- 產業陷阱與挑戰
- 輔助科技的可用性
- 成長動力
- 成長潛力分析
- 波特的分析
- PESTEL 分析
第 4 章:競爭性基準化分析
- 2022 年競爭格局
- 策略儀表板
- Enphase Energy
- Altenergy Power System Inc.
- Sensata Technologies, Inc.
- Solar Edge Technologies Inc
- Northern Electric Power Technology Inc.
- Sparq Systems
- SMA Solar Technology AG
- Hoymiles
- TSUNESS Co., Ltd.
- 策略儀表板
- 創新與永續發展格局
- FIMER 集團
- Enphase 能源
- 昱能電力系統股份有限公司
- 北方電力技術有限公司
- SMA 太陽能科技股公司
- Sparq 系統
- 霍伊邁爾斯
第 5 章:微型逆變器市場:依階段
- 關鍵階段趨勢
- 單相
- 三相
第 6 章:微型逆變器市場:依連接性
- 關鍵連線趨勢
- 獨立
- 在電網上
第7章:微型逆變器市場:依應用
- 主要應用趨勢
- 住宅
- 商業的
第 8 章:微型逆變器市場:按地區
- 主要區域趨勢
- 北美洲
- 北美市場,2019 - 2032 年
- 2019 年至 2032 年北美市場分階段狀況
- 2019 年至 2032 年北美市場連結性狀況
- 2019 年至 2032 年北美市場依應用分類
- 美國
- 美國市場,2019 - 2032 年
- 2019 年至 2032 年美國市場分階段狀況
- 2019 年至 2032 年美國連結市場狀況
- 2019 年至 2032 年美國市場應用狀況
- 加拿大
- 加拿大市場,2019 - 2032 年
- 2019 年至 2032 年加拿大市場分階段狀況
- 2019 年至 2032 年加拿大市場連通性狀況
- 2019 年至 2032 年加拿大市場應用狀況
- 歐洲
- 歐洲市場,2019 - 2032 年
- 2019 年至 2032 年歐洲市場分階段狀況
- 2019 年至 2032 年歐洲市場連通性狀況
- 2019 年至 2032 年歐洲市場應用狀況
- 德國
- 德國市場,2019 - 2032 年
- 2019 年至 2032 年德國市場分階段狀況
- 2019 年至 2032 年德國連通性市場狀況
- 2019 年至 2032 年德國市場應用狀況
- 義大利
- 義大利市場,2019 - 2032 年
- 2019 年至 2032 年義大利市場分階段狀況
- 2019 年至 2032 年義大利市場連通性狀況
- 2019 年至 2032 年義大利市場應用狀況
- 波蘭
- 波蘭市場,2019 - 2032 年
- 2019 年至 2032 年波蘭市場分階段狀況
- 2019 年至 2032 年波蘭市場連通性狀況
- 2019 年至 2032 年波蘭市場應用狀況
- 荷蘭
- 荷蘭市場,2019 - 2032 年
- 2019 年至 2032 年荷蘭市場分階段狀況
- 2019 年至 2032 年荷蘭市場連通性狀況
- 2019 年至 2032 年荷蘭市場應用狀況
- 奧地利
- 奧地利市場,2019 - 2032 年
- 2019 年至 2032 年奧地利市場分階段狀況
- 2019 年至 2032 年奧地利連通性市場狀況
- 2019 年至 2032 年奧地利市場應用狀況
- 英國
- 英國市場,2019 - 2032 年
- 2019 年至 2032 年英國市場分階段狀況
- 2019 年至 2032 年英國市場連通性狀況
- 2019 年至 2032 年英國市場應用狀況
- 法國
- 法國市場,2019 - 2032 年
- 2019 年至 2032 年法國市場分階段狀況
- 2019 年至 2032 年法國市場連通性狀況
The Global Micro Inverter Market reached USD 2.5 billion in 2023 and is projected to grow at a CAGR of 11.3% from 2024 to 2032. Microinverters are critical components in solar power systems, converting DC generated by individual solar panels into AC for use in homes and businesses. Unlike traditional inverters that connect to an entire solar panel array, microinverters are installed on each panel, enabling optimized energy production. This design allows for better performance in systems where panels face varying orientations or environmental conditions, making microinverters a preferred choice for residential and commercial installations.
The growing adoption of renewable energy, coupled with advancements in solar technology, is driving the demand for microinverters. Their ability to enhance energy efficiency, improve system reliability, and provide real-time monitoring has positioned them as a key solution in the solar energy market. Additionally, the increasing focus on sustainability and government incentives for renewable energy adoption are further fueling market growth. As solar installations continue to rise globally, the micro inverter market is expected to witness significant expansion during the forecast period.
| Market Scope | |
|---|---|
| Start Year | 2023 |
| Forecast Year | 2024-2032 |
| Start Value | $2.5 Billion |
| Forecast Value | $6.48 Billion |
| CAGR | 11.3% |
In 2022, the single-phase segment accounted for 91% of the market share. Microinverters in this segment allow each solar panel to operate independently, which not only increases energy efficiency but also enables real-time monitoring of individual panel performance. This capability ensures quicker fault detection and enhances overall system reliability. Single-phase microinverters also operate at lower DC voltages, improving safety during installation and maintenance. These features make them particularly appealing for residential and small-scale commercial applications, driving their widespread adoption across various regions.
The residential segment of the micro inverter market is anticipated to generate USD 6 billion by 2032. The flexibility of microinverter systems makes them ideal for rooftop installations of different sizes and orientations, allowing homeowners to customize their solar setups. This adaptability ensures that individual panels can continue functioning even if one panel fails, enhancing the system's reliability and resilience. The growing interest in residential solar installations, driven by rising electricity costs and environmental concerns, is a major factor contributing to the segment's growth. Homeowners are increasingly turning to solar energy as a sustainable and cost-effective solution, further boosting the demand for micro inverters in this segment.
U.S. micro inverter market generated USD 1.1 billion in 2022, reflecting the increasing popularity of solar power as a means to reduce electricity bills and promote environmental sustainability. Technological advancements in microinverters have improved their efficiency and reduced costs, making them more accessible to a broader audience. Government incentives and policies supporting renewable energy adoption are also playing a crucial role in driving the market. As the residential solar market continues to expand, the demand for microinverter solutions in the United States is expected to grow significantly, solidifying the country's position as a key player in the global market.
Table of Contents
Chapter 1 Methodology & Scope
- 1.1 Market scope & definitions
- 1.2 Market estimates and forecast parameters
- 1.3 Research Rationale
- 1.4 Forecast calculations
- 1.5 Data sources
- 1.5.1 Primary
- 1.5.2 Secondary
- 1.5.2.1 Paid
- 1.5.2.2 Public
Chapter 2 Executive Summary
- 2.1 Micro inverter industry 3600 synopsis, 2019 - 2032
- 2.1.1 Business trends
- 2.1.2 Phase trends
- 2.1.3 Connectivity trends
- 2.1.4 Application trends
- 2.1.5 Regional trends
Chapter 3 Micro Inverter Industry Insights
- 3.1 Industry ecosystem analysis
- 3.1.1 Vendor Matrix
- 3.2 Regulatory landscape
- 3.2.1 North America
- 3.2.1.1 U.S.
- 3.2.1.1.1 National Fire Protection Association (NFPA)
- 3.2.1.1.2 UL 1741 Standard
- 3.2.1.1.3 IEEE 1547-2018
- 3.2.1.1.4 IEC 62109 Standard
- 3.2.1.1.5 Federal Investment Tax Credit (ITC)
- 3.2.1.2 Canada
- 3.2.1.2.1 Canadian Electrical Code (CEC)
- 3.2.1.1 U.S.
- 3.2.2 Europe
- 3.2.2.1 Germany
- 3.2.2.1.1 VDE AR-N 4105
- 3.2.2.1.2 BDEW Medium Voltage Directive
- 3.2.2.1.3 DIN VDE 0100-551
- 3.2.2.2 Poland
- 3.2.2.3 Austria
- 3.2.2.4 UK
- 3.2.2.5 France
- 3.2.2.1 Germany
- 3.2.3 Asia Pacific
- 3.2.3.1 China
- 3.2.3.2 Australia
- 3.2.3.2.1 AS/NZS 5033:2021
- 3.2.3.3 India
- 3.2.3.4 Japan
- 3.2.4 Middle East & Africa
- 3.2.4.1 Egypt
- 3.2.5 Latin America
- 3.2.5.1 Brazil
- 3.2.5.1.1 Convenio ICMS 16/2015
- 3.2.5.2 Chile
- 3.2.5.3 Mexico
- 3.2.5.1 Brazil
- 3.2.1 North America
- 3.3 Industry impact forces
- 3.3.1 Growth drivers
- 3.3.1.1 Higher output and cost-efficiency
- 3.3.1.2 Favorable regulatory inclination toward sustainable energy
- 3.3.1.3 Positive outlook toward clean energy
- 3.3.1.4 Large-scale renewable integration
- 3.3.2 Industry pitfalls & challenges
- 3.3.2.1 Availability of auxiliary technologies
- 3.3.1 Growth drivers
- 3.4 Growth potential analysis
- 3.5 Porter's Analysis
- 3.5.1 Bargaining power of suppliers
- 3.5.2 Bargaining power of buyers
- 3.5.3 Threat of new entrants
- 3.5.4 Threat of substitutes
- 3.6 PESTEL Analysis
Chapter 4 Competitive Benchmarking
- 4.1 Competitive landscape, 2022
- 4.1.1 Strategy dashboard
- 4.1.1.1 Enphase Energy
- 4.1.1.1.1 Product deployment
- 4.1.1.1.2 Business expansion
- 4.1.1.1.3 Partnership
- 4.1.1.1.4 Acquisition
- 4.1.1.2 Altenergy Power System Inc.
- 4.1.1.2.1 Agreement
- 4.1.1.2.2 Collaboration
- 4.1.1.3 Sensata Technologies, Inc.
- 4.1.1.3.1 Mergers & Acquisitions
- 4.1.1.4 Solar Edge Technologies Inc
- 4.1.1.4.1 Agreement
- 4.1.1.4.2 Partnership
- 4.1.1.5 Northern Electric Power Technology Inc.
- 4.1.1.5.1 Expansion
- 4.1.1.6 Sparq Systems
- 4.1.1.6.1 Product Development
- 4.1.1.6.2 Agreement
- 4.1.1.7 SMA Solar Technology AG
- 4.1.1.7.1 Supply Order
- 4.1.1.7.2 Market Expansion
- 4.1.1.7.3 Partnership
- 4.1.1.7.4 Agreement
- 4.1.1.8 Hoymiles
- 4.1.1.8.1 Product development
- 4.1.1.9 TSUNESS Co., Ltd.
- 4.1.1.9.1 Product development
- 4.1.1.1 Enphase Energy
- 4.1.1 Strategy dashboard
- 4.2 Innovation & sustainability landscape
- 4.2.1 FIMER Group
- 4.2.2 Enphase Energy
- 4.2.3 Altenergy Power System Inc.
- 4.2.4 Northern Electric Power Technology Inc.
- 4.2.5 SMA Solar Technology AG
- 4.2.6 Sparq Systems
- 4.2.7 Hoymiles
Chapter 5 Micro Inverter Market, By Phase
- 5.1 Key phase trends
- 5.2 Single phase
- 5.2.1 Global market from single phase, 2019 - 2032
- 5.2.2 Global market from single phase, by region, 2019 - 2032
- 5.3 Three phase
- 5.3.1 Global market from three phase, 2019 - 2032
- 5.3.2 Global market from three phase, by region, 2019 - 2032
Chapter 6 Micro Inverter Market, By Connectivity
- 6.1 Key connectivity trends
- 6.2 Standalone
- 6.2.1 Global market from standalone, 2019 - 2032
- 6.2.2 Global market from standalone, by region, 2019 - 2032
- 6.3 On grid
- 6.3.1 Global market from on grid, 2019 - 2032
- 6.3.2 Global market from on grid, by region, 2019 - 2032
Chapter 7 Micro Inverter Market, By Application
- 7.1 Key application trends
- 7.2 Residential
- 7.2.1 Global market from residential, 2019 - 2032
- 7.2.2 Global market from residential, by region, 2019 - 2032
- 7.3 Commercial
- 7.3.1 Global market from commercial, 2019 - 2032
- 7.3.2 Global market from commercial, by region, 2019 - 2032
Chapter 8 Micro Inverter Market, By Region
- 8.1 Key regional trends
- 8.2 North America
- 8.2.1 North America market, 2019 – 2032
- 8.2.2 North America market by phase, 2019 – 2032
- 8.2.3 North America market by connectivity, 2019 – 2032
- 8.2.4 North America market by application, 2019 – 2032
- 8.2.5 U.S.
- 8.2.5.1 U.S. market, 2019 – 2032
- 8.2.5.2 U.S. market by phase, 2019 – 2032
- 8.2.5.3 U.S. market by connectivity, 2019 – 2032
- 8.2.5.4 U.S. market by application, 2019 – 2032
- 8.2.6 Canada
- 8.2.6.1 Canada market, 2019 – 2032
- 8.2.6.2 Canada market by phase, 2019 – 2032
- 8.2.6.3 Canada market by connectivity, 2019 – 2032
- 8.2.6.4 Canada market by application, 2019 – 2032
- 8.3 Europe
- 8.3.1 Europe market, 2019 – 2032
- 8.3.2 Europe market by phase, 2019 – 2032
- 8.3.3 Europe market by connectivity, 2019 – 2032
- 8.3.4 Europe market by application, 2019 – 2032
- 8.3.5 Germany
- 8.3.5.1 Germany market, 2019 – 2032
- 8.3.5.2 Germany market by phase, 2019 – 2032
- 8.3.5.3 Germany market by connectivity, 2019 – 2032
- 8.3.5.4 Germany market by application, 2019 – 2032
- 8.3.6 Italy
- 8.3.6.1 Italy market, 2019 – 2032
- 8.3.6.2 Italy market by phase, 2019 – 2032
- 8.3.6.3 Italy market by connectivity, 2019 – 2032
- 8.3.6.4 Italy market by application, 2019 – 2032
- 8.3.7 Poland
- 8.3.7.1 Poland market, 2019 – 2032
- 8.3.7.2 Poland market by phase, 2019 – 2032
- 8.3.7.3 Poland market by connectivity, 2019 – 2032
- 8.3.7.4 Poland market by application, 2019 – 2032
- 8.3.8 Netherlands
- 8.3.8.1 Netherlands market, 2019 – 2032
- 8.3.8.2 Netherlands market by phase, 2019 – 2032
- 8.3.8.3 Netherlands market by connectivity, 2019 – 2032
- 8.3.8.4 Netherlands market by application, 2019 – 2032
- 8.3.9 Austria
- 8.3.9.1 Austria market, 2019 – 2032
- 8.3.9.2 Austria market by phase, 2019 – 2032
- 8.3.9.3 Austria market by connectivity, 2019 – 2032
- 8.3.9.4 Austria market by application, 2019 – 2032
- 8.3.10 UK
- 8.3.10.1 UK market, 2019 – 2032
- 8.3.10.2 UK market by phase, 2019 – 2032
- 8.3.10.3 UK market by connectivity, 2019 – 2032
- 8.3.10.4 UK market by application, 2019 – 2032
- 8.3.11 France
- 8.3.11.1 France market, 2019 – 2032
- 8.3.11.2 France market by phase, 2019 – 2032
- 8.3.11.3 France market by connectivity, 2019 – 2032
 微型逆變器市場規模、佔有率和成長分析(按產品、通訊技術、類型、額定功率、連接類型、銷售管道、應用和地區)- 2025-2032 年產業預測
 2025 年微型逆變器全球市場報告
 微型逆變器:市場佔有率分析、產業趨勢與統計、成長預測(2025-2030 年)
 全球微型逆變器市場:按產品供應、按類型、按連接類型、按通訊技術、按額定功率、按分銷管道、按應用 - 2025-2030 年預測到 2030 年微型逆變器市場預測:按類型、額定功率、連接性別、銷售管道、技術、應用和地區進行全球分析
 單相戶用微型逆變器市場機會、成長動力、產業趨勢分析與 2024 年至 2032 年預測商用單相微型逆變器市場、機會、成長動力、產業趨勢分析與預測,2024-2032商用三相微型逆變器市場、機會、成長動力、產業趨勢分析與預測,2024-2032獨立微型逆變器市場規模 - 按階段(單相、三相)、按應用(住宅、商業)、按區域前景、應用潛力、競爭市場佔有率和預測,2024 年至 2032 年
 全球獨立微型逆變器市場研究報告 - 2024 年至 2032 年產業分析、規模、佔有率、成長、趨勢與預測