


 |
市場調查報告書
商品編碼
1684655
食品風味市場機會、成長動力、產業趨勢分析與預測,2025 - 2034 年Food Flavor Market Opportunity, Growth Drivers, Industry Trend Analysis, and Forecast, 2025 - 2034 |
||||||
2024 年全球食品香料市場價值達到 120 億美元,預計 2025 年至 2034 年期間將以 4.3% 的複合年成長率穩步成長。這種穩定成長的動力在於消費者對更健康、更天然的人工添加劑替代品的偏好不斷變化。隨著人們健康意識的增強,越來越多的消費者開始青睞源自植物和動物來源的天然香料。與通常與人工成分相關的合成香料相比,這些天然選擇被認為更健康。
對清潔標籤產品(成分錶透明的食品)的需求不斷成長,促進了這種轉變。此外,市場也受益於對永續性的更大關注,天然香料通常被視為更環保。隨著消費者尋求更高的透明度,他們要求產品採用更安全、更真實、更健康的成分來製作。全球各地政府部門的監管支持進一步推動了人們對自然選擇的追求,並鼓勵在食品中使用天然成分。
| 市場範圍 | |
|---|---|
| 起始年份 | 2024 |
| 預測年份 | 2025-2034 |
| 起始值 | 120億美元 |
| 預測值 | 182億美元 |
| 複合年成長率 | 4.3% |
食物過敏和敏感症的發生率不斷上升是推動天然香料流行的另一個因素,因為它們通常被認為是比合成香料更安全的替代品。全球對植物性和有機食品的需求不斷成長,也推動了人們對天然風味的興趣日益濃厚。消費者越來越尋求符合其不斷變化的飲食偏好的口味,推動公司不斷創新,推出更清潔、更健康的選擇。隨著注重健康的消費者的增多,這個市場趨勢沒有放緩的跡象。食品製造商預計將繼續轉向天然和清潔標籤產品,促使調味品公司提供多樣化的產品。
食品香料市場依香料種類分為天然香料及合成香料。 2024 年,合成香料佔據市場主導地位,創造 64 億美元的收入。它們的成本效益、一致性和較長的保存期限使其成為加工食品和飲料生產的熱門選擇。然而,消費者對天然和清潔標籤產品的偏好日益成長,為合成香料帶來了挑戰。消費者行為的轉變促進了混合口味的發展,結合了合成和天然成分的優點。
在口味類別方面,水果口味佔據領先地位,到 2024 年將佔據 34% 的市場。這種受歡迎程度可歸因於水果口味的天然甜味和多功能性,其用途廣泛,包括飲料、糖果、乳製品和零食。此外,消費者對異國水果和熱帶水果口味的興趣日益濃厚,反映了全球烹飪趨勢和不斷變化的口味偏好。
光是美國食品香料市場在 2024 年就創造了 33 億美元的收入,這得益於充滿活力和多樣化的消費者群體,他們日益尋求創新和個性化的香料解決方案。對清潔標籤和天然成分的需求不斷成長,加上簡便食品的興起,推動了該地區採用先進的調味技術。此外,行業領導者的強大影響力和在研發方面的大量投資支撐著美國市場的持續成長和主導地位。
目錄
第 1 章:方法論與範圍
- 市場範圍和定義
- 基礎估算與計算
- 預測計算
- 資料來源
- 基本的
- 次要
- 付費來源
- 公共資源
第 2 章:執行摘要
第 3 章:產業洞察
- 產業生態系統分析
- 影響價值鏈的因素
- 利潤率分析
- 中斷
- 未來展望
- 製造商
- 經銷商
- 供應商概況
- 利潤率分析
- 重要新聞及舉措
- 監管格局
- 衝擊力
- 成長動力
- 天然食品香料需求不斷成長
- 全球簡便食品的普及度不斷提高
- 飲料業領域的擴張
- 產業陷阱與挑戰
- 天然調味料成本高
- 成長動力
- 成長潛力分析
- 波特的分析
- PESTEL 分析
第4章:競爭格局
- 介紹
- 公司市佔率分析
- 競爭定位矩陣
- 戰略展望矩陣
第 5 章:市場規模與預測:按類型,2021-2034 年
- 主要趨勢
- 天然風味
- 合成香料
第 6 章:市場規模及預測:依口味,2021-2034 年
- 主要趨勢
- 水果
- 巧克力
- 香草
- 堅果
- 焦糖
- 其他
第 7 章:市場規模與預測:按應用,2021-2034 年
- 主要趨勢
- 飲料
- 乳製品
- 麵包和糖果
- 鹹味小吃
- 其他
第 8 章:市場規模與預測:按地區,2021-2034 年
- 主要趨勢
- 北美洲
- 美國
- 加拿大
- 歐洲
- 英國
- 德國
- 法國
- 義大利
- 西班牙
- 俄羅斯
- 亞太地區
- 中國
- 印度
- 日本
- 韓國
- 澳洲
- 拉丁美洲
- 巴西
- 墨西哥
- 中東及非洲
- 南非
- 沙烏地阿拉伯
- 阿拉伯聯合大公國
第9章:公司簡介
- BioSun 調味品和食品配料
- 多勒爾
- 弗拉瓦羅馬
- 水果蔬汁
- 奇華頓公司
- 黃金海岸配料
- 國際香精香料公司 (IFF)
- 凱裡集團
- MANE 香精香料製造商
- 麥考密克公司
- 自然香精有限公司
- Sensient 技術
- 德之馨股份有限公司
- 協同風味
- T.長谷川株式會社
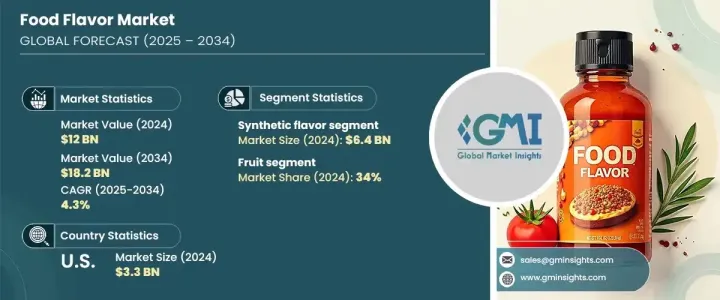
The Global Food Flavor Market reached a value of USD 12 billion in 2024 and is expected to grow at a steady CAGR of 4.3% from 2025 to 2034. This steady growth is driven by evolving consumer preferences for healthier, more natural alternatives to artificial additives. As awareness about health and wellness increases, more consumers are gravitating toward natural flavors derived from plant and animal sources. These natural options are viewed as healthier compared to synthetic flavors, which are often associated with artificial ingredients.
The rising demand for clean-label products-foods with transparent ingredient lists-is contributing to this shift. In addition, the market is benefiting from a greater focus on sustainability, with natural flavors often seen as more environmentally friendly. As consumers seek greater transparency, they're demanding products made with ingredients that are safer, more authentic, and healthier. This drive for natural options is being further fueled by regulatory support from authorities worldwide that encourage the use of naturally sourced ingredients in food products.
| Market Scope | |
|---|---|
| Start Year | 2024 |
| Forecast Year | 2025-2034 |
| Start Value | $12 Billion |
| Forecast Value | $18.2 Billion |
| CAGR | 4.3% |
The growing incidence of food allergies and sensitivities is another factor driving the popularity of natural flavors, as they are generally perceived as safer alternatives to synthetic options. The expanding global demand for plant-based and organic foods also supports the growing interest in naturally derived flavors. Consumers are increasingly seeking flavors that align with their evolving dietary preferences, pushing companies to innovate with cleaner, more wholesome options. With the rise in health-conscious consumers, this market trend shows no signs of slowing down. Food manufacturers are expected to continue shifting toward natural and clean-label products, prompting flavor companies to diversify their offerings.
The food flavor market is segmented by flavor type into natural and synthetic. In 2024, synthetic flavors dominated the market, generating USD 6.4 billion in revenue. Their cost-effectiveness, consistency, and long shelf life make them popular choices in processed food and beverage production. However, the growing consumer preference for natural and clean-label products is presenting challenges for synthetic flavors. This shift in consumer behavior has encouraged the development of hybrid flavors, combining the benefits of both synthetic and natural ingredients.
In terms of flavor categories, fruit flavors were the leading segment, accounting for 34% of the market share in 2024. This popularity can be attributed to the natural sweetness and versatility of fruit flavors, which are used in a wide range of applications, including beverages, confectionery, dairy, and snacks. Additionally, the increasing consumer interest in exotic and tropical fruit flavors is reflective of global culinary trends and evolving taste preferences.
The U.S. food flavor market alone generated USD 3.3 billion in 2024, driven by a dynamic and diverse consumer base that increasingly seeks innovative and personalized flavor solutions. The growing demand for clean-label and natural ingredients, combined with the rise of convenience foods, is fueling the adoption of advanced flavor technologies in the region. Furthermore, the strong presence of leading industry players and significant investments in research and development are supporting the U.S. market's ongoing growth and dominance.
Table of Contents
Chapter 1 Methodology & Scope
- 1.1 Market scope & definition
- 1.2 Base estimates & calculations
- 1.3 Forecast calculation
- 1.4 Data sources
- 1.4.1 Primary
- 1.4.2 Secondary
- 1.4.2.1 Paid sources
- 1.4.2.2 Public sources
Chapter 2 Executive Summary
- 2.1 Industry synopsis, 2021-2034
Chapter 3 Industry Insights
- 3.1 Industry ecosystem analysis
- 3.1.1 Factor affecting the value chain
- 3.1.2 Profit margin analysis
- 3.1.3 Disruptions
- 3.1.4 Future outlook
- 3.1.5 Manufacturers
- 3.1.6 Distributors
- 3.2 Supplier landscape
- 3.3 Profit margin analysis
- 3.4 Key news & initiatives
- 3.5 Regulatory landscape
- 3.6 Impact forces
- 3.6.1 Growth drivers
- 3.6.1.1 Rising demand for natural food flavors
- 3.6.1.2 Increased adoption of convenience foods globally
- 3.6.1.3 Expansion in the beverage industry sector
- 3.6.2 Industry pitfalls & challenges
- 3.6.2.1 High cost of natural flavor ingredients
- 3.6.1 Growth drivers
- 3.7 Growth potential analysis
- 3.8 Porter's analysis
- 3.9 PESTEL analysis
Chapter 4 Competitive Landscape, 2024
- 4.1 Introduction
- 4.2 Company market share analysis
- 4.3 Competitive positioning matrix
- 4.4 Strategic outlook matrix
Chapter 5 Market Size and Forecast, By Type, 2021-2034 (USD Billion) (Kilo Tons)
- 5.1 Key trends
- 5.2 Natural flavor
- 5.3 Synthetic flavor
Chapter 6 Market Size and Forecast, By Flavor, 2021-2034 (USD Billion) (Kilo Tons)
- 6.1 Key trends
- 6.2 Fruit
- 6.3 Chocolate
- 6.4 Vanilla
- 6.5 Nut
- 6.6 Caramel
- 6.7 Other
Chapter 7 Market Size and Forecast, By Application, 2021-2034 (USD Billion) (Kilo Tons)
- 7.1 Key trends
- 7.2 Beverages
- 7.3 Dairy products
- 7.4 Bakery and confectionery
- 7.5 Savory and snacks
- 7.6 Other
Chapter 8 Market Size and Forecast, By Region, 2021-2034 (USD Billion) (Kilo Tons)
- 8.1 Key trends
- 8.2 North America
- 8.2.1 U.S.
- 8.2.2 Canada
- 8.3 Europe
- 8.3.1 UK
- 8.3.2 Germany
- 8.3.3 France
- 8.3.4 Italy
- 8.3.5 Spain
- 8.3.6 Russia
- 8.4 Asia Pacific
- 8.4.1 China
- 8.4.2 India
- 8.4.3 Japan
- 8.4.4 South Korea
- 8.4.5 Australia
- 8.5 Latin America
- 8.5.1 Brazil
- 8.5.2 Mexico
- 8.6 MEA
- 8.6.1 South Africa
- 8.6.2 Saudi Arabia
- 8.6.3 UAE
Chapter 9 Company Profiles
- 9.1 BioSun Flavors & Food Ingredients
- 9.2 Doehler
- 9.3 Flavaroma
- 9.4 Frutarom
- 9.5 Givaudan S.A.
- 9.6 Gold Coast Ingredients
- 9.7 International Flavors and Fragrances (IFF)
- 9.8 Kerry Group plc
- 9.9 MANE Flavor & Fragrance Manufacturer
- 9.10 McCormick & Company, Inc.
- 9.11 Natures Flavors, Inc.
- 9.12 Sensient Technologies
- 9.13 Symrise AG
- 9.14 Synergy Flavors
- 9.15 T. Hasegawa Co., Ltd.
 食品香精市場分析及預測(至2035年):類型、產品類型、應用、形式、技術、最終用戶、製程、成分、功能、解決方案
 全球二甲基二硫市場規模、佔有率、趨勢和成長分析報告(2026-2034年)
 食品香精市場規模、佔有率和成長分析(按標籤/法規、形式、類型、應用和地區分類)-產業預測(2026-2033年)
 二甲基二硫(DMDS)的全球市場
 食品香料市場:按類別、香料類型、應用和地區分類
 食品香精市場 - 全球產業規模、佔有率、趨勢、機會和預測,按類型、按應用、按形式、按類別、按地區和競爭,2020-2030F全球食品香料市場食品香料市場:預測(2025-2030)全球食品香料市場研究報告 - 2024 年至 2032 年產業分析、規模、佔有率、成長、趨勢與預測
 食品香精市場報告:2030 年趨勢、預測與競爭分析