


 |
市場調查報告書
商品編碼
1666947
酚類抗氧化劑市場機會、成長動力、產業趨勢分析及 2025 - 2034 年預測Phenolic Antioxidants Market Opportunity, Growth Drivers, Industry Trend Analysis, and Forecast 2025 - 2034 |
||||||
2024 年全球酚類抗氧化劑市場規模達到 46 億美元,預計 2025 年至 2034 年期間複合年成長率將達到 5.8%。它們能夠增強產品穩定性、延長保存期限並改善性能,已成為現代製造業必不可少的原料。隨著消費者在日常選擇中擴大尋求更安全和更環保的選擇,對天然、清潔標籤和永續產品的需求不斷成長,進一步推動了市場的發展。這一趨勢強調了酚類抗氧化劑在滿足不斷變化的消費者偏好和工業需求方面日益成長的重要性。
市場對天然酚類抗氧化劑的偏好不斷成長,推動了市場的發展,預計到 2034 年將產生 58 億美元的產值,複合年成長率為 5.4%。來自植物(包括草藥、香料和水果)的天然抗氧化劑因符合健康、永續性和無毒成分趨勢而廣泛採用。隨著消費者優先考慮健康益處和環保產品,對這些植物解決方案的需求持續上升。這種轉變反映了人們越來越傾向於使用天然保健產品,強調清潔標籤成分,以滿足現代人對整體健康和生態意識的重視。
| 市場範圍 | |
|---|---|
| 起始年份 | 2024 |
| 預測年份 | 2025-2034 |
| 起始值 | 46億美元 |
| 預測值 | 81億美元 |
| 複合年成長率 | 5.8% |
單功能抗氧化劑在 2024 年佔據市場主導地位,佔有 44.3% 的佔有率,創收 21 億美元。這些抗氧化劑因其防止氧化和延長產品保存期限的能力而受到重視,預計在預測期內的複合年成長率為 5.2%。然而,對雙功能抗氧化劑的需求正在加速成長,因為其具有防止氧化和紫外線傷害的雙重功效,在化妝品和製藥行業中尤為受重視。同時,多功能抗氧化劑也越來越受到人們的青睞,因為它們具有抗衰老、耐腐蝕和防腐等多種優點,滿足了不同應用對多功能高效解決方案的需求。
到 2034 年,美國酚類抗氧化劑市場規模預計將達到 21 億美元,複合年成長率為 4.9%。食品飲料、個人護理和工業領域不斷成長的需求推動了這一成長。在食品業,消費者正在轉向天然成分,青睞植物性產品和清潔標籤產品。同時,化妝品行業正在採用先進的抗氧化劑來滿足日益成長的抗衰老和皮膚保護解決方案的需求。預計這些趨勢將在未來幾年維持美國市場的強勁成長,鞏固其在全球市場的重要地位。
目錄
第 1 章:方法論與範圍
- 市場範圍和定義
- 基礎估算與計算
- 預測計算
- 資料來源
- 基本的
- 次要
- 付費來源
- 公共資源
第 2 章:執行摘要
第 3 章:產業洞察
- 產業生態系統分析
- 影響價值鏈的因素
- 利潤率分析
- 中斷
- 未來展望
- 製造商
- 經銷商
- 供應商概況
- 利潤率分析
- 重要新聞及舉措
- 監管格局
- 衝擊力
- 產業衝擊力
- 成長動力
- 食品飲料產業需求不斷成長
- 擴大化妝品和個人護理產品的應用
- 不斷成長的汽車和工業應用
- 市場挑戰
- 與化學品使用相關的環境和監管問題
- 成長動力
- 法規和市場影響
- 波特的分析
- PESTEL 分析
第4章:競爭格局
- 介紹
- 公司市佔率分析
- 競爭定位矩陣
- 戰略展望矩陣
第 5 章:市場規模與預測:按來源,2021-2034 年
- 主要趨勢
- 自然的
- 合成的
第 6 章:市場規模與預測:按類型,2021-2034 年
- 主要趨勢
- 單功能
- 雙功能
- 多功能的
第 7 章:市場規模與預測:依形式,2021-2034 年
- 主要趨勢
- 液體
- 顆粒
- 粉末
第 8 章:市場規模與預測:按應用,2021-2034 年
- 主要趨勢
- 塑膠和橡膠
- 燃料和潤滑油
- 化妝品和個人護理
- 食品及飼料添加劑
- 其他
第 9 章:市場規模與預測:按地區,2021-2034 年
- 主要趨勢
- 北美洲
- 美國
- 加拿大
- 歐洲
- 英國
- 德國
- 法國
- 義大利
- 西班牙
- 俄羅斯
- 亞太地區
- 中國
- 印度
- 日本
- 韓國
- 澳洲
- 拉丁美洲
- 巴西
- 墨西哥
- 中東及非洲
- 南非
- 沙烏地阿拉伯
- 阿拉伯聯合大公國
第10章:公司簡介
- Afton Chemical
- Adeka Corporation
- Addivant
- BASF SE
- Chitec
- Clariant International AG
- Dorf Ketal
- Dover Chem
- Eastman Chemical Company
- Lanxess AG
- Lubrizol Corporation
- Mayzo Inc
- OXIRIS
- SI Group
- Songwon Industrial
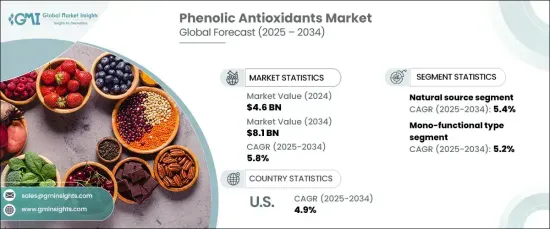
The Global Phenolic Antioxidants Market reached USD 4.6 billion in 2024 and is projected to grow at an impressive CAGR of 5.8% from 2025 to 2034. Phenolic antioxidants play a critical role in protecting products from oxidative damage, making them indispensable across industries such as food, cosmetics, and pharmaceuticals. Their ability to enhance product stability, extend shelf life, and improve performance has positioned them as essential ingredients in modern manufacturing. The growing demand for natural, clean-label, and sustainable products has further propelled the market, as consumers increasingly seek safer and eco-friendly options in their everyday choices. This trend underscores the expanding importance of phenolic antioxidants in addressing evolving consumer preferences and industrial needs.
The market's momentum is fueled by the surging preference for natural phenolic antioxidants, expected to generate USD 5.8 billion by 2034 with a CAGR of 5.4%. Natural antioxidants derived from plants, including herbs, spices, and fruits, are gaining widespread adoption due to their alignment with wellness, sustainability, and non-toxic ingredient trends. As consumers prioritize health benefits and environmentally responsible products, the demand for these plant-based solutions continues to rise. This transition reflects the broader movement toward natural health products, emphasizing clean-label ingredients that cater to the modern emphasis on holistic well-being and ecological consciousness.
| Market Scope | |
|---|---|
| Start Year | 2024 |
| Forecast Year | 2025-2034 |
| Start Value | $4.6 Billion |
| Forecast Value | $8.1 Billion |
| CAGR | 5.8% |
Mono-functional antioxidants dominated the market in 2024 with a commanding 44.3% share, generating USD 2.1 billion. These antioxidants, valued for their ability to prevent oxidation and prolong product longevity, are expected to grow at a CAGR of 5.2% during the forecast period. However, the demand for bi-functional antioxidants is accelerating, driven by their dual capabilities, such as protecting against oxidation and UV damage, which are particularly valued in the cosmetics and pharmaceutical industries. Meanwhile, multi-functional antioxidants are gaining traction as they offer a combination of benefits, including anti-aging properties, corrosion resistance, and preservation, meeting the need for versatile and efficient solutions across diverse applications.
The U.S. phenolic antioxidants market is set to reach USD 2.1 billion by 2034, growing at a CAGR of 4.9%. Increasing demand across the food and beverage, personal care, and industrial sectors is driving this growth. In the food industry, consumers are shifting toward natural ingredients, favoring plant-based and clean-label products. Concurrently, the cosmetics sector is embracing advanced antioxidants to cater to the rising demand for anti-aging and skin protection solutions. These trends are expected to sustain robust growth in the U.S. market over the coming years, solidifying its position as a key player in the global landscape.
Table of Contents
Chapter 1 Methodology & Scope
- 1.1 Market scope & definition
- 1.2 Base estimates & calculations
- 1.3 Forecast calculation
- 1.4 Data sources
- 1.4.1 Primary
- 1.4.2 Secondary
- 1.4.2.1 Paid sources
- 1.4.2.2 Public sources
Chapter 2 Executive Summary
- 2.1 Industry synopsis, 2021-2034
Chapter 3 Industry Insights
- 3.1 Industry ecosystem analysis
- 3.1.1 Factor affecting the value chain
- 3.1.2 Profit margin analysis
- 3.1.3 Disruptions
- 3.1.4 Future outlook
- 3.1.5 Manufacturers
- 3.1.6 Distributors
- 3.2 Supplier landscape
- 3.3 Profit margin analysis
- 3.4 Key news & initiatives
- 3.5 Regulatory landscape
- 3.6 Impact forces
- 3.7 Industry impact forces
- 3.7.1 Growth drivers
- 3.7.1.1 Rising Demand in Food and Beverage Industry
- 3.7.1.2 Expanding Cosmetic and Personal Care Applications
- 3.7.1.3 Growing automotive and industrial applications
- 3.7.2 Market challenges
- 3.7.2.1 Environmental and regulatory concerns related to chemical usage
- 3.7.1 Growth drivers
- 3.8 Regulations & market impact
- 3.9 Porter’s analysis
- 3.10 PESTEL analysis
Chapter 4 Competitive Landscape, 2024
- 4.1 Introduction
- 4.2 Company market share analysis
- 4.3 Competitive positioning matrix
- 4.4 Strategic outlook matrix
Chapter 5 Market Size and Forecast, By Source, 2021-2034 (USD Billion) (Kilo Tons)
- 5.1 Key trends
- 5.2 Natural
- 5.3 Synthetic
Chapter 6 Market Size and Forecast, By Type, 2021-2034 (USD Billion) (Kilo Tons)
- 6.1 Key trends
- 6.2 Mono-functional
- 6.3 Bi-functional
- 6.4 Multi-functional
Chapter 7 Market Size and Forecast, By Form, 2021-2034 (USD Billion) (Kilo Tons)
- 7.1 Key trends
- 7.2 Liquid
- 7.3 Granule
- 7.4 Powder
Chapter 8 Market Size and Forecast, By Application, 2021-2034 (USD Billion) (Kilo Tons)
- 8.1 Key trends
- 8.2 Plastic & rubber
- 8.3 Fuel & lubricants
- 8.4 Cosmetic & personal care
- 8.5 Food & feed additive
- 8.6 Others
Chapter 9 Market Size and Forecast, By Region, 2021-2034 (USD Billion) (Kilo Tons)
- 9.1 Key trends
- 9.2 North America
- 9.2.1 U.S.
- 9.2.2 Canada
- 9.3 Europe
- 9.3.1 UK
- 9.3.2 Germany
- 9.3.3 France
- 9.3.4 Italy
- 9.3.5 Spain
- 9.3.6 Russia
- 9.4 Asia Pacific
- 9.4.1 China
- 9.4.2 India
- 9.4.3 Japan
- 9.4.4 South Korea
- 9.4.5 Australia
- 9.5 Latin America
- 9.5.1 Brazil
- 9.5.2 Mexico
- 9.6 MEA
- 9.6.1 South Africa
- 9.6.2 Saudi Arabia
- 9.6.3 UAE
Chapter 10 Company Profiles
- 10.1 Afton Chemical
- 10.2 Adeka Corporation
- 10.3 Addivant
- 10.4 BASF SE
- 10.5 Chitec
- 10.6 Clariant International AG
- 10.7 Dorf Ketal
- 10.8 Dover Chem
- 10.9 Eastman Chemical Company
- 10.10 Lanxess AG
- 10.11 Lubrizol Corporation
- 10.12 Mayzo Inc
- 10.13 OXIRIS
- 10.14 SI Group
- 10.15 Songwon Industrial
 氨基酚市場分析及預測(2034年):類型、產品、應用、技術、組件、最終用戶、流程、功能、安裝類型、設備
 按生產流程和應用分類的壬烯市場 - 全球預測 2025-2032
 苯酚衍生物市場-全球產業規模、佔有率、趨勢、機會與預測,依衍生物、應用、地區與競爭細分,2020-2030 年
 苯酚衍生物市場:依衍生物、應用及地區分類全球氨基酚市場
 2025年全球氨基酚市場報告
 全球苯酚市場需求分析:依類型、應用、預測分析(2034年)2032 年對氨基苯酚預測:按形態、等級、銷售管道、應用和地區進行的全球分析苯酚市場:2025 年至 2032 年全球產業分析、規模、佔有率、成長、趨勢與預測
 4,4'-硫代雙-(2-叔丁基-5-甲基酚)的全球市場:2025年