


 |
市場調查報告書
商品編碼
1665407
建築垃圾市場機會、成長動力、產業趨勢分析與 2024 - 2032 年預測Construction Waste Market Opportunity, Growth Drivers, Industry Trend Analysis, and Forecast 2024 - 2032 |
||||||
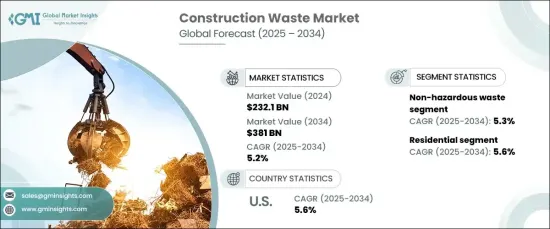
2023 年全球建築廢棄物市場價值為 2,321 億美元,預計 2025 年至 2034 年期間的複合年成長率為 5.2%。這種快速發展導致建築和拆除廢棄物的產生量大幅增加,從而推動了對高效廢棄物管理解決方案的需求。
世界各國政府正在推出嚴格的法規來減輕建築廢棄物對環境的影響。這些政策強調回收材料、減少對垃圾掩埋場的依賴以及提倡永續的做法。此外,全球推動循環經濟原則凸顯了重複使用和回收建築材料的重要性,有助於市場成長。然而,垃圾分類、處理和回收的高成本仍然是該行業面臨的主要挑戰。許多公司在採用永續廢棄物管理實務方面面臨財務障礙,尤其是在缺乏強力的監管誘因的情況下。
| 市場範圍 | |
|---|---|
| 起始年份 | 2023 |
| 預測年份 | 2024-2032 |
| 起始值 | 2321億美元 |
| 預測值 | 3810億美元 |
| 複合年成長率 | 5.2% |
無害廢棄物在 2024 年將達到 1,864 億美元,預計到 2034 年將以 5.3% 的複合年成長率成長。此外,擴大採用環保建築方法和政府要求回收無害廢物也進一步推動了這一領域的成長。
住宅建築業在 2024 年獲得了 40.6% 的收入佔有率,預計到 2034 年將以 5.6% 的複合年成長率成長。全球範圍內經濟適用房計劃的擴張和城市基礎設施的發展也在推動該領域的垃圾量成長方面發揮著重要作用。
僅美國建築廢棄物市場規模在 2024 年就超過了 441 億美元,預計到 2034 年複合年成長率將達到 5.6%。隨著建築企業持續成長,對廢棄物管理解決方案的需求可能仍將保持強勁,確保市場穩定成長。
目錄
第 1 章:方法論與範圍
- 市場範圍和定義
- 基礎估算與計算
- 預測參數
- 資料來源
- 基本的
- 次要
- 付費來源
- 公共資源
第 2 章:執行摘要
第 3 章:產業洞察
- 產業生態系統分析
- 影響價值鏈的因素
- 利潤率分析
- 中斷
- 未來展望
- 製造商
- 經銷商
- 零售商
- 衝擊力
- 成長動力
- 都市化和基礎建設加快
- 政府法規和永續發展舉措
- 建築和拆除活動增加
- 產業陷阱與挑戰
- 回收和廢棄物管理成本高
- 缺乏高效率的回收基礎設施
- 成長動力
- 技術與創新格局
- 消費者購買行為分析
- 人口趨勢
- 影響購買決策的因素
- 消費者產品採用
- 首選配銷通路
- 成長潛力分析
- 監管格局
- 定價分析
- 波特的分析
- PESTEL 分析
第4章:競爭格局
- 介紹
- 公司市佔率分析
- 競爭定位矩陣
- 戰略展望矩陣
第5章:市場估計與預測:依廢棄物類型,2021 – 2034 年
- 主要趨勢
- 危險
- 無害
第 6 章:市場估計與預測:按材料,2021 – 2034 年
- 主要趨勢
- 土壤、沙子和礫石
- 具體的
- 磚塊和磚石
- 木頭
- 金屬
- 其他
第 7 章:市場估計與預測:按來源,2021 年至 2034 年
- 主要趨勢
- 住宅
- 商業的
- 工業的
第 8 章:市場估計與預測:按服務,2021 年至 2034 年
- 主要趨勢
- 收藏
- 運輸
- 處理
第 9 章:市場估計與預測:按地區,2021 年至 2034 年
- 主要趨勢
- 北美洲
- 美國
- 加拿大
- 歐洲
- 德國
- 英國
- 法國
- 義大利
- 西班牙
- 亞太地區
- 中國
- 印度
- 日本
- 韓國
- 澳洲
- 馬來西亞
- 印尼
- 拉丁美洲
- 巴西
- 墨西哥
- 中東及非洲
- 沙烏地阿拉伯
- 阿拉伯聯合大公國
- 南非
第10章:公司簡介
- Casella Waste Systems, Inc.
- Clean Harbors, Inc.
- Cleanaway Waster Management Limited
- Daiseki Co., Ltd.
- FCC Environment Limited
- GFL Environmental Inc.
- Kiverco
- Metso Corporation
- Remondis
- Renewi plc
- Republic Services
- Veolia Environment SA
- Waste Connections
- Windsor Waste
- WM Intellectual Property Holdings, LLC
The Global Construction Waste Market was valued at USD 232.1 billion in 2023 and is projected to expand at a CAGR of 5.2% from 2025 to 2034. The increasing pace of urbanization and infrastructure expansion is driving a notable surge in construction activities across developed and developing regions. This rapid development has led to a significant rise in construction and demolition waste generation, fueling the demand for efficient waste management solutions.
Governments worldwide are introducing stringent regulations to mitigate the environmental impact of construction waste. These policies emphasize recycling materials, reducing landfill dependency, and promoting sustainable practices. Additionally, the global push toward circular economy principles highlights the importance of reusing and recycling construction materials, which is contributing to market growth. However, the high costs associated with waste sorting, processing, and recycling remain a key challenge for the industry. Many companies face financial barriers to adopting sustainable waste management practices, especially in the absence of strong regulatory incentives.
| Market Scope | |
|---|---|
| Start Year | 2023 |
| Forecast Year | 2024-2032 |
| Start Value | $232.1 Billion |
| Forecast Value | $381 Billion |
| CAGR | 5.2% |
Non-hazardous waste, which accounted for USD 186.4 billion in 2024, is expected to grow at a CAGR of 5.3% through 2034. This segment benefits from the ease of recycling materials like concrete, bricks, and wood, which dominate construction and demolition waste streams. Additionally, increasing adoption of eco-friendly building methods and government mandates for recycling non-hazardous waste are further driving this segment's growth.
The residential construction sector secured a 40.6% revenue share in 2024 and is forecasted to grow at a CAGR of 5.6% through 2034. Residential projects contribute heavily to waste generation, especially during new construction, renovation, or demolition activities. The expansion of affordable housing initiatives and urban infrastructure development worldwide are also playing a significant role in driving waste volumes from this segment.
The US construction waste market alone surpassed USD 44.1 billion in 2024, with expectations of a 5.6% CAGR through 2034. Population growth and increased construction activity have contributed to this rise, with the sector playing a pivotal role in the national economy. As construction establishments continue to grow, demand for waste management solutions will likely remain strong, ensuring steady market growth.
Table of Contents
Chapter 1 Methodology & Scope
- 1.1 Market scope & definition
- 1.2 Base estimates & calculations
- 1.3 Forecast parameters
- 1.4 Data sources
- 1.4.1 Primary
- 1.4.2 Secondary
- 1.4.2.1 Paid sources
- 1.4.2.2 Public sources
Chapter 2 Executive Summary
- 2.1 Industry 3600 synopsis, 2021 - 2034
Chapter 3 Industry Insights
- 3.1 Industry ecosystem analysis
- 3.1.1 Factors affecting the value chain
- 3.1.2 Profit margin analysis
- 3.1.3 Disruptions
- 3.1.4 Future outlook
- 3.1.5 Manufacturers
- 3.1.6 Distributors
- 3.1.7 Retailers
- 3.2 Impact forces
- 3.2.1 Growth drivers
- 3.2.1.1 Increase in urbanization and infrastructure development
- 3.2.1.2 Government regulations and sustainability initiatives
- 3.2.1.3 Increasing construction and demolition activities
- 3.2.2 Industry pitfalls & challenges
- 3.2.2.1 High costs of recycling and waste management
- 3.2.2.2 Lack of efficient recycling infrastructure
- 3.2.1 Growth drivers
- 3.3 Technology & innovation landscape
- 3.4 Consumer buying behavior analysis
- 3.4.1 Demographic trends
- 3.4.2 Factors affecting buying decision
- 3.4.3 Consumer product adoption
- 3.4.4 Preferred distribution channel
- 3.5 Growth potential analysis
- 3.6 Regulatory landscape
- 3.7 Pricing analysis
- 3.8 Porter’s analysis
- 3.9 PESTEL analysis
Chapter 4 Competitive Landscape, 2024
- 4.1 Introduction
- 4.2 Company market share analysis
- 4.3 Competitive positioning matrix
- 4.4 Strategic outlook matrix
Chapter 5 Market Estimates & Forecast, By Waste Type, 2021 – 2034, (USD Billion)
- 5.1 Key trends
- 5.2 Hazardous
- 5.3 Non-hazardous
Chapter 6 Market Estimates & Forecast, By Material, 2021 – 2034, (USD Billion)
- 6.1 Key trends
- 6.2 Soil, sand, & gravel
- 6.3 Concrete
- 6.4 Bricks & masonry
- 6.5 Wood
- 6.6 Metal
- 6.7 Others
Chapter 7 Market Estimates & Forecast, By Source, 2021 – 2034, (USD Billion)
- 7.1 Key trends
- 7.2 Residential
- 7.3 Commercial
- 7.4 Industrial
Chapter 8 Market Estimates & Forecast, By Service, 2021 – 2034, (USD Billion)
- 8.1 Key trends
- 8.2 Collection
- 8.3 Transportation
- 8.4 Disposal
Chapter 9 Market Estimates & Forecast, By Region, 2021 – 2034, (USD Billion)
- 9.1 Key trends
- 9.2 North America
- 9.2.1 U.S.
- 9.2.2 Canada
- 9.3 Europe
- 9.3.1 Germany
- 9.3.2 UK
- 9.3.3 France
- 9.3.4 Italy
- 9.3.5 Spain
- 9.4 Asia Pacific
- 9.4.1 China
- 9.4.2 India
- 9.4.3 Japan
- 9.4.4 South Korea
- 9.4.5 Australia
- 9.4.6 Malaysia
- 9.4.7 Indonesia
- 9.5 Latin America
- 9.5.1 Brazil
- 9.5.2 Mexico
- 9.6 MEA
- 9.6.1 Saudi Arabia
- 9.6.2 UAE
- 9.6.3 South Africa
Chapter 10 Company Profiles (Business Overview, Financial Data, Product Landscape, Strategic Outlook, SWOT Analysis)
- 10.1 Casella Waste Systems, Inc.
- 10.2 Clean Harbors, Inc.
- 10.3 Cleanaway Waster Management Limited
- 10.4 Daiseki Co., Ltd.
- 10.5 FCC Environment Limited
- 10.6 GFL Environmental Inc.
- 10.7 Kiverco
- 10.8 Metso Corporation
- 10.9 Remondis
- 10.10 Renewi plc
- 10.11 Republic Services
- 10.12 Veolia Environment S.A.
- 10.13 Waste Connections
- 10.14 Windsor Waste
- 10.15 WM Intellectual Property Holdings, LLC
 智慧廢棄物收集技術市場:按技術、組件、廢棄物類型和最終用戶分類-2026-2032年全球市場預測自動化垃圾收集系統市場:按組件、系統類型、最終用戶和垃圾類型分類-2026-2032年全球市場預測氣動廢棄物收集系統市場:按系統類型、組件、廢棄物類型、安裝方式、應用和銷售管道,全球預測,2026-2032年
 自動化廢棄物收集系統市場 - 全球產業規模、佔有率、趨勢、機會、預測:按類型、營運方式、應用、地區和競爭格局分類,2021-2031年
 2026-2030年全球自動化廢棄物收集系統市場
 2032 年自動廢棄物分類和回收系統市場預測:按組件、廢棄物分類類型、技術、最終用戶和地區進行的全球分析
 全球氣動廢棄物收集服務市場
 自動廢棄物收集系統市場,按產品類型、按組件、按操作模式、按廢棄物類型、按最終用戶、按國家/地區 - 2025 年至 2032 年全球行業分析、市場規模、市場佔有率和預測自動廢棄物收集系統 (AWCS) 的全球市場全球廢棄物收集設備市場,預測到 2030 年:按設備類型、按廢棄物類型、按最終用戶、按地區