


 |
市場調查報告書
商品編碼
1665345
自動視野分析儀市場機會、成長動力、產業趨勢分析與 2025 - 2034 年預測Automated Visual Field Analyzer Market Opportunity, Growth Drivers, Industry Trend Analysis, and Forecast 2025 - 2034 |
||||||
2024 年全球自動視野分析儀市場規模達到 2.314 億美元,預計 2025 年至 2034 年期間的複合年成長率為 5.8%。 這一成長軌跡受到技術進步、眼科疾病發病率上升以及對早期診斷在保護視力方面的關鍵作用的認知不斷提高的推動。自動視野分析儀已成為現代眼科中不可或缺的設備,可以非常準確地幫助檢測和監測視力障礙。
技術創新,特別是人工智慧和機器學習的融合,顯著提高了自動視野分析儀的效率和精確度。這些進步使得診斷結果更快、更準確,滿足了醫院和專科眼科診所對尖端診斷工具日益成長的需求。此外,使用者友善的介面和增強的測試能力推動了不同臨床環境中的廣泛應用,鞏固了這些設備在現代眼科護理中的作用。
| 市場範圍 | |
|---|---|
| 起始年份 | 2024 |
| 預測年份 | 2025-2034 |
| 起始值 | 2.314億美元 |
| 預測值 | 4.015 億美元 |
| 複合年成長率 | 5.8% |
市場依產品類型分為靜態分析儀和動態分析儀。靜態分析儀將穩定成長,預計複合年成長率為 5.5%,到 2034 年將達到 2.761資料美元。它們的可靠性和易用性使其成為臨床診斷和研究應用的首選。青光眼是全世界視力喪失的主要原因,尤其是在老年人口中,其盛行率的不斷上升進一步促進了該領域的成長。
根據應用,市場涵蓋青光眼、老年黃斑部病變 (AMD)、神經系統疾病和其他用途。預計青光眼市場將以 6.3% 的強勁複合年成長率成長,到 2034 年將產生 1.752 億美元的產值。自動視野分析儀擅長檢測和監測青光眼進展,提供早期介入的機會並降低不可逆視力喪失的風險。
美國自動視野分析儀市值在 2024 年達到 7,690 萬美元,預計到 2034 年將以 4.8% 的複合年成長率成長。老齡化人口對這些疾病的敏感度更高,這也增加了定期眼科檢查和先進診斷技術的需求。持續的創新,尤其是人工智慧和機器學習的應用,不斷提高診斷的準確性和效率,推動了這些設備在美國醫療保健領域的應用。
目錄
第 1 章:方法論與範圍
第 2 章:執行摘要
第 3 章:產業洞察
- 產業生態系統分析
- 產業衝擊力
- 成長動力
- 青光眼和其他眼部疾病的盛行率上升
- 更重視早期診斷
- 在神經系統評估的應用
- 門診眼科護理需求不斷成長
- 產業陷阱與挑戰
- 設備成本高
- 成長動力
- 成長潛力分析
- 監管格局
- 報銷場景
- 技術格局
- 差距分析
- 波特的分析
- PESTEL 分析
- 未來市場趨勢
第4章:競爭格局
- 介紹
- 公司矩陣分析
- 公司市佔率分析
- 主要市場參與者的競爭分析
- 競爭定位矩陣
- 策略儀表板
第 5 章:市場估計與預測:按產品類型,2021 年至 2034 年
- 主要趨勢
- 靜止的
- 動能
第 6 章:市場估計與預測:按應用,2021 年至 2034 年
- 主要趨勢
- 青光眼
- 老年黃斑部病變(AMD)
- 神經系統疾病
- 其他應用
第 7 章:市場估計與預測:依最終用途,2021 年至 2034 年
- 主要趨勢
- 醫院
- 眼科診所
- 其他最終用戶
第 8 章:市場估計與預測:按地區,2021 年至 2034 年
- 主要趨勢
- 北美洲
- 美國
- 加拿大
- 歐洲
- 德國
- 英國
- 法國
- 西班牙
- 義大利
- 荷蘭
- 亞太地區
- 中國
- 日本
- 印度
- 澳洲
- 韓國
- 拉丁美洲
- 巴西
- 墨西哥
- 阿根廷
- 中東和非洲
- 南非
- 沙烏地阿拉伯
- 阿拉伯聯合大公國
第9章:公司簡介
- Canon
- ESSILOR INSTRUMENTS
- HAAG-STREIT GROUP
- HEIDELBERG ENGINEERING
- Konan Medical
- Kowa
- MEDA
- Metrovision
- OCULUS
- Optopol
- Reichert AMETEK
- Rexxam
- TOPCON Healthcare
- Zeiss
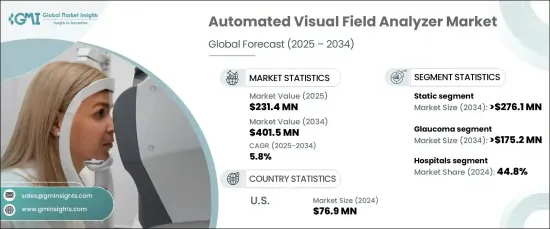
The Global Automated Visual Field Analyzer Market reached USD 231.4 million in 2024 and is projected to grow at a CAGR of 5.8% between 2025 and 2034. This growth trajectory is fueled by technological advancements, a rising incidence of ophthalmic disorders, and increasing awareness of the critical role early diagnosis plays in preserving vision. Automated visual field analyzers have become indispensable in modern ophthalmology, aiding in the detection and monitoring of vision impairments with remarkable accuracy.
Technological innovations, particularly the integration of artificial intelligence and machine learning, have significantly enhanced the efficiency and precision of automated visual field analyzers. These advancements enable faster, more accurate results, meeting the growing demand for cutting-edge diagnostic tools in hospitals and specialized eye clinics. Additionally, user-friendly interfaces and enhanced testing capabilities have driven widespread adoption across diverse clinical environments, solidifying the role of these devices in modern eye care.
| Market Scope | |
|---|---|
| Start Year | 2024 |
| Forecast Year | 2025-2034 |
| Start Value | $231.4 Million |
| Forecast Value | $ 401.5 Million |
| CAGR | 5.8% |
The market is segmented by product type into static and kinetic analyzers. Static analyzers are set to witness steady growth, with a projected CAGR of 5.5%, reaching USD 276.1 million by 2034. These devices evaluate fixed points within a patient's visual field, offering highly accurate and reproducible data crucial for the early detection of visual impairments. Their reliability and ease of use make them a top choice for clinical diagnostics and research applications. The segment growth is further bolstered by the increasing prevalence of glaucoma, a leading cause of vision loss worldwide, particularly among aging populations.
By application, the market encompasses glaucoma, age-related macular degeneration (AMD), neurological disorders, and other uses. The glaucoma segment is expected to grow at a robust CAGR of 6.3%, generating USD 175.2 million by 2034. Rising cases of glaucoma, driven by risk factors such as diabetes and hypertension, underscore the need for advanced diagnostic tools. Automated visual field analyzers excel in detecting and monitoring glaucoma progression, providing opportunities for early intervention and reducing the risk of irreversible vision loss.
The U.S. market for automated visual field analyzers, valued at USD 76.9 million in 2024, is anticipated to grow at a CAGR of 4.8% through 2034. This growth is driven by the increasing prevalence of vision-related disorders, including glaucoma, AMD, and diabetic retinopathy. An aging population with a higher susceptibility to these conditions amplifies the need for regular eye examinations and advanced diagnostic technologies. Ongoing innovation, particularly the adoption of AI and ML, continues to enhance diagnostic accuracy and efficiency, fueling the adoption of these devices across the U.S. healthcare landscape.
Table of Contents
Chapter 1 Methodology and Scope
- 1.1 Market scope and definitions
- 1.2 Research design
- 1.2.1 Research approach
- 1.2.2 Data collection methods
- 1.3 Base estimates and calculations
- 1.3.1 Base year calculation
- 1.3.2 Key trends for market estimation
- 1.4 Forecast model
- 1.5 Primary research and validation
- 1.5.1 Primary sources
- 1.5.2 Data mining sources
Chapter 2 Executive Summary
- 2.1 Industry 3600 synopsis
Chapter 3 Industry Insights
- 3.1 Industry ecosystem analysis
- 3.2 Industry impact forces
- 3.2.1 Growth drivers
- 3.2.1.1 Rising prevalence of glaucoma and other eye disorders
- 3.2.1.2 Increased focus on early diagnosis
- 3.2.1.3 Adoption in neurological assessments
- 3.2.1.4 Rising demand for outpatient eye care
- 3.2.2 Industry pitfalls and challenges
- 3.2.2.1 High cost of devices
- 3.2.1 Growth drivers
- 3.3 Growth potential analysis
- 3.4 Regulatory landscape
- 3.5 Reimbursement scenario
- 3.6 Technology landscape
- 3.7 Gap analysis
- 3.8 Porter's analysis
- 3.9 PESTEL analysis
- 3.10 Future market trends
Chapter 4 Competitive Landscape, 2024
- 4.1 Introduction
- 4.2 Company matrix analysis
- 4.3 Company market share analysis
- 4.4 Competitive analysis of major market players
- 4.5 Competitive positioning matrix
- 4.6 Strategy dashboard
Chapter 5 Market Estimates and Forecast, By Product Type, 2021 – 2034 ($ Mn)
- 5.1 Key trends
- 5.2 Static
- 5.3 Kinetic
Chapter 6 Market Estimates and Forecast, By Application, 2021 – 2034 ($ Mn)
- 6.1 Key trends
- 6.2 Glaucoma
- 6.3 Age-related macular degeneration (AMD)
- 6.4 Neurological disorders
- 6.5 Other applications
Chapter 7 Market Estimates and Forecast, By End Use, 2021 – 2034 ($ Mn)
- 7.1 Key trends
- 7.2 Hospitals
- 7.3 Ophthalmic clinics
- 7.4 Other end users
Chapter 8 Market Estimates and Forecast, By Region, 2021 – 2034 ($ Mn)
- 8.1 Key trends
- 8.2 North America
- 8.2.1 U.S.
- 8.2.2 Canada
- 8.3 Europe
- 8.3.1 Germany
- 8.3.2 UK
- 8.3.3 France
- 8.3.4 Spain
- 8.3.5 Italy
- 8.3.6 Netherlands
- 8.4 Asia Pacific
- 8.4.1 China
- 8.4.2 Japan
- 8.4.3 India
- 8.4.4 Australia
- 8.4.5 South Korea
- 8.5 Latin America
- 8.5.1 Brazil
- 8.5.2 Mexico
- 8.5.3 Argentina
- 8.6 Middle East and Africa
- 8.6.1 South Africa
- 8.6.2 Saudi Arabia
- 8.6.3 UAE
Chapter 9 Company Profiles
- 9.1 Canon
- 9.2 ESSILOR INSTRUMENTS
- 9.3 HAAG-STREIT GROUP
- 9.4 HEIDELBERG ENGINEERING
- 9.5 Konan Medical
- 9.6 Kowa
- 9.7 MEDA
- 9.8 Metrovision
- 9.9 OCULUS
- 9.10 Optopol
- 9.11 Reichert AMETEK
- 9.12 Rexxam
- 9.13 TOPCON Healthcare
- 9.14 Zeiss
 眼科視野計市場:按類型、產品類型、便攜性、銷售管道、價格範圍、應用和最終用戶分類-2026-2032年全球市場預測自動化視覺現場檢測設備市場:按便攜性、技術、連接性、應用和最終用戶分類-2026年至2032年全球市場預測
 全球眼科視野計市場規模、佔有率、趨勢和成長分析報告(2026-2034年)按產品類型、技術、行動裝置類型、連接方式、應用程式、最終用戶和通路分類的自動眼科視野計市場-2026-2032年全球預測按組件、部署類型、垂直產業、最終用戶和應用程式分類的自動化周界安防市場—2026-2032年全球預測桌面邊界安全市場:按組件、部署方式、組織規模、終端類型和產業分類,全球預測,2026-2032 年自動眼科視野計市場:依技術、行動性別、價格範圍、應用程式、通路和終端用戶,全球預測,2026-2032年
 眼科視野計市場規模、佔有率及成長分析(按產品、應用、最終用途及地區分類)-2026-2033年產業預測
 全球自動化周界市場
 自動視野分析儀市場,按產品類型、按應用、按技術、按最終用戶、按國家和地區分類 - 2025 年至 2032 年全球行業分析、市場規模、市場佔有率和預測