


 |
市場調查報告書
商品編碼
1665101
推拉工具市場機會、成長動力、產業趨勢分析與 2024 - 2032 年預測Push Pull Tools Market Opportunity, Growth Drivers, Industry Trend Analysis, and Forecast 2024 - 2032 |
||||||
2023 年全球推拉工具市場價值為 11.4 億美元,預計 2024 年至 2032 年期間將以 4.2% 的複合年成長率穩步成長。這些工具被廣泛認為可以提高生產力、減少身體勞損並改善工作場所的安全性。隨著製造技術的進步和對營運效率的日益重視,對推拉工具的需求正在不斷擴大。由於安全標準和監管要求的不斷提高以及對人體工學設計的重視,它們在製造、建築、物流和汽車等領域發揮著至關重要的作用。隨著全球工業活動不斷增加,在技術創新和工業基礎設施不斷發展的推動下,該市場將實現大幅成長。
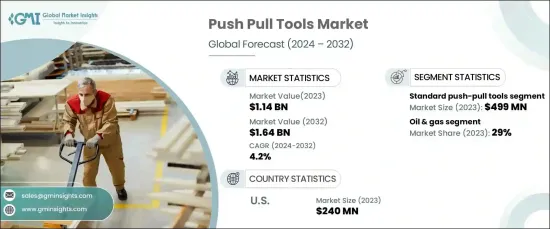
2023 年,標準推拉工具部門的收入為 4.99 億美元,預計在預測期內的複合年成長率為 4.4%。這些工具對於製造業和建築業等行業至關重要,因為它們簡化材料處理和組裝流程的能力至關重要。標準推拉工具可顯著減輕工人的壓力並提高生產效率,這是注重改善人體工學和安全性的行業的關鍵因素。隨著製造業和建築業的持續成長,對這些工具的需求預計會增加,確保市場持續擴大。
| 市場範圍 | |
|---|---|
| 起始年份 | 2023 |
| 預測年份 | 2024-2032 |
| 起始值 | 11.4億美元 |
| 預測值 | 16.4億美元 |
| 複合年成長率 | 4.2% |
石油和天然氣行業在 2023 年佔據了 29% 的市場佔有率,預計在 2024 年至 2032 年期間的複合年成長率為 4.5%。它們在防止設備故障和減少停機時間方面發揮的作用對於延長關鍵資產的使用壽命至關重要。隨著對基礎設施、探勘活動和維護作業的大量投資,石油和天然氣行業對推拉工具的需求預計將大幅上升。
在美國,推拉工具市場在 2023 年的價值為 2.4 億美元,預計到 2032 年將以 4.3% 的複合年成長率成長。重視安全性、營運效率和精確度的產業正在推動推拉工具的採用,主要應用包括材料處理、組件對準和設備安裝。這些行業的成長,加上技術的進步,預計將推動對推拉工具的持續需求。
目錄
第 1 章:方法論與範圍
- 市場範圍和定義
- 基礎估算與計算
- 預測計算。
- 資料來源
- 基本的
- 次要
- 付費來源
- 公共資源
第 2 章:執行摘要
第 3 章:產業洞察
- 產業生態系統分析
- 影響價值鏈的因素
- 利潤率分析
- 中斷
- 未來展望
- 製造商
- 經銷商
- 供應商概況
- 利潤率分析。
- 重要新聞及舉措
- 監管格局
- 衝擊力
- 成長動力
- 工業自動化需求不斷成長
- 高效率物料搬運的需求日益增加
- 產業陷阱與挑戰
- 缺乏意識和培訓
- 成長動力
- 成長潛力分析
- 波特的分析
- PESTEL 分析
第4章:競爭格局
- 介紹
- 公司市佔率分析
- 競爭定位矩陣
- 戰略展望矩陣
第 5 章:市場估計與預測:按工具類型,2021 年至 2032 年
- 主要趨勢
- 標準推拉工具
- 直推拉工具
- 可調式推拉工具
- 重型推拉工具
- 液壓推拉工具
- 氣動推拉工具
- 旋轉推拉工具
- 旋轉頭工具
- 樞軸頭工具
- 磁性推拉工具
- 固定磁性工具
- 可調磁性工具
- 其他(人體工學推拉工具等)
第6章:市場估計與預測:按負載能力,2021-2032 年
- 主要趨勢
- 最多 50 公斤
- 50–200 公斤
- 200公斤以上
第 7 章:市場估計與預測:按應用,2021 年至 2032 年
- 主要趨勢
- 物料處理
- 對齊任務
- 檢查和維護
- 其他(緊急行動等)
第 8 章:市場估計與預測:依最終用途,2021-2032 年
- 主要趨勢
- 石油和天然氣
- 建造
- 製造業
- 礦業
- 其他(物流等)
第 9 章:市場估計與預測:按配銷通路,2021-2032 年
- 主要趨勢
- 直接的
- 間接
第 10 章:市場估計與預測:按地區,2021-2032 年
- 主要趨勢
- 北美洲
- 美國
- 加拿大
- 歐洲
- 英國
- 德國
- 法國
- 義大利
- 西班牙
- 俄羅斯
- 亞太地區
- 中國
- 印度
- 日本
- 韓國
- 澳洲
- 拉丁美洲
- 巴西
- 墨西哥
- 中東及非洲
- 阿拉伯聯合大公國
- 沙烏地阿拉伯
- 南非
第 11 章:公司簡介
- Enerpac Tool Group
- Hydratight
- Schroeder Industries
- SPX Flow, Inc.
- Master Pull, LLC
- Graco Inc.
- Stanley Black & Decker, Inc.
- Grote Industries, Inc.
- Tuthill Corporation
- WIKA Instruments Ltd.
- Lindapter International Ltd.
- Cleveland Cable Company
- Ridge Tool Company
- Hilti Corporation
- Jergens, Inc.
The Global Push Pull Tools Market, valued at USD 1.14 billion in 2023, is expected to grow steadily at a CAGR of 4.2% from 2024 to 2032. As industries increasingly demand efficient movement, precise alignment, and careful positioning of heavy materials, the role of push-pull tools becomes indispensable in operations across various sectors. These tools are widely recognized for enhancing productivity, reducing physical strain, and improving safety in the workplace. With advancements in manufacturing technologies and a growing emphasis on operational efficiency, demand for push-pull tools is expanding. Their crucial role in sectors like manufacturing, construction, logistics, and automotive is further bolstered by rising safety standards, regulatory requirements, and a focus on ergonomic designs. As industrial activities continue to increase globally, this market is poised for significant growth, driven by technological innovations and the continuous development of industrial infrastructure.
In 2023, the standard push-pull tools segment garnered USD 499 million in revenue and is projected to expand at a CAGR of 4.4% during the forecast period. These tools are essential in industries such as manufacturing and construction, where their capacity to streamline material handling and assembly processes is paramount. Standard push-pull tools significantly reduce worker strain while enhancing productivity, a key factor in industries focused on improving ergonomics and safety. The demand for these tools is expected to rise as manufacturing and construction industries continue to experience growth, ensuring consistent market expansion.
| Market Scope | |
|---|---|
| Start Year | 2023 |
| Forecast Year | 2024-2032 |
| Start Value | $1.14 Billion |
| Forecast Value | $1.64 Billion |
| CAGR | 4.2% |
The oil and gas sector accounted for 29% of the market share in 2023 and is projected to grow at a CAGR of 4.5% between 2024 and 2032. In this sector, push-pull tools are crucial for handling complex equipment and materials during maintenance and inspections, ensuring proper alignment and secure positioning. Their role in preventing equipment failures and minimizing downtime is vital to prolonging the lifespan of critical assets. With substantial investments in infrastructure, exploration activities, and maintenance operations, the demand for push-pull tools in the oil and gas industry is expected to rise significantly.
In the U.S., the push-pull tools market was valued at USD 240 million in 2023 and is forecasted to grow at a CAGR of 4.3% through 2032. With its advanced industrial landscape, the U.S. sees significant demand from its manufacturing and construction sectors. Industries that prioritize safety, operational efficiency, and precision are driving the adoption of push-pull tools, with key applications including material handling, component alignment, and equipment installation. The growth of these sectors, coupled with advancements in technology, is expected to fuel sustained demand for push-pull tools.
Table of Contents
Chapter 1 Methodology & Scope
- 1.1 Market scope & definitions
- 1.2 Base estimates & calculations
- 1.3 Forecast calculations.
- 1.4 Data sources
- 1.4.1 Primary
- 1.4.2 Secondary
- 1.4.2.1 Paid sources
- 1.4.2.2 Public sources
Chapter 2 Executive Summary
- 2.1 Industry synopsis, 2021-2032
Chapter 3 Industry Insights
- 3.1 Industry ecosystem analysis
- 3.1.1 Factor affecting the value chain
- 3.1.2 Profit margin analysis
- 3.1.3 Disruptions
- 3.1.4 Future outlook
- 3.1.5 Manufacturers
- 3.1.6 Distributors
- 3.2 Supplier landscape
- 3.3 Profit margin analysis.
- 3.4 Key news & initiatives
- 3.5 Regulatory landscape
- 3.6 Impact forces
- 3.6.1 Growth drivers
- 3.6.1.1 Increasing demand for industrial automation
- 3.6.1.2 Rising need for efficient material handling
- 3.6.2 Industry pitfalls & challenges
- 3.6.2.1 Lack of awareness and training
- 3.6.1 Growth drivers
- 3.7 Growth potential analysis
- 3.8 Porter’s analysis
- 3.9 PESTEL analysis
Chapter 4 Competitive Landscape, 2023
- 4.1 Introduction
- 4.2 Company market share analysis
- 4.3 Competitive positioning matrix
- 4.4 Strategic outlook matrix
Chapter 5 Market Estimates & Forecast, By Tool Type, 2021-2032 (USD Million) (Million Units)
- 5.1 Key trends
- 5.2 Standard Push-Pull tools
- 5.2.1 Straight Push-Pull tools
- 5.2.2 Adjustable Push-Pull tools
- 5.3 Heavy-Duty Push-Pull tools
- 5.3.1 Hydraulic Push-Pull tools
- 5.3.2 Pneumatic Push-Pull tools
- 5.4 Rotational Push-Pull tools
- 5.4.1 Swivel-Head tools
- 5.4.2 Pivot-Head tools
- 5.5 Magnetic Push-Pull tools
- 5.5.1 Fixed Magnetic tools
- 5.5.2 Adjustable Magnetic tools
- 5.6 Others (Ergonomic Push-Pull tools, Etc)
Chapter 6 Market Estimates & Forecast, By Load Capacity, 2021-2032 (USD Million) (Million Units)
- 6.1 Key trends
- 6.2 Up to 50 kg
- 6.3 50–200 kg
- 6.4 Above 200 kg
Chapter 7 Market Estimates & Forecast, By Application, 2021-2032 (USD Million) (Million Units)
- 7.1 Key trends
- 7.2 Material handling
- 7.3 Alignment tasks
- 7.4 Inspection and maintenance
- 7.5 Others (emergency operations, Etc.)
Chapter 8 Market Estimates & Forecast, By End-use, 2021-2032 (USD Million) (Million Units)
- 8.1 Key trends
- 8.2 Oil & gas
- 8.3 Construction
- 8.4 Manufacturing
- 8.5 Mining
- 8.6 Others (Logistics, Etc)
Chapter 9 Market Estimates & Forecast, By Distribution Channel, 2021-2032 (USD Million) (Million Units)
- 9.1 Key trends
- 9.2 Direct
- 9.3 Indirect
Chapter 10 Market Estimates & Forecast, By Region, 2021-2032 (USD Million) (Million Units)
- 10.1 Key trends
- 10.2 North America
- 10.2.1 U.S.
- 10.2.2 Canada
- 10.3 Europe
- 10.3.1 UK
- 10.3.2 Germany
- 10.3.3 France
- 10.3.4 Italy
- 10.3.5 Spain
- 10.3.6 Russia
- 10.4 Asia Pacific
- 10.4.1 China
- 10.4.2 India
- 10.4.3 Japan
- 10.4.4 South Korea
- 10.4.5 Australia
- 10.5 Latin America
- 10.5.1 Brazil
- 10.5.2 Mexico
- 10.6 MEA
- 10.6.1 UAE
- 10.6.2 Saudi Arabia
- 10.6.3 South Africa
Chapter 11 Company Profiles
- 11.1 Enerpac Tool Group
- 11.2 Hydratight
- 11.3 Schroeder Industries
- 11.4 SPX Flow, Inc.
- 11.5 Master Pull, LLC
- 11.6 Graco Inc.
- 11.7 Stanley Black & Decker, Inc.
- 11.8 Grote Industries, Inc.
- 11.9 Tuthill Corporation
- 11.10 WIKA Instruments Ltd.
- 11.11 Lindapter International Ltd.
- 11.12 Cleveland Cable Company
- 11.13 Ridge Tool Company
- 11.14 Hilti Corporation
- 11.15 Jergens, Inc.