


 |
市場調查報告書
商品編碼
1664858
市政臭氧發生器市場機會、成長動力、產業趨勢分析與預測 2025 - 2034Municipal Ozone Generator Market Opportunity, Growth Drivers, Industry Trend Analysis, and Forecast 2025 - 2034 |
||||||
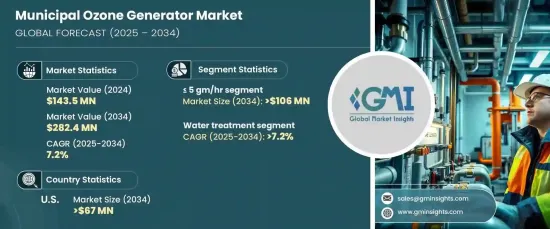
2024 年全球市政臭氧發生器市場價值為 1.435 億美元,預計 2025 年至 2034 年期間將以 7.2% 的強勁複合年成長率成長。這確保了市政供水的安全分配和對環境負責的廢水排放。
市政臭氧發生器日益普及的關鍵促進因素之一是人們越來越重視環境永續性。這些環保系統不會留下任何有害殘留物,符合全球保護環境的努力。此外,消除水中的藥物、微塑膠和個人護理產品殘留物等新興污染物的挑戰日益嚴峻,大大增加了對臭氧發生器的需求。它們能有效分解複雜污染物,成為尋求先進處理解決方案的市政當局的首選。
| 市場範圍 | |
|---|---|
| 起始年份 | 2024 |
| 預測年份 | 2025-2034 |
| 起始值 | 1.435億美元 |
| 預測值 | 2.824億美元 |
| 複合年成長率 | 7.2% |
市場按容量進行細分,預計到 2034 年,<= 5 g/h 細分市場將產生 1.06 億美元的收入。這一成長主要得益於對緊湊型發電機組日益成長的需求,這種發電機組非常適合處理較小的水庫、局部供水和基礎設施有限地區的補充系統。這些單位的成本效益使其對人口較少或預算有限的城市特別有吸引力,從而推動了它們的廣泛採用。
按應用分類,預計到 2034 年,水處理領域的複合年成長率將達到 7.2%。這些系統提供無化學消毒,盡量減少副產品的形成,進而降低環境和健康風險。它們能夠滿足嚴格的污染物去除準則,這使它們成為現代水處理實踐中必不可少的工具。
在美國,市政臭氧發生器市場預計到 2034 年將創收 6,700 萬美元。此外,美國老化的水利基礎設施正在推動現代化的需求,市政當局正在尋求提高營運效率的解決方案。臭氧發生器配備遠端監控和能源最佳化等功能,作為升級水系統的可靠解決方案,正變得越來越受歡迎。
目錄
第 1 章:方法論與範圍
- 市場定義
- 基礎估算與計算
- 預測計算
- 初步研究與驗證
- 主要來源
- 資料探勘來源
- 市場定義
第 2 章:執行摘要
第 3 章:產業洞察
- 產業生態系統
- 監管格局
- 產業衝擊力
- 成長動力
- 產業陷阱與挑戰
- 成長潛力分析
- 波特的分析
- 供應商的議價能力
- 買家的議價能力
- 新進入者的威脅
- 替代品的威脅
- PESTEL 分析
第4章:競爭格局
- 介紹
- 戰略儀表板
- 創新與技術格局
第 5 章:市場規模與預測:依技術,2021 – 2034 年
- 主要趨勢
- 紫外線
- 冷等離子
- 電暈放電
- 電解
第 6 章:市場規模與預測:按應用,2021 – 2034 年
- 主要趨勢
- 水處理
- 實驗室和醫療設備
- 空氣處理
- 其他
第 7 章:市場規模及預測:依產能,2021 – 2034 年
- 主要趨勢
- ≤ 5 克/小時
- 5 克/小時 - 100 克/小時
- 100 克/小時 - 1 公斤/小時
- 1 公斤/小時 - 5 公斤/小時
- > 5 公斤/小時
第 8 章:市場規模與預測:按地區,2021 – 2034 年
- 主要趨勢
- 北美洲
- 美國
- 加拿大
- 歐洲
- 德國
- 英國
- 法國
- 俄羅斯
- 義大利
- 西班牙
- 亞太地區
- 中國
- 澳洲
- 印度
- 日本
- 韓國
- 中東和非洲
- 沙烏地阿拉伯
- 阿拉伯聯合大公國
- 埃及
- 土耳其
- 南非
- 拉丁美洲
- 巴西
- 阿根廷
第9章:公司簡介
- BIO-UV
- DEL Ozone
- Eltech Ozone
- Faraday Ozone
- Lenntech Water Treatment
- ORAIPL
- Oxidation Technologies
- Oxyzone International
- Ozone Solutions
- Primozone
- SUEZ Group
- Veolia
The Global Municipal Ozone Generator Market, valued at USD 143.5 million in 2024, is projected to grow at a robust CAGR of 7.2% from 2025 to 2034. These advanced systems are designed to produce ozone gas for large-scale water and wastewater treatment harnessing its powerful oxidizing properties to disinfect water, degrade pollutants, and remove odors and harmful chemicals. This ensures the safe distribution of municipal water and environmentally responsible wastewater discharge.
One of the key drivers behind the growing adoption of municipal ozone generators is the increasing emphasis on environmental sustainability. These eco-friendly systems leave no harmful residues, aligning with global efforts to protect the environment. Moreover, the rising challenge of eliminating emerging contaminants, such as pharmaceuticals, microplastics, and personal care product residues from water supplies, has significantly boosted the demand for ozone generators. Their effectiveness in breaking down complex pollutants makes them a top choice for municipalities looking for advanced treatment solutions.
| Market Scope | |
|---|---|
| Start Year | 2024 |
| Forecast Year | 2025-2034 |
| Start Value | $143.5 Million |
| Forecast Value | $282.4 Million |
| CAGR | 7.2% |
The market is segmented by capacity, with the <= 5 g/h segment expected to generate USD 106 million by 2034. This growth is largely driven by the increasing demand for compact generator units, ideal for treating smaller water reservoirs, localized water supplies, and supplementary systems in regions with limited infrastructure. The cost-effectiveness of these units makes them particularly appealing to municipalities with smaller populations or constrained budgets, fueling their widespread adoption.
By application, the water treatment segment is forecast to grow at a CAGR of 7.2% through 2034. Stricter regulations surrounding drinking water safety and wastewater discharge are driving the demand for ozone generators. These systems offer chemical-free disinfection with minimal byproduct formation, reducing environmental and health risks. Their ability to meet stringent guidelines for contaminant removal positions them as an essential tool in modern water treatment practices.
In the United States, the municipal ozone generator market is expected to generate USD 67 million by 2034. The need to address emerging contaminants, such as PFAS and microplastics, is fueling the demand for these high-efficiency systems. Furthermore, the aging water infrastructure in the U.S. is driving the need for modernization, with municipalities seeking solutions that improve operational efficiency. Ozone generators, equipped with features like remote monitoring and energy optimization, are becoming increasingly popular as reliable solutions to upgrade water systems.
Table of Contents
Chapter 1 Methodology & Scope
- 1.1 Market definitions
- 1.2 Base estimates & calculations
- 1.3 Forecast calculation
- 1.4 Primary research & validation
- 1.4.1 Primary sources
- 1.4.2 Data mining sources
- 1.5 Market definitions
Chapter 2 Executive Summary
- 2.1 Industry synopsis, 2021 – 2034
Chapter 3 Industry Insights
- 3.1 Industry ecosystem
- 3.2 Regulatory landscape
- 3.3 Industry impact forces
- 3.3.1 Growth drivers
- 3.3.2 Industry pitfalls & challenges
- 3.4 Growth potential analysis
- 3.5 Porter's analysis
- 3.5.1 Bargaining power of suppliers
- 3.5.2 Bargaining power of buyers
- 3.5.3 Threat of new entrants
- 3.5.4 Threat of substitutes
- 3.6 PESTEL analysis
Chapter 4 Competitive landscape, 2024
- 4.1 Introduction
- 4.2 Strategic dashboard
- 4.3 Innovation & technology landscape
Chapter 5 Market Size and Forecast, By Technology, 2021 – 2034 (USD Million & Units)
- 5.1 Key trends
- 5.2 Ultraviolet
- 5.3 Cold plasma
- 5.4 Corona discharge
- 5.5 Electrolytic
Chapter 6 Market Size and Forecast, By Application, 2021 – 2034 (USD Million & Units)
- 6.1 Key trends
- 6.2 Water treatment
- 6.3 Laboratory & medical equipment
- 6.4 Air Treatment
- 6.5 Others
Chapter 7 Market Size and Forecast, By Capacity, 2021 – 2034 (USD Million & Units)
- 7.1 Key trends
- 7.2 ≤ 5 gm/hr
- 7.3 5 gm/hr - 100 gm/hr
- 7.4 100 gm/hr - 1 kg/hr
- 7.5 1 kg/hr - 5 kg/hr
- 7.6 > 5 kg/hr
Chapter 8 Market Size and Forecast, By Region, 2021 – 2034 (USD Million & Units)
- 8.1 Key trends
- 8.2 North America
- 8.2.1 U.S.
- 8.2.2 Canada
- 8.3 Europe
- 8.3.1 Germany
- 8.3.2 UK
- 8.3.3 France
- 8.3.4 Russia
- 8.3.5 Italy
- 8.3.6 Spain
- 8.4 Asia Pacific
- 8.4.1 China
- 8.4.2 Australia
- 8.4.3 India
- 8.4.4 Japan
- 8.4.5 South Korea
- 8.5 Middle East & Africa
- 8.5.1 Saudi Arabia
- 8.5.2 UAE
- 8.5.3 Egypt
- 8.5.4 Turkey
- 8.5.5 South Africa
- 8.6 Latin America
- 8.6.1 Brazil
- 8.6.2 Argentina
Chapter 9 Company Profiles
- 9.1 BIO-UV
- 9.2 DEL Ozone
- 9.3 Eltech Ozone
- 9.4 Faraday Ozone
- 9.5 Lenntech Water Treatment
- 9.6 ORAIPL
- 9.7 Oxidation Technologies
- 9.8 Oxyzone International
- 9.9 Ozone Solutions
- 9.10 Primozone
- 9.11 SUEZ Group
- 9.12 Veolia
 紫外線臭氧消毒設備:全球市佔率及排名、總收入及需求預測(2025-2031年)
 臭氧產生器市場按應用、最終用戶、類型、技術和分銷管道分類—全球預測 2025-2032
 全球工業製氧機市場(按氣體類型/流量、尺寸、設計、技術、最終用途產業和地區分類)- 預測至2030年
 2025年全球臭氧產生器市場報告
 2025-2033年臭氧發生器市場報告(依技術、應用、最終用途及地區)
 全球市政臭氧發生器市場全球工業臭氧產生器市場臭氧產生器市場規模、佔有率和趨勢分析報告:按技術、應用、最終用途、地區和細分市場預測,2025 年至 2033 年2025年全球水處理臭氧產生器市場報告日本臭氧發生器市場報告(按技術、應用、最終用戶和地區)2025-2033