


 |
市場調查報告書
商品編碼
1716627
視網膜母細胞瘤治療市場機會、成長動力、產業趨勢分析及 2025 - 2034 年預測Retinoblastoma Treatment Market Opportunity, Growth Drivers, Industry Trend Analysis, and Forecast 2025 - 2034 |
||||||
2024 年全球視網膜母細胞瘤治療市值為 16 億美元,預計 2025 年至 2034 年期間的複合年成長率為 5%。這一成長主要得益於視網膜母細胞瘤發病率的上升、標靶治療的不斷進步以及眼科腫瘤學的持續創新。隨著這種罕見但嚴重的眼癌在兒童中的發生率不斷上升,對有效治療策略的需求變得前所未有的迫切。研究機構和製藥公司正在積極投資開發能夠改善患者治療效果同時最大限度減少不良影響的新療法。
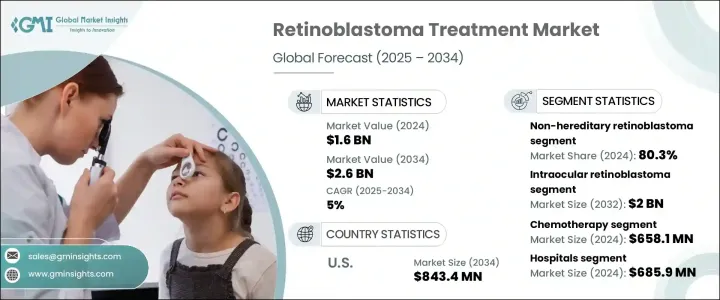
世界各國政府和醫療保健組織正在進行宣傳活動,促進早期診斷,顯著提高存活率。動脈內化療和玻璃體內化療等先進治療方式的出現正在改變視網膜母細胞瘤的治療模式。基因治療和精準醫療等新興技術進一步推動了市場樂觀情緒。此外,人工智慧在眼科腫瘤學中的應用正在幫助專家在早期階段發現視網膜母細胞瘤,從而提高治療效果。隨著各大醫院和癌症中心擴大兒科腫瘤科室,獲得專門的視網膜母細胞瘤治療的機會變得越來越普遍,從而推動了市場擴張。
| 市場範圍 | |
|---|---|
| 起始年份 | 2024 |
| 預測年份 | 2025-2034 |
| 起始值 | 16億美元 |
| 預測值 | 26億美元 |
| 複合年成長率 | 5% |
視網膜母細胞瘤治療市場分為眼內視網膜母細胞瘤及眼外視網膜母細胞瘤。隨著眼內視網膜母細胞瘤發生率的上升以及創新治療方法的日益普及,預計到 2032 年眼內治療領域將創造 20 億美元的產值。人們對玻璃體內和動脈內化療的日益青睞極大地促進了這一領域的成長,因為與傳統化療相比,這些方法有助於降低全身毒性。患者和醫療保健提供者正在積極尋求能夠提高療效同時最大限度減少長期副作用的治療方案,這進一步推動了市場需求。
就最終用途而言,醫院主導了視網膜母細胞瘤治療市場,2024 年創造了 6.859 億美元的收入。隨著醫院對腫瘤科和專門的兒科眼科部門進行大量投資,由眼科醫生、遺傳專家和腫瘤學家組成的多學科團隊正在合作開發有針對性的治療方法。醫院環境中化療中心的整合提高了治療的可近性,使醫院成為視網膜母細胞瘤管理的關鍵參與者。隨著醫療機構不斷採用尖端技術和治療方案,醫院領域將在未來幾年實現持續成長。
2024 年,美國視網膜母細胞瘤治療市場規模達到 5.255 億美元,病例數的增加歸因於兒童 RB1 基因突變盛行率的增加。美國國家癌症研究所和美國癌症協會正在透過宣傳活動積極推動早期檢測計劃,這加速了對先進治療方案的需求。美國各地領先的醫療保健提供者正在投資新療法、臨床試驗和專門的兒科腫瘤中心,以改善患者的治療效果。隨著精準醫療和標靶治療方法的不斷進步,美國預計將繼續在全球視網膜母細胞瘤治療市場佔據主導地位。
目錄
第1章:方法論與範圍
第2章:執行摘要
第3章:行業洞察
- 產業生態系統分析
- 產業衝擊力
- 成長動力
- 視網膜母細胞瘤發生率不斷上升
- 視網膜母細胞瘤的早期診斷與治療
- 產業陷阱與挑戰
- 治療費用高
- 視網膜母細胞瘤治療的副作用
- 成長動力
- 成長潛力分析
- 監管格局
- 技術格局
- 未來市場趨勢
- 差距分析
- 專利分析
- 管道分析
- 波特的分析
- PESTEL分析
第4章:競爭格局
- 介紹
- 公司市佔率分析
- 公司矩陣分析
- 主要市場參與者的競爭分析
- 競爭定位矩陣
- 策略儀表板
第5章:市場估計與預測:依疾病類型,2021 年至 2034 年
- 主要趨勢
- 非遺傳性視網膜母細胞瘤
- 遺傳性視網膜母細胞瘤
第6章:市場估計與預測:依疾病階段,2021 年至 2034 年
- 主要趨勢
- 眼內視網膜母細胞瘤
- 眼外視網膜母細胞瘤
第7章:市場估計與預測:依治療類型,2021 年至 2034 年
- 主要趨勢
- 化療
- 放射治療
- 手術
- 雷射治療
- 冷凍療法
第8章:市場估計與預測:依最終用途,2021 年至 2034 年
- 主要趨勢
- 醫院
- 癌症治療中心
- 專科眼科診所
第9章:市場估計與預測:按地區,2021 年至 2034 年
- 主要趨勢
- 北美洲
- 美國
- 加拿大
- 歐洲
- 德國
- 英國
- 法國
- 西班牙
- 義大利
- 荷蘭
- 亞太地區
- 中國
- 日本
- 印度
- 澳洲
- 韓國
- 拉丁美洲
- 巴西
- 墨西哥
- 阿根廷
- 中東和非洲
- 南非
- 沙烏地阿拉伯
- 阿拉伯聯合大公國
第10章:公司簡介
- Advancium Health
- Baxter International
- Bristol-Myers Squibb Company
- Cadila Pharmaceuticals
- Cellceutix Corporation
- GlaxoSmithKline
- Johnson & Johnson
- Merck & Co.
- Novartis
- Pfizer
- Teva Pharmaceutical Industries
- Theriva Biologics
The Global Retinoblastoma Treatment Market was valued at USD 1.6 billion in 2024 and is projected to grow at a CAGR of 5% between 2025 and 2034. This growth is primarily driven by the rising incidence of retinoblastoma, increasing advancements in targeted therapies, and continuous innovations in ocular oncology. With the prevalence of this rare but serious eye cancer rising among children, the need for effective treatment strategies has never been more critical. Research institutions and pharmaceutical companies are aggressively investing in the development of novel therapies that can enhance patient outcomes while minimizing adverse effects.
Governments and healthcare organizations worldwide are launching awareness campaigns to promote early diagnosis, significantly improving survival rates. The availability of advanced treatment modalities, including intra-arterial chemotherapy and intravitreal chemotherapy, is transforming the landscape of retinoblastoma management. Emerging technologies, such as gene therapy and precision medicine, are further driving optimism in the market. Additionally, the integration of artificial intelligence in ocular oncology is helping specialists detect retinoblastoma at earlier stages, improving treatment efficacy. With major hospitals and cancer centers expanding pediatric oncology units, access to specialized retinoblastoma care is becoming more widespread, fueling market expansion.
| Market Scope | |
|---|---|
| Start Year | 2024 |
| Forecast Year | 2025-2034 |
| Start Value | $1.6 Billion |
| Forecast Value | $2.6 Billion |
| CAGR | 5% |
The market for retinoblastoma treatment is segmented into intraocular and extraocular retinoblastoma. The intraocular segment is expected to generate USD 2 billion by 2032, driven by the rising incidence of intraocular retinoblastoma cases and the growing adoption of innovative treatment methods. The increasing preference for intravitreal and intra-arterial chemotherapy is significantly contributing to this segment's growth, as these methods help reduce systemic toxicity compared to traditional chemotherapy. Patients and healthcare providers are actively seeking treatment options that offer improved efficacy while minimizing long-term side effects, which is further propelling market demand.
In terms of end-use, hospitals dominated the retinoblastoma treatment market, generating USD 685.9 million in 2024. With hospitals making significant investments in oncology and specialized pediatric ophthalmology units, multidisciplinary teams comprising ophthalmologists, genetic specialists, and oncologists are collaborating to develop targeted treatment approaches. The integration of chemotherapy centers within hospital settings is enhancing treatment accessibility, positioning hospitals as key players in retinoblastoma management. As medical institutions continue to adopt cutting-edge technologies and treatment protocols, the hospital segment is set to witness sustained growth over the coming years.
U.S. retinoblastoma treatment market generated USD 525.5 million in 2024, with rising cases attributed to the increasing prevalence of RB1 gene mutations among children. The National Cancer Institute and the American Cancer Society are actively promoting early detection initiatives through awareness campaigns, which are accelerating the demand for advanced treatment options. Leading healthcare providers across the U.S. are investing in novel therapies, clinical trials, and specialized pediatric oncology centers to improve patient outcomes. With continued advancements in precision medicine and targeted treatment approaches, the U.S. is expected to remain a dominant player in the global retinoblastoma treatment market.
Table of Contents
Chapter 1 Methodology and Scope
- 1.1 Market scope and definitions
- 1.2 Research design
- 1.2.1 Research approach
- 1.2.2 Data collection methods
- 1.3 Base estimates and calculations
- 1.3.1 Base year calculation
- 1.3.2 Key trends for market estimation
- 1.4 Forecast model
- 1.5 Primary research and validation
- 1.5.1 Primary sources
- 1.5.2 Data mining sources
Chapter 2 Executive Summary
- 2.1 Industry 360° Synopsis
Chapter 3 Industry Insights
- 3.1 Industry ecosystem analysis
- 3.2 Industry impact forces
- 3.2.1 Growth drivers
- 3.2.1.1 Increasing incidence of retinoblastoma
- 3.2.1.2 Early diagnosis and treatment of retinoblastoma
- 3.2.2 Industry pitfalls and challenges
- 3.2.2.1 High treatment cost
- 3.2.2.2 Side effects associated with retinoblastoma treatment
- 3.2.1 Growth drivers
- 3.3 Growth potential analysis
- 3.4 Regulatory landscape
- 3.5 Technological landscape
- 3.6 Future market trends
- 3.7 Gap analysis
- 3.8 Patent analysis
- 3.9 Pipeline analysis
- 3.10 Porter's analysis
- 3.11 PESTEL analysis
Chapter 4 Competitive Landscape, 2024
- 4.1 Introduction
- 4.2 Company market share analysis
- 4.3 Company matrix analysis
- 4.4 Competitive analysis of major market players
- 4.5 Competitive positioning matrix
- 4.6 Strategy dashboard
Chapter 5 Market Estimates and Forecast, By Disease Type, 2021 – 2034 ($ Mn)
- 5.1 Key trends
- 5.2 Non-hereditary retinoblastoma
- 5.3 Hereditary retinoblastoma
Chapter 6 Market Estimates and Forecast, By Disease Stage, 2021 – 2034 ($ Mn)
- 6.1 Key trends
- 6.2 Intraocular retinoblastoma
- 6.3 Extraocular retinoblastoma
Chapter 7 Market Estimates and Forecast, By Treatment Type, 2021 – 2034 ($ Mn)
- 7.1 Key trends
- 7.2 Chemotherapy
- 7.3 Radiation therapy
- 7.4 Surgery
- 7.5 Laser therapy
- 7.6 Cryotherapy
Chapter 8 Market Estimates and Forecast, By End Use, 2021 – 2034 ($ Mn)
- 8.1 Key trends
- 8.2 Hospitals
- 8.3 Cancer treatment center
- 8.4 Specialty eye clinics
Chapter 9 Market Estimates and Forecast, By Region, 2021 – 2034 ($ Mn)
- 9.1 Key trends
- 9.2 North America
- 9.2.1 U.S.
- 9.2.2 Canada
- 9.3 Europe
- 9.3.1 Germany
- 9.3.2 UK
- 9.3.3 France
- 9.3.4 Spain
- 9.3.5 Italy
- 9.3.6 Netherlands
- 9.4 Asia Pacific
- 9.4.1 China
- 9.4.2 Japan
- 9.4.3 India
- 9.4.4 Australia
- 9.4.5 South Korea
- 9.5 Latin America
- 9.5.1 Brazil
- 9.5.2 Mexico
- 9.5.3 Argentina
- 9.6 Middle East and Africa
- 9.6.1 South Africa
- 9.6.2 Saudi Arabia
- 9.6.3 UAE
Chapter 10 Company Profiles
- 10.1 Advancium Health
- 10.2 Baxter International
- 10.3 Bristol-Myers Squibb Company
- 10.4 Cadila Pharmaceuticals
- 10.5 Cellceutix Corporation
- 10.6 GlaxoSmithKline
- 10.7 Johnson & Johnson
- 10.8 Merck & Co.
- 10.9 Novartis
- 10.10 Pfizer
- 10.11 Teva Pharmaceutical Industries
- 10.12 Theriva Biologics
