


 |
市場調查報告書
商品編碼
1666935
公車市場機會、成長動力、產業趨勢分析與 2025 - 2034 年預測Transit Bus Market Opportunity, Growth Drivers, Industry Trend Analysis, and Forecast 2025 - 2034 |
||||||
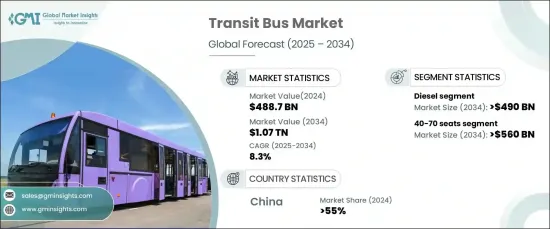
全球公車市場正在經歷顯著成長,預計到 2024 年將達到 4,887 億美元的價值,2025 年至 2034 年的複合年成長率預計為 8.3%。隨著城市面積的擴大,對高效、永續的公共交通解決方案的需求日益加劇。交通運輸部門正在努力實現公車網路現代化,以滿足不斷成長的人口的需求、提高機動性並減少交通堵塞。對便利、經濟的交通選擇的需求不斷成長,進一步促使政府投資即時追蹤系統和更智慧的路線解決方案等先進技術,將公車定位為實現經濟成長和環境目標的關鍵。
永續交通的需求也推動交通運輸產業走向零排放解決方案。世界各國政府都在強制採用電動和氫動力公車,以實現雄心勃勃的碳減排目標。透過制定旨在減少排放的嚴格法規和政策,各國政府正在提供財政激勵措施來支持向更綠色技術的轉變。轉向更清潔汽車的是對氣候變遷問題和改善城市空氣品質需求的直接回應。因此,交通運輸業的企業正在抓住新機遇,將電動和氫動力公車納入其車隊。
| 市場範圍 | |
|---|---|
| 起始年份 | 2024 |
| 預測年份 | 2025-2034 |
| 起始值 | 4887億美元 |
| 預測值 | 1.07兆美元 |
| 複合年成長率 | 8.3% |
市場按燃料類型細分,其中柴油、壓縮天然氣、電動和其他是主要類別。柴油公車目前佔據市場主導地位,到 2024 年將佔據 51% 以上的市場佔有率。混合動力柴油電動系統也越來越受歡迎,為傳統柴油公車和全電動車型之間提供了過渡選擇。這些系統將柴油引擎的燃油效率與電動馬達的優點(例如再生煞車和最佳化能源管理)結合在一起,使其成為在向全面電氣化過渡的同時減少排放的可行解決方案。
座位容量在塑造市場方面起著重要作用,公車通常分為三類:40 座以下、40-70 座和 70 座以上。隨著電動動力系統和電池技術的進步,預計到 2034 年,40-70 座級飛機市場的規模將超過 5,600 億美元。製造商越來越注重最佳化電池性能以提高續航里程、充電速度和成本效益。鋰離子和固態電池的創新有望延長運行週期並降低生產成本,從而促進電動公車的更廣泛應用。
就區域市場而言,中國繼續引領全球公車市場,到 2024 年將貢獻超過 55% 的收入。慷慨的政府補貼和激勵措施在支持電動公車的普及方面發揮了重要作用,特別是在大城市,電動公車已成為公共交通系統的重要組成部分。中國領先的製造商在這項轉型中發揮著至關重要的作用,為國家實現全電動公共交通車隊的目標做出了貢獻。
目錄
第 1 章:方法論與範圍
- 研究設計
- 研究方法
- 資料收集方法
- 基礎估計和計算
- 基準年計算
- 市場估計的主要趨勢
- 預測模型
- 初步研究與驗證
- 主要來源
- 資料探勘來源
- 市場定義
第 2 章:執行摘要
第 3 章:產業洞察
- 產業生態系統分析
- 供應商概況
- 零件製造商
- 汽車OEM
- 一級供應商
- 充電基礎設施供應商
- 最終用途
- 利潤率分析
- 技術差異化
- 電動動力總成技術
- 半自主能力
- 物聯網整合
- 氫燃料電池技術
- 其他
- 重要新聞及舉措
- 專利分析
- 監管格局
- 衝擊力
- 成長動力
- 都市化進程加快,城市人口密度增加
- 環境法規的採用日益嚴格
- 公車電氣化程度不斷提高
- 公共交通基礎設施投資不斷增加
- 產業陷阱與挑戰
- 初期投資成本高
- 充電基礎設施法規
- 成長動力
- 成長潛力分析
- 波特的分析
- PESTEL 分析
第4章:競爭格局
- 介紹
- 公司市佔率分析
- 競爭定位矩陣
- 戰略展望矩陣
第5章:市場估計與預測:按燃料,2021 - 2034 年
- 主要趨勢
- 柴油引擎
- 壓縮天然氣(CNG)
- 電的
- 純電動車
- 燃料電池電動車
- 油電混合車
第6章:市場估計與預測:依座位容量,2021 - 2034 年
- 主要趨勢
- 40席以下
- 城市交通
- 郊區交通
- 城際
- 其他
- 40-70個席位
- 城市交通
- 郊區交通
- 城際
- 其他
- 70席以上
- 城市交通
- 郊區交通
- 城際
- 其他
第 7 章:市場估計與預測:按應用,2021 - 2034 年
- 主要趨勢
- 城市交通
- 郊區交通
- 城際
- 其他
第 8 章:市場估計與預測:按地區,2021 - 2034 年
- 主要趨勢
- 北美洲
- 美國
- 加拿大
- 歐洲
- 英國
- 德國
- 法國
- 西班牙
- 義大利
- 俄羅斯
- 北歐
- 亞太地區
- 中國
- 印度
- 日本
- 韓國
- 澳新銀行
- 東南亞
- 拉丁美洲
- 巴西
- 墨西哥
- 阿根廷
- 中東及非洲
- 阿拉伯聯合大公國
- 南非
- 沙烏地阿拉伯
第9章:公司簡介
- Anhui Ankai Automobile
- Ashok Leyland
- Beiqi Foton Motor
- BYD
- Daimler
- Ebusco
- Irizar Group
- IVECO
- King Long United Automotive Industry
- MAN
- NFI Group
- Proterra
- Scania
- Solaris Bus & Couch
- TATA Motors
- VDL Bus & Coach
- Volvo
- Xiamen Golden Dragon Bus
- Yutong
- Zhengzhou Yutong Bus
- Zhongtong Bus
The Global Transit Bus Market is experiencing significant growth, projected to reach a value of USD 488.7 billion by 2024, with an expected CAGR of 8.3% from 2025 to 2034. This growth is driven by urbanization and the increasing density of populations in cities worldwide. As urban areas expand, the demand for efficient, sustainable public transportation solutions is intensifying. Transit agencies are working to modernize bus networks to meet the needs of growing populations, improve mobility, and reduce congestion. The rising demand for accessible, cost-effective transport options is further motivating governments to invest in advanced technologies like real-time tracking systems and smarter routing solutions, positioning buses as key to achieving both economic growth and environmental goals.
The need for sustainable transportation is also pushing the transit sector towards zero-emission solutions. Governments worldwide are mandating the adoption of electric and hydrogen-powered buses to meet ambitious carbon reduction targets. With strict regulations and policies aimed at reducing emissions, governments are offering financial incentives to support the shift toward greener technologies. This transition to cleaner vehicles is a direct response to climate change concerns and the need for better urban air quality. As a result, businesses in the transit sector are seizing new opportunities to integrate electric and hydrogen-powered buses into their fleets.
| Market Scope | |
|---|---|
| Start Year | 2024 |
| Forecast Year | 2025-2034 |
| Start Value | $488.7 Billion |
| Forecast Value | $1.07 Trillion |
| CAGR | 8.3% |
The market is segmented by fuel type, with diesel, CNG, electric, and others being the key categories. Diesel buses currently dominate the market, holding over 51% of the market share in 2024. However, advancements in emission control technologies, such as selective catalytic reduction (SCR) and diesel particulate filters (DPF), are enabling diesel buses to meet increasingly stringent environmental standards. Hybrid diesel-electric powertrains are also gaining popularity, providing a transitional option between traditional diesel buses and fully electric models. These systems combine the fuel efficiency of diesel engines with the benefits of electric motors, such as regenerative braking and optimized energy management, making them a viable solution for reducing emissions while transitioning to full electrification.
Seating capacity plays a significant role in shaping the market, with buses typically falling into three categories: below 40 seats, 40-70 seats, and above 70 seats. The 40-70 seat segment is anticipated to exceed USD 560 billion by 2034, driven by advances in electric powertrains and battery technologies. Manufacturers are increasingly focused on optimizing battery performance to improve range, charging speed, and cost-efficiency. Innovations in lithium-ion and solid-state batteries are expected to extend operational cycles and lower production costs, facilitating wider adoption of electric buses.
In terms of regional markets, China continues to lead the global transit bus market, contributing over 55% of revenue in 2024. Stringent government policies aimed at reducing emissions and improving air quality have accelerated the shift to electric buses. Generous government subsidies and incentives have played a significant role in supporting the adoption of electric buses, particularly in major cities where these buses are becoming a crucial part of public transport systems. Leading manufacturers in China are playing a vital role in this transformation, contributing to the country's goal of achieving a fully electric public transport fleet.
Table of Contents
Chapter 1 Methodology & Scope
- 1.1 Research design
- 1.1.1 Research approach
- 1.1.2 Data collection methods
- 1.2 Base estimates and calculations
- 1.2.1 Base year calculation
- 1.2.2 Key trends for market estimates
- 1.3 Forecast model
- 1.4 Primary research & validation
- 1.4.1 Primary sources
- 1.4.2 Data mining sources
- 1.5 Market definitions
Chapter 2 Executive Summary
- 2.1 Industry 3600 synopsis, 2021 - 2034
Chapter 3 Industry Insights
- 3.1 Industry ecosystem analysis
- 3.2 Supplier landscape
- 3.2.1 Component manufacturers
- 3.2.2 Automotive OEM
- 3.2.3 Tier-1 suppliers
- 3.2.4 Charging infrastructure providers
- 3.2.5 End use
- 3.3 Profit margin analysis
- 3.4 Technology differentiators
- 3.4.1 Electric powertrain technology
- 3.4.2 Semi-autonomous capabilities
- 3.4.3 IoT integration
- 3.4.4 Hydrogen fuel cell technology
- 3.4.5 Others
- 3.5 Key news & initiatives
- 3.6 Patent analysis
- 3.7 Regulatory landscape
- 3.8 Impact forces
- 3.8.1 Growth drivers
- 3.8.1.1 Growing urbanization and increasing population density in urban areas
- 3.8.1.2 Growing adoption of environmental regulations
- 3.8.1.3 Growing electrification of transit buses
- 3.8.1.4 Growing infrastructure investments in public transportation
- 3.8.2 Industry pitfalls & challenges
- 3.8.2.1 High initial investment costs
- 3.8.2.2 Charging infrastructure regulations
- 3.8.1 Growth drivers
- 3.9 Growth potential analysis
- 3.10 Porter’s analysis
- 3.11 PESTEL analysis
Chapter 4 Competitive Landscape, 2024
- 4.1 Introduction
- 4.2 Company market share analysis
- 4.3 Competitive positioning matrix
- 4.4 Strategic outlook matrix
Chapter 5 Market Estimates & Forecast, By Fuel, 2021 - 2034 ($Bn, Units)
- 5.1 Key trends
- 5.2 Diesel
- 5.3 Compressed natural gas (CNG)
- 5.4 Electric
- 5.4.1 Battery electric vehicle
- 5.4.2 Fuel cell electric vehicle
- 5.4.3 Hybrid electric vehicle
Chapter 6 Market Estimates & Forecast, By Seating Capacity, 2021 - 2034 ($Bn, Units)
- 6.1 Key trends
- 6.2 Below 40 seats
- 6.2.1 Urban transit
- 6.2.2 Suburban transit
- 6.2.3 Intercity
- 6.2.4 Others
- 6.3 40-70 seats
- 6.3.1 Urban transit
- 6.3.2 Suburban transit
- 6.3.3 Intercity
- 6.3.4 Others
- 6.4 Above 70 seats
- 6.4.1 Urban transit
- 6.4.2 Suburban transit
- 6.4.3 Intercity
- 6.4.4 Others
Chapter 7 Market Estimates & Forecast, By Application, 2021 - 2034 ($Bn, Units)
- 7.1 Key trends
- 7.2 Urban transit
- 7.3 Suburban transit
- 7.4 Intercity
- 7.5 Others
Chapter 8 Market Estimates & Forecast, By Region, 2021 - 2034 ($Bn, Units)
- 8.1 Key trends
- 8.2 North America
- 8.2.1 U.S.
- 8.2.2 Canada
- 8.3 Europe
- 8.3.1 UK
- 8.3.2 Germany
- 8.3.3 France
- 8.3.4 Spain
- 8.3.5 Italy
- 8.3.6 Russia
- 8.3.7 Nordics
- 8.4 Asia Pacific
- 8.4.1 China
- 8.4.2 India
- 8.4.3 Japan
- 8.4.4 South Korea
- 8.4.5 ANZ
- 8.4.6 Southeast Asia
- 8.5 Latin America
- 8.5.1 Brazil
- 8.5.2 Mexico
- 8.5.3 Argentina
- 8.6 MEA
- 8.6.1 UAE
- 8.6.2 South Africa
- 8.6.3 Saudi Arabia
Chapter 9 Company Profiles
- 9.1 Anhui Ankai Automobile
- 9.2 Ashok Leyland
- 9.3 Beiqi Foton Motor
- 9.4 BYD
- 9.5 Daimler
- 9.6 Ebusco
- 9.7 Irizar Group
- 9.8 IVECO
- 9.9 King Long United Automotive Industry
- 9.10 MAN
- 9.11 NFI Group
- 9.12 Proterra
- 9.13 Scania
- 9.14 Solaris Bus & Couch
- 9.15 TATA Motors
- 9.16 VDL Bus & Coach
- 9.17 Volvo
- 9.18 Xiamen Golden Dragon Bus
- 9.19 Yutong
- 9.20 Zhengzhou Yutong Bus
- 9.21 Zhongtong Bus
 包車服務市場:按服務類型、巴士容量、巴士類型、距離、最終用戶和預訂模式 - 2025-2030 年全球預測
 北美客車市場規模、佔有率及趨勢分析報告:按類型、燃料、座位容量、應用、國家及細分市場預測(2025-2030 年)
 公車受電弓充電器:市場佔有率分析、行業趨勢和統計數據、成長預測(2025-2030 年)公車:市場佔有率分析、行業趨勢和統計數據、成長預測(2025-2030 年)
 2025年全球公車和客車市場報告
 全球機場接駁車市場研究報告-產業分析、規模、佔有率、成長、趨勢與預測 2025 年至 2033 年受電弓公車充電器市場 - 全球產業規模、佔有率、趨勢、機會和預測,按充電類型、按組件類型、按充電基礎設施、按地區和競爭進行細分,2020-2030 年預測2025 年全球包車服務市場報告全球巴士和長途客車市場
 無軌電車市場至2030年的預測:按類型、車輛類型、動力來源、座位數、技術、應用、最終用戶和地區的全球分析