


 |
市場調查報告書
商品編碼
1666986
LNG 終端市場機會、成長動力、產業趨勢分析及 2025 - 2034 年預測LNG Terminal Market Opportunity, Growth Drivers, Industry Trend Analysis, and Forecast 2025 - 2034 |
||||||
2024 年全球液化天然氣終端市場價值為 79 億美元,預計 2025 年至 2034 年期間將以 13.9% 的強勁複合年成長率成長。天然氣因其高效性和較低的環境影響而成為人們首選的能源替代品。它燃燒更清潔,同時釋放更少的溫室氣體和污染物,這與全球對永續能源解決方案的日益關注相一致。 LNG基礎設施的技術進步也推動了市場成長,提高了營運效率並降低了專案成本。低溫儲存和液化製程的進步等關鍵創新提高了液化天然氣項目的經濟可行性,確保了市場採用率的穩定上升。
在追求成本效益和技術先進的解決方案的推動下,陸上液化天然氣終端產業的規模預計到 2034 年將超過 300 億美元。增強的液化方法、現代化的儲存系統和簡化的再氣化流程正在改變營運格局。小型本地化終端的開發正在滿足工業和遠端應用的特定能源需求,以支援更廣泛的能源可近性。這些進步正在加速陸上終端在向低碳能源系統轉變中的作用,確保可靠和永續的能源供應。
| 市場範圍 | |
|---|---|
| 起始年份 | 2024 |
| 預測年份 | 2025-2034 |
| 起始值 | 79億美元 |
| 預測值 | 320億美元 |
| 複合年成長率 | 13.9% |
同時,浮式液化天然氣終端市場由於其靈活性和成本效益而正在經歷巨大的發展勢頭。浮動碼頭設計用於在海上作業,具有移動性,無需大量的陸上基礎設施。這些碼頭受益於技術進步,安全性和營運效率不斷提高。增強的液化能力、更低的能源使用量以及減少甲烷排放的創新正在推動它們的吸引力,確保在不斷發展的能源市場中站穩腳跟。
在美國,液化天然氣終端市場規模預計到 2034 年將超過 170 億美元。配備最先進的液化和儲存系統的升級設施正在提高效率的同時降低營運成本。此外,該產業專注於採用環保技術和減排策略,從而形成更永續的能源框架。這些進步,加上能源消耗的增加和向環保解決方案的轉變,使美國成為全球液化天然氣領域的關鍵參與者。
目錄
第 1 章:方法論與範圍
- 市場定義
- 基礎估算與計算
- 預測計算
- 資料來源
- 基本的
- 次要
- 有薪資的
- 民眾
第 2 章:執行摘要
第 3 章:產業洞察
- 產業生態系統分析
- 監管格局
- 產業衝擊力
- 成長動力
- 產業陷阱與挑戰
- 成長潛力分析
- 波特的分析
- 供應商的議價能力
- 買家的議價能力
- 新進入者的威脅
- 替代品的威脅
- PESTEL 分析
第4章:競爭格局
- 介紹
- 戰略儀表板
- 創新與永續發展格局
第5章:市場規模及預測:依終端,2021 – 2034 年
- 主要趨勢
- 陸上
- 漂浮的
第6章:市場規模及預測:按地區,2021 – 2034 年
- 主要趨勢
- 北美洲
- 美國
- 加拿大
- 墨西哥
- 歐洲
- 英國
- 法國
- 荷蘭
- 西班牙
- 波蘭
- 俄羅斯
- 義大利
- 亞太地區
- 中國
- 印度
- 日本
- 韓國
- 澳洲
- 泰國
- 馬來西亞
- 印尼
- 中東和非洲
- 阿拉伯聯合大公國
- 卡達
- 阿曼
- 阿爾及利亞
- 埃及
- 拉丁美洲
- 巴西
- 阿根廷
第7章:公司簡介
- ADNOC
- AES
- BP
- Chevron
- CNPC
- Engas
- Engie
- Eni
- Equinor
- ExxonMobil
- Gazprom
- KNPC
- Pertamina
- Petronas
- Petronet
- Qatar Energy
- Repsol
- Shell
- Total
- Vopak
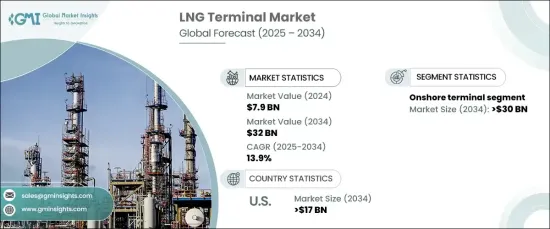
The Global LNG Terminal Market, valued at USD 7.9 billion in 2024, is projected to grow at a robust CAGR of 13.9% from 2025 to 2034. The shift towards cleaner energy sources and the global decline in coal and oil usage has significantly boosted the consumption of natural gas. Recognized for its efficiency and lower environmental impact, natural gas has become a preferred energy alternative. Its ability to burn more cleanly while releasing fewer greenhouse gases and pollutants aligns with the increasing global focus on sustainable energy solutions. Technological advancements in LNG infrastructure are also propelling market growth, making operations more efficient and reducing project costs. Key innovations, such as advancements in cryogenic storage and liquefaction processes, have enhanced the economic feasibility of LNG projects, ensuring a steady rise in market adoption.
The onshore LNG terminal sector is expected to exceed USD 30 billion by 2034, driven by the pursuit of cost-efficient and technologically advanced solutions. Enhanced liquefaction methods, modernized storage systems, and streamlined regasification processes are transforming the operational landscape. The development of smaller, localized terminals is meeting the specific energy demands of industrial and remote applications, supporting broader energy accessibility. These advancements are accelerating the role of onshore terminals in the shift towards low-carbon energy systems, ensuring reliable and sustainable energy supplies.
| Market Scope | |
|---|---|
| Start Year | 2024 |
| Forecast Year | 2025-2034 |
| Start Value | $7.9 Billion |
| Forecast Value | $32 Billion |
| CAGR | 13.9% |
Simultaneously, the floating LNG terminal market is experiencing substantial momentum due to its flexibility and cost-effectiveness. Floating terminals designed to operate in offshore locations, offer mobility and eliminate the need for extensive onshore infrastructure. These terminals are benefiting from technological progress, improving safety and operational efficiency. Enhanced liquefaction capabilities, lower energy usage, and innovations to mitigate methane emissions are driving their appeal, ensuring a stronger foothold in the evolving energy market.
In the United States, the LNG terminal market is anticipated to surpass USD 17 billion by 2034. Growing demand for cleaner energy at both domestic and international levels is fueling investments in advanced terminal infrastructure. Upgraded facilities with state-of-the-art liquefaction and storage systems are enhancing efficiency while reducing operational costs. Additionally, the industry's focus on adopting eco-friendly technologies and strategies for emissions reduction is shaping a more sustainable energy framework. These advancements, coupled with increasing energy consumption and a transition towards environmentally conscious solutions, are positioning the United States as a key player in the global LNG landscape.
Table of Contents
Chapter 1 Methodology & Scope
- 1.1 Market definitions
- 1.2 Base estimates & calculations
- 1.3 Forecast calculation
- 1.4 Data sources
- 1.4.1 Primary
- 1.4.2 Secondary
- 1.4.2.1 Paid
- 1.4.2.2 Public
Chapter 2 Executive Summary
- 2.1 Industry synopsis, 2021 - 2034
Chapter 3 Industry Insights
- 3.1 Industry ecosystem analysis
- 3.2 Regulatory landscape
- 3.3 Industry impact forces
- 3.3.1 Growth drivers
- 3.3.2 Industry pitfalls & challenges
- 3.4 Growth potential analysis
- 3.5 Porter's analysis
- 3.5.1 Bargaining power of suppliers
- 3.5.2 Bargaining power of buyers
- 3.5.3 Threat of new entrants
- 3.5.4 Threat of substitutes
- 3.6 PESTEL analysis
Chapter 4 Competitive Landscape, 2024
- 4.1 Introduction
- 4.2 Strategic dashboard
- 4.3 Innovation & sustainability landscape
Chapter 5 Market Size and Forecast, By Terminal, 2021 – 2034 (MTPA, USD Million)
- 5.1 Key trends
- 5.2 Onshore
- 5.3 Floating
Chapter 6 Market Size and Forecast, By Region, 2021 – 2034 (MTPA, USD Million)
- 6.1 Key trends
- 6.2 North America
- 6.2.1 U.S.
- 6.2.2 Canada
- 6.2.3 Mexico
- 6.3 Europe
- 6.3.1 UK
- 6.3.2 France
- 6.3.3 Netherlands
- 6.3.4 Spain
- 6.3.5 Poland
- 6.3.6 Russia
- 6.3.7 Italy
- 6.4 Asia Pacific
- 6.4.1 China
- 6.4.2 India
- 6.4.3 Japan
- 6.4.4 South Korea
- 6.4.5 Australia
- 6.4.6 Thailand
- 6.4.7 Malaysia
- 6.4.8 Indonesia
- 6.5 Middle East & Africa
- 6.5.1 UAE
- 6.5.2 Qatar
- 6.5.3 Oman
- 6.5.4 Algeria
- 6.5.5 Egypt
- 6.6 Latin America
- 6.6.1 Brazil
- 6.6.2 Argentina
Chapter 7 Company Profiles
- 7.1 ADNOC
- 7.2 AES
- 7.3 BP
- 7.4 Chevron
- 7.5 CNPC
- 7.6 Engas
- 7.7 Engie
- 7.8 Eni
- 7.9 Equinor
- 7.10 ExxonMobil
- 7.11 Gazprom
- 7.12 KNPC
- 7.13 Pertamina
- 7.14 Petronas
- 7.15 Petronet
- 7.16 Qatar Energy
- 7.17 Repsol
- 7.18 Shell
- 7.19 Total
- 7.20 Vopak
 大型液化LNG接收站市場(按服務、設施類型、所有者和應用)—2025-2032 年全球預測小型LNG接收站市場(按類型、供應類型和應用)—2025-2032 年全球預測全球LNG接收站市場(按終端類型、技術、儲存容量、位置和最終用途)預測 2025-2030
 2025年液化天然氣(LNG)虛擬管道全球市場報告
 全球大型液化LNG接收站市場
 液化天然氣基礎設施市場規模、佔有率、成長分析(按類型、按產品、按分佈、按最終用戶產業、按地區)- 產業預測,2025 年至 2032 年
 全球LNG接收站市場(按終端類型、容量、技術、功能和地區分類)- 2030 年預測LNG接收站市場分析及預測(至 2033 年):按類型、產品、服務、技術、組件、應用、最終用戶、安裝類型、設備大型液化天然氣終端市場:2033 年市場分析與預測 - 按類型、按產品、按服務、按技術、按組件、按應用、按流程、按最終用戶、按安裝類型
 大型LNG接收站:市場佔有率分析、產業趨勢與統計、成長預測(2025-2030 年)